

| Journal of Clinical Medicine Research, ISSN 1918-3003 print, 1918-3011 online, Open Access |
| Article copyright, the authors; Journal compilation copyright, J Clin Med Res and Elmer Press Inc |
| Journal website http://www.jocmr.org |
Original Article
Volume 12, Number 3, March 2020, pages 172-179
Serum Uric Acid, Serum Uric Acid to Serum Creatinine Ratio and Serum Bilirubin in Patients With Parkinson’s Disease: A Case-Control Study
Chayanon Songsomboona, b, Surat Tanprawatec, Atiwat Soontornpunc, Chayasak Wantaneeyawongc, d, Worawit Louthrenooa, e
aDivision of Rheumatology, Department of Internal Medicine, Faculty of Medicine, Chiang Mai University, Chiang Mai, Thailand
bCurrent address: Lampang Hospital, Lampang, Thailand
cDivision of Neurology, Department of Internal Medicine, Faculty of Medicine, Chiang Mai University, Chiang Mai, Thailand
dCurrent address: The Northern Neuroscience Center, Faculty of Medicine, Chiang Mai University, Chiang Mai, Thailand
eCorresponding Author: Worawit Louthrenoo, Division of Rheumatology, Department of Internal Medicine, Faculty of Medicine, Chiang Mai University, Chiang Mai, Thailand
Manuscript submitted December 30, 2019, accepted January 15, 2020
Short title: Uric Acid and Bilirubin in Parkinson’s Disease
doi: https://doi.org/10.14740/jocmr4079
| Abstract | ▴Top |
Background: Studies have shown that a low serum uric acid (SUA) level associates with Parkinson’s disease (PD), but many of them did not exclude patients with impaired renal function. Studies on the association between serum bilirubin level and PD also are limited. This study determined the association between SUA level, SUA/serum creatinine (SCr) ratio and serum bilirubin levels in PD patients with normal renal and liver functions.
Methods: The PD patients from a neurological clinic, and the controls from the club for the elderly, were recruited into this study. The PD stage and motor and non-motor function were determined by the Hoehn-Yahr (H&Y) scale and unified Parkinson’s disease rating scale (UPDRS), respectively.
Results: Sixty-one PD patients and 135 controls participated. The SUA/SCr ratio, but not SUA, was significantly lower in the PD patients than in the controls (4.12 ± 0.90 vs. 4.59 ± 1.04, P = 0.003). Serum total bilirubin (TB) and indirect bilirubin (IDB) were significantly higher in the PD patients (7.92 ± 3.67 µmol/L vs. 6.59 ± 2.78 µmol/L, P = 0.003 and 4.52 ± 2.48 µmol/L vs. 3.26 ± 1.82 µmol/L, P < 0.001), respectively. Serum TB and IDB, but not SUA or SUA/SCr ratio, were associated negatively with PD stages (P = 0.010 and P = 0.014, respectively). There was no association between TB, IDB, SUA or SUA/SCr ratio and PD disease duration or motor subtypes. No significant correlation was found between SUA or SUA/SCr ratio, serum TB and IDB.
Conclusion: The SUA/SCr ratio is more sensitive than SUA in determining their association with PD. The high serum TB and IDB levels in PD patients compared with the controls suggest that serum bilirubin might play a role in the pathogenesis of PD. However, the lack of association between SUA or the SUA/SCr ratio and serum TB or IDB suggests that these two biomarkers play a different role in the etiopathogenesis of PD.
Keywords: Uric acid; Serum uric acid to serum creatinine ratio; Serum bilirubin; Parkinson’s disease; Movement disorders
| Introduction | ▴Top |
Parkinson’s disease (PD) is a common neurodegenerative disease caused by progressive loss of dopaminergic neurons in the substantia nigra, together with the presence of lewy bodies [1, 2]. The cardinal clinical features of PD consist of both motor and non-motor features. The motor symptoms include bradykinesia, body rigidity, gait instability and resting tremor [1], whereas non-motor symptoms include sensory symptom of pain, autonomic nervous system and psychiatric dysfunction [3]. The pathogenesis of PD remains unclear, but the accumulation of oxidative oxygen species and other free radicals, or diminished anti-oxidant substance in brain tissues has been suggested [4, 5].
Both serum uric acid (SUA) and serum bilirubin have been well recognized as natural bodily anti-oxidants in humans [6, 7]. Many controlled studies and a recent meta-analysis have shown that low SUA level was associated with PD [8-15]. Two large prospective studies also found that individuals with a higher SUA level were associated with reduced risk of PD development [16, 17] and slower decline rate of neurological function [10, 18]. Postmortem studies also showed that the uric acid level in the brain tissue of PD patients, particularly at the cortex, striatal and substantia nigra, was significantly lower than that in the controls [19, 20]. These findings support the hypothesis that uric acid is associated with PD development, as its decrease in the brain reflects the lack of anti-oxidant substance in human brain tissue. In contrast to SUA, studies on the association between serum bilirubin, another anti-oxidant and PD are limited and have shown conflicting results [15, 21-23].
Serum creatinine (SCr) also is used commonly as an indicator for renal impairment [24]. SUA level in patients with renal impairment is high due to reduced renal clearance of uric acid. Moreover, SCr is affected by body mass, which makes it slightly higher in males than females. The SUA/SCr ratio, or renal-function that normalizes SUA, has been developed and used to reduce interference on SUA from sex and renal function.
It was interesting that many studies on the association between SUA level and PD did not provide information on renal function [8, 12, 13, 25, 26]. Even when renal function was reported or mentioned, cases with significantly impaired renal function were not excluded [9, 10, 15, 27]. The same was true for the study on association between serum bilirubin level and PD [15, 22], where patients with significant liver impairment were not mentioned or excluded, except for one [23].
The objective of this study was to determine the SUA level, SUA/SCr ratio and serum bilirubin level (total bilirubin (TB), direct bilirubin (DB) and indirect bilirubin (IDB)) in elderly Thai PD patients with normal renal and liver functions in comparison with their controls, and also determine their association with clinical parameters of PD.
| Materials and Methods | ▴Top |
Data source and population
This study was performed at the Neurological Clinic, Chiang Mai University Hospital between September 2015 and December 2016. All of the PD patients were 60 years of age or older, and taken care of by neurologists at this institution. Controls were aged over 60 years and without neurological problems, history of any neurological disease or family PD history. They also were members of a club for the elderly in the local community. The ratio of cases/controls was 1:2. All of the PD patients and controls were of Thai ethnicity and from the northern part of Thailand.
Inclusion and exclusion criteria, data collection and clinical measurement
The diagnosis of PD followed the criteria developed by the UK Parkinson’s Disease Society Brain Bank [28]. Patients with secondary PD, including drug-induced, familial and vascular PD, as well as PD with dementia and inability to communicate were excluded.
The clinical features of the PD patients were classified into five subgroups according to Hoehn-Yahr (H&Y) staging [29]. Severity levels were classified based on H&Y stage into mild, moderate and severe PD with H&Y stage of I and II, III, and IV and V, respectively [30]. The motor and non-motor symptoms were assessed using the unified Parkinson’s disease rating scale (UPDRS) [31]. The motor system was classified further into tremor dominant (TD) and postural instability/gait difficulty (PIGD), according to the motor symptom subtypes described by Stebbins et al [32]. All of the PD patients were asked to stop any medication that might influence motor function (such as L-dopa, anti-kinetic drugs, anti-cholinergic drugs, beta-blockers and benzodiazepines) for a minimum of 6 h before the physical examination.
Demographic data, including age, sex, body mass index (BMI), medication history, current medication as well as physical examination, were collected and examined by two investigators (CS and CW). Participants with prior or current significantly impaired liver (serum albumin less than 30.00 g/L, serum aspartate aminotransferase (AST) and serum alanine aminotransferase (ALT) more than two times above normal limits, and serum TB of more than 20.00 µmol/L) and renal functions (SCr ≥ 132.60 µmol/L), history or presence of benign or malignant tumors, history of gouty arthritis and current use of drugs that interfere with SUA such as allopurinol, uricosuric agents, diuretics, anti-tuberculosis, aspirin at over 325 mg/day, etc., were excluded.
On the day of the physical examination, blood samples, including complete blood count, blood urea nitrogen, SUA, SCr and liver function were collected and kept at -20 °C, and analyzed simultaneously. The estimated glomerular filtration rate (eGFR) was calculated further from SCr, using the Cockcroft-Gault formula [33]. Patients who had an eGFR of < 60 mL/min were considered to have significant renal insufficiency [34], and were excluded from the analysis.
Ethical approval
This study was performed in accordance with the ethical standards of the institutional and/or national research committee and the 1964 Declaration of Helsinki and its later amendments or comparable ethical standards. It also was approved by the Ethic Committee of the Faculty of Medicine, Chiang Mai University.
Statistical analysis
STATA 13.0 computer software (Stata Corporation, Texas, USA) was used for data processing and statistical analysis. Continuous variables were presented as mean ± standard deviation (SD), with categorical variables presented as percent. Non-normal distribution of continuous variables was presented as geometric mean (GM) with 95% confidence interval (95% CI). The Student’s t-test and Wilcoxon rank sum test were used to determine the differences between the two independent samples of continuous variables, with normal and non-normal distribution, respectively. The Chi-square test or Fisher’s exact test was used to determine the differences among the categorical variables, where appropriate. Correlation and linear regression analysis were determined by Pearson’s correlation and the F-test, respectively. Analysis of variance (ANOVA) and the Kruskal-Wallis equality-of-populations rank test were used to determine differences of more than two samples. Analysis of covariance (ANCOVA) was used to control the effect of extraneous variables. The Fisher’s least significant difference (LSD) test was used for pairwise multiple-comparisons. A P ≤ 0.05 was considered as a statistically significant difference.
| Results | ▴Top |
Demographic and laboratory findings between PD patients and controls
A total of 224 participants (73 PD and 151 controls) were enrolled initially into this study. However, 28 cases (12 PD and 16 controls) were excluded (missing laboratory results in one, and eGFR < 60 mL/min in 27); therefore, only 196 participants (61 PD patients and 135 controls) were included for the analysis.
Demographic data and laboratory findings of the PD patients and controls are shown in Table 1. Overall, the age of the PD patients was slightly but significantly higher than that of the controls. The PD patients had a significantly higher proportion with co-morbidities, including diabetes mellitus, hypertension and dyslipidemia, than the controls.
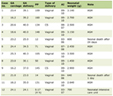 Click to view | Table 1. Demographic and Laboratory Findings Among Parkinson’s Disease Patients and Controls |
There was no significant difference in SUA level between the PD patients and controls. However, the SUA/SCr ratio was significantly lower in PD patients than in the controls (4.12 ± 0.90 vs. 4.59 ± 1.04, P = 0.003). A significantly lower SUA/SCr ratio was observed also in the female PD subgroup (4.08 ± 0.98 vs. 4.70 ± 1.02, P = 0.009). Male PD patients tended to have a lower SUA/SCr ratio than the controls, but this did not reach statistical significance (4.15 ± 0.85 vs. 4.48 ± 1.06, P = 0.113).
The PD patients had significantly higher serum TB and IDB levels than the controls (7.92 ± 3.67 µmol/L vs. 6.59 ± 2.78 µmol/L, P = 0.003 and 4.52 ± 2.48 µmol/L vs. 3.26 ± 1.82 µmol/L, P < 0.001, respectively). Serum TB level also was significantly higher in the female PD subgroup (7.61 ± 3.42 µmol/L vs. 5.88 ± 2.20 µmol/L, P = 0.026), but not in the male one. Significantly higher serum IDB also was observed in both the female and male PD subgroups than in their controls (4.44 ± 2.19 µmol/L vs. 2.91 ± 1.46 µmol/L, P = 0.001 and 4.59 ± 2.72 µmol/L vs. 3.61 ± 2.07 µmol/L, P = 0.011, respectively). Serum ALT was slightly, but significantly, lower in the PD patients than in the controls (P = 0.039).
Association between SUA, SUA/SCr ratio and serum bilirubin level according to the clinical characteristics of PD
The association between SUA level, SUA/SCr ratio, serum TB and IDB levels, according to the clinical characteristics of PD patients is shown in Table 2 and Figure 1. TB and IDB levels were transformed into geometric mean with 95% CI, because they did not show normal distribution. The analysis also was controlled by the age and co-morbidities as these two variables were significantly different between the PD patients and controls. There was no significant difference in mean SUA level or the SUA/SCr ratio in PD disease severity, disease duration (early disease determined by duration of less than 2 years) or motor symptom subtypes among the PD patients. However, there was a significant difference in serum TB and IDB levels among PD disease severity (P = 0.010 and P = 0.014, respectively). Further analysis showed that when PD patients with mild and moderate PD disease severity were compared to those with severe disease activity, the latter had a significantly lower TB (GM (95% CI) 5.56 (4.46 - 6.94) µmol/L vs. 7.65 (6.71 - 8.72) µmol/L and 8.72 (6.89 - 11.04) µmol/L, P = 0.009 and 0.005, respectively) and IDB level (2.96 (2.20 - 4.00) µmol/L vs. 4.28 (3.68 - 4.97) µmol/L and 4.93 (3.79 - 6.42) µmol/L, P = 0.012 and 0.008, respectively).
Click to view | Table 2. Serum Uric Acid Level, Serum Uric Acid/Creatinine Ratio and Serum Bilirubin Levels According to Clinical Characteristics of Parkinson’s Disease |
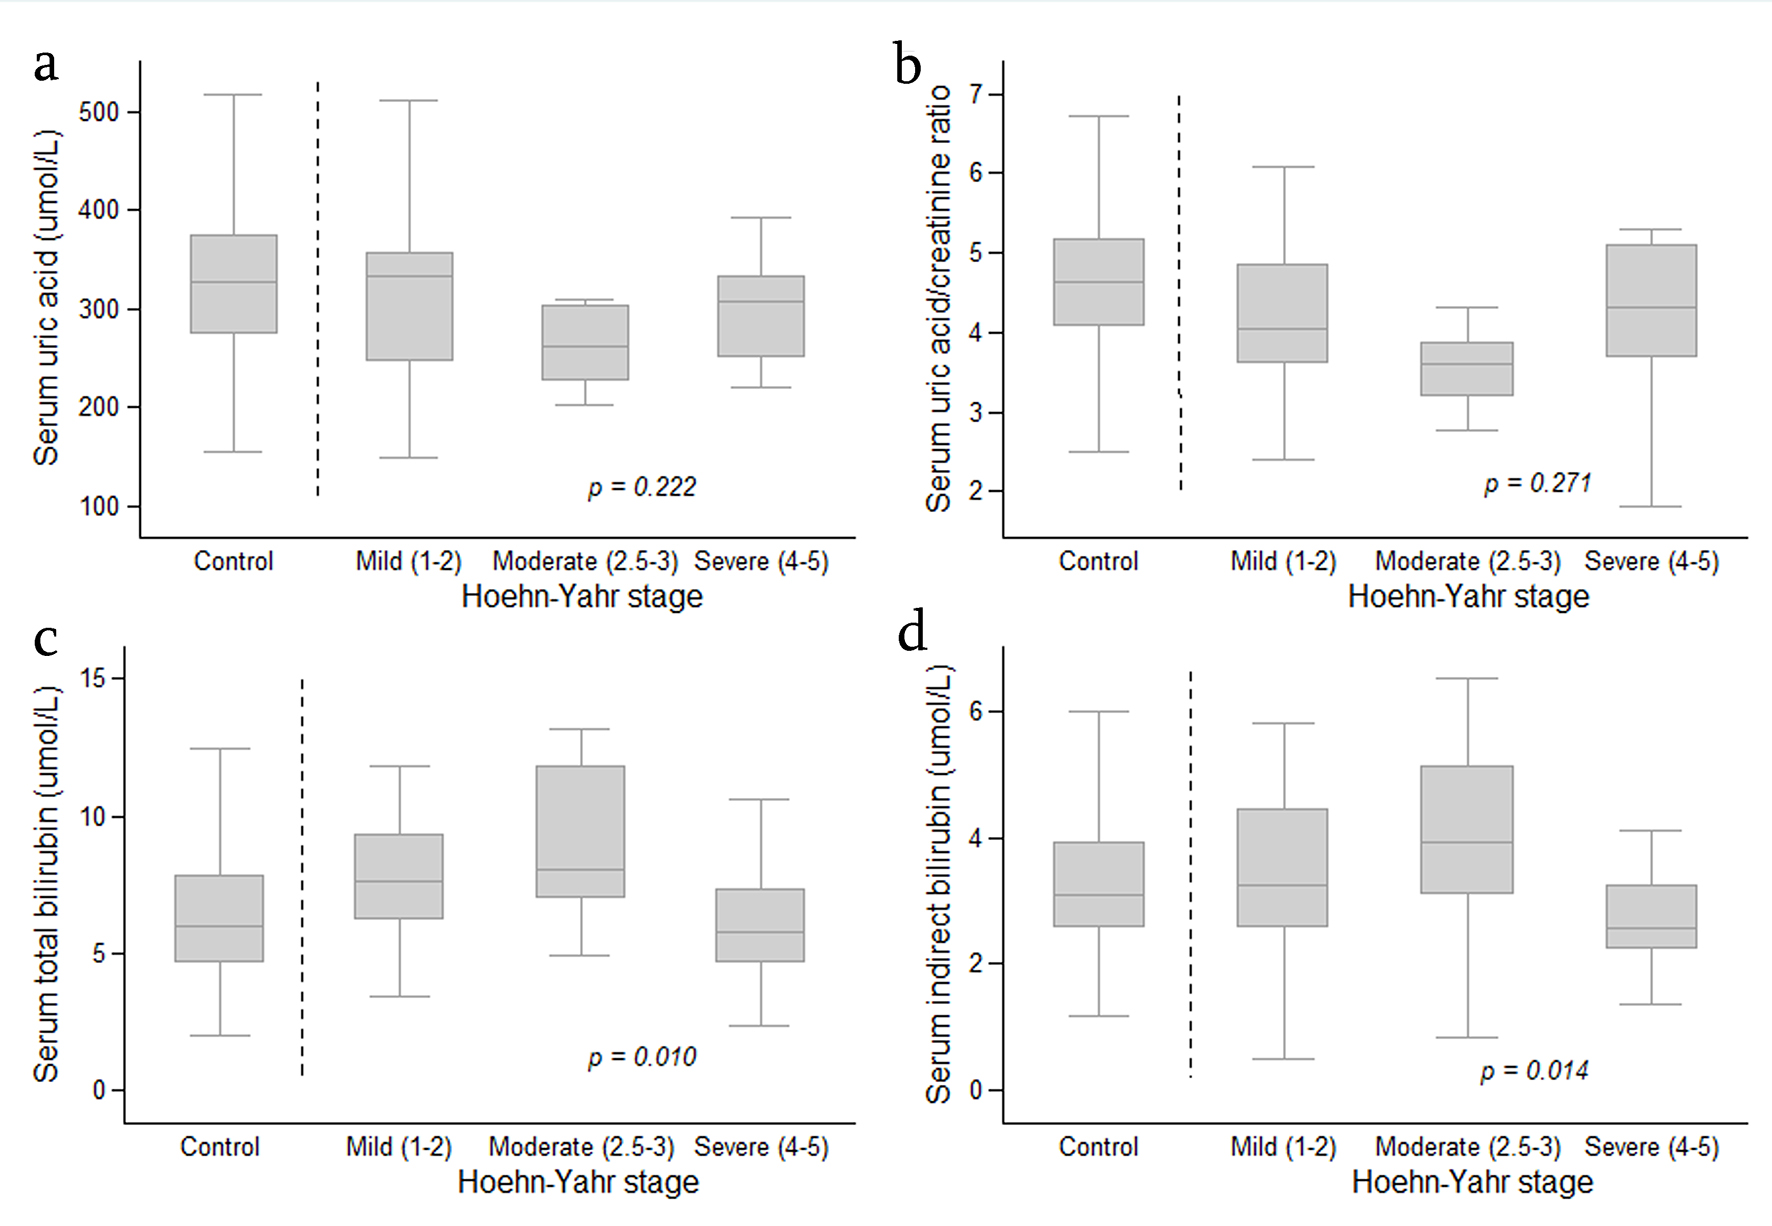 Click for large image | Figure 1. Boxplot graph showing distribution of serum uric acid level (a), serum uric acid/creatinine ratio (b), serum total bilirubin (c) and serum indirect bilirubin (d) in the controls and in patients with Parkinson’s disease (according to Hoehn-Yahr stage). The analysis was performed by Fisher’s least significant difference (LSD) test and was controlled by age and co-morbidities. Data are expressed as median, 25-75 percentile and minimum-maximum. |
Serum levels of TB and IDB in relation to PD disease severity in PD patients also were compared with the controls (Table 3). When compared with PD patients with mild and moderate disease activity, the controls significantly had lower TB level (GM (95% CI) 6.07 (5.67 - 6.51) µmol/L vs. 7.65 (6.71 - 8.72) µmol/L and 8.72 (6.89 - 11.04) µmol/L, P = 0.025 and 0.018, respectively) and IDB level (GM (95% CI) 2.78 (2.50 - 3.09) µmol/L vs. 4.28 (3.68 - 4.97) µmol/L and 4.93 (3.79 - 6.42) µmol/L, P = 0.001 and 0.004, respectively). There was no significant difference in TB and IDB levels between the controls and PD patients with severe PD disease.
Click to view | Table 3. Comparison of Serum Total Bilirubin and Indirect Bilirubin Among PD Patients According to PD Disease Severity and Controls |
No significant correlations between SUA level, SUA/SCr ratio or TB and IDB levels were identified (Table 4).
Click to view | Table 4. Correlation Between Serum Uric Acid, Serum Uric Acid/Serum Creatinine Ratio and Serum Total Bilirubin, Indirect Bilirubin |
| Discussion | ▴Top |
Key findings
This study found that the level of the SUA/SCr ratio, but not SUA itself, was significantly lower in elderly Thai PD patients with normal renal function. This observation also was seen in the subgroup of female PD patients. However, there was no association between levels of SUA or the SUA/SCr ratio and PD severity based on H&Y stage, PD disease duration or PD motor symptom subtypes. It is interesting that this study found the serum level of TB and IDB was significantly higher in PD patients than in their controls. The level of TB and IDB was significantly lower in PD patients with severe disease activity than in those with mild and moderate disease activity. No association between TB or IDB and PD disease duration or motor subtypes was identified.
SUA, SUA/SCr ratio and PD
This study could not confirm a significantly lower SUA level in PD patients than in the controls, as shown in many previous studies [8-13, 16, 17, 27]. This study was in line with two recent studies, which used Mendelian randomization, and found no association between SUA and the risk of PD development [35, 36]. However, this study found that PD patients had a significantly lower SUA/SCr ratio than the controls. This effect was observed also in the female PD patient subgroup. The male PD patient subgroup also had a lower SUA/SCr ratio than the controls, but it did not reach statistical significance. The reason for this was not clear, but it possibly related to the small number of patients studied. The significantly lower SUA/SCr ratio in PD patients than in the controls, as observed in this study, was similar to that previously reported in Thai and Chinese populations by Lolekha et al and Zhong et al, respectively [26, 27]. In addition, the SUA/SCr ratio in both studies not only showed that PD patients had a significantly greater SUA difference than the controls, but also a significantly negative association with PD staging, determined by the H&Y scale. Unfortunately, this study could not confirm the significantly negative association between the SUA/SCr ratio and PD staging, which might be due to the small number of patients in the moderate and severe PD subgroups.
Serum bilirubin and PD
Bilirubin is the end product of hemoglobin catabolism, and has been shown to have anti-oxidant activity in human brain tissue [37, 38]. In a review of the literature, only a few studies have focused on the association between serum bilirubin and PD, and they showed conflicting results [15, 21-23]. A retrospective study by Scigliano et al [21], involving 162 PD patients treated with L-dopa, 93 untreated PD patients and 224 non-PD controls (other neurological conditions), found that the mean serum TB was significantly higher among the treated PD group than in the untreated PD and control groups, but not between the untreated PD and control groups. The authors concluded that the reason for the high TB levels in L-dopa treated PD patients was not clear. A cross-sectional study by Moccia et al [22] found that the serum TB level was significantly higher in 75 newly diagnosed, drug-naive PD patients than in 75 controls (occupational hospital schedule visits). This difference also was seen in male and female subgroups. The negative relationships between TB level and UPDRS part III and the daily dosage of L-dopa treatment were found during the 2-year follow-up. Macias-Garcia et al [23] recently performed a cross-sectional study determining serum TB level in their 420 PD patients and 434 healthy controls, and found that the serum TB level in the PD patients was significantly higher than that in the controls, and the serum TB level showed a mild but significantly negative correlation with the PD disease duration. In contrast to the above studies, a large cross-sectional study by Qin et al [15], involving 425 PD patients and 460 controls, found no significant difference in serum TB levels between the PD patients and controls. The patients with PD had significantly higher serum DB, but lower IDB level, than the controls. A significantly high DB level also was observed in the female and male PD groups, but a lower IDB level was seen only in the male subgroup. The high DB and low IDB levels also were observed in early PD patients (duration < 2 years). However, there was no correlation between serum IDB and SUA in the PD patients.
Both TB and IDB levels in this study were significantly higher in PD patients than in the controls, and the levels in PD patients with mild and moderate disease severity were higher than those with severe disease severity, and the controls. The higher serum TB level in the PD patients was similar to that reported by Scigliano et al [21], Moccia et al [22] and Macias-Garcia et al [23]. The negative association of TB with PD stage seen in this study was in line with that of Moccia et al [22], who found that the TB levels showed negative association with UPDSR part III during their 2-year follow-up, which might indicate the progression of PD disease. Thus, the increased serum TB and IDB levels in mild and moderate PD disease severity, which was found to be higher than those in severe PD severity in this study, supported the postulation proposed by the aforementioned authors, in that the increase in serum TB level at the early stage of PD might be related to increase in compensation of the bodily anti-oxidant system. When the disease progressed with longer disease duration, the compensation mechanisms failed, leading to declining serum TB [21-23]. However, the significant increase in serum IDB level in PD patients in this study was in contrast to that of Qin et al [15] in which the reason was difficult to explain. Therefore, the role of serum bilirubin in association with PD needs further investigation.
Limitations and strength
The small number of patients might affect statistical analysis in this study; however, the number was not too small when compared with that in many previous reports [8, 9, 22]. Even the age of the PD patients was significantly higher than that of the controls, and the mean age difference of 2 years should not have had much effect on SUA or serum bilirubin levels. In addition, the PD patients had significantly higher co-morbidities (hypertension, diabetes mellitus and dyslipidemia) than the controls, but these co-morbidities per se do not affect the SUA level. Many previous reports on SUA level and PD used controls that were healthy individuals or healthy relatives of the patients, who had no neurological symptoms [8-13], which was similar to this study. However, factors of the participants’ lifestyle, particularly dietary intake and alcohol consumption, which could alter SUA levels, were not included in the analysis. Lastly, the possible association between treatment (L-dopa equivalent dose) and TB, as previously suggested, was not determined [21, 22], due to treatment for the PD patients studied not being recorded. Despite several limitations, this study had some strengths. It included only elderly PD patients and excluded those with vascular, familial and drug-induced PD, as well as PD with dementia, in order to ensure uniformed characteristics of the PD patients. Cases with a history of significantly abnormal renal and liver function were excluded prior to the study, and those with such abnormalities identified at entry to the study were excluded, in order to ensure that their condition did not affect SUA or serum bilirubin levels. Serum samples were kept at -20 °C, with all of them analyzed simultaneously. This avoided laboratory variation of each measurement. Lastly, the analysis was controlled by age and co-morbidities, which could be another strength.
Conclusions
This study found that the SUA/SCr ratio seems to be more sensitive than the SUA level as a biomarker for studying the association between SUA level and PD, even with a small number of patients. The high serum TB and IDB levels in PD patients when compared with controls, and the negative association between TB and IDB levels and PD severity, suggest the possible role of serum bilirubin in the pathogenesis of PD. However, the lack of association between SUA or SUA/SCr ratio and serum TB or IDB suggests that these two biomarkers play a different role in the etiopathogenesis of PD. The linkage between SUA/SCr ratio and TB/IDB needs to be further investigated in the future.
Acknowledgments
The authors thank Mrs. Waraporn Sukitawut and Ms. Saowanee Puntana for their secretarial assistance, and Mrs. Antika Wongthanee, a medical statistician, for her statistical assistance.
Financial Disclosure
This study was supported by the Faculty of Medicine, Chiang Mai University Research Fund (no. 051/2559).
Conflict of Interest
None to declare.
Informed Consent
All of the participants gave their written informed consent prior to entering the study.
Author Contributions
CS and WL designed the study. CS, CW and AS involved in acquisition of data. CS, ST, AS, CW and WL involved in data analysis and interpretation of the data. CS and WL wrote the first draft of the manuscript. ST, AS and CW critically revised the manuscript for important intellectual content. CS, ST, AS, CW and WL gave final approval of the version to be published. CS, ST, AS, CW and WL agreed to be accountable for all aspects of the work in ensuring that questions related to the accuracy or integrity of any part of the work are appropriately investigated and resolved.
Data Availability
Any inquiries regarding supporting data availability of this study should be directed to the corresponding author.
| References | ▴Top |
- Davie CA. A review of Parkinson's disease. Br Med Bull. 2008;86:109-127.
doi pubmed - Alonso A, Sovell KA. Gout, hyperuricemia, and Parkinson's disease: a protective effect? Curr Rheumatol Rep. 2010;12(2):149-155.
doi pubmed - Poewe W. Non-motor symptoms in Parkinson's disease. Eur J Neurol. 2008;15(Suppl 1):14-20.
doi pubmed - Savitt JM, Dawson VL, Dawson TM. Diagnosis and treatment of Parkinson disease: molecules to medicine. J Clin Invest. 2006;116(7):1744-1754.
doi pubmed - Poewe W, Seppi K, Tanner TM, Halliday GM, Brundin P, Volkmann J, et al. Parkinson disease. Nat Rev Dis Primer. 2017;3:1-21.
doi pubmed - Becker BF, Reinholz N, Leipert B, Raschke P, Permanetter B, Gerlach E. Role of uric acid as an endogenous radical scavenger and antioxidant. Chest. 1991;100(3 Suppl):176S-181S.
doi pubmed - Stocker R, Yamamoto Y, McDonagh AF, Glazer AN, Ames BN. Bilirubin is an antioxidant of possible physiological importance. Science. 1987;235(4792):1043-1046.
doi pubmed - Andreadou E, Nikolaou C, Gournaras F, Rentzos M, Boufidou F, Tsoutsou A, Zournas C, et al. Serum uric acid levels in patients with Parkinson's disease: their relationship to treatment and disease duration. Clin Neurol Neurosurg. 2009;111(9):724-728.
doi pubmed - Annanmaki T, Muuronen A, Murros K. Low plasma uric acid level in Parkinson's disease. Mov Disord. 2007;22(8):1133-1137.
doi pubmed - Sun CC, Luo FF, Wei L, Lei M, Li GF, Liu ZL, Le WD, et al. Association of serum uric acid levels with the progression of Parkinson's disease in Chinese patients. Chin Med J (Engl). 2012;125(4):583-587.
- Sakuta H, Suzuki K, Miyamoto T, Miyamoto M, Numao A, Fujita H, Watanabe Y, et al. Serum uric acid levels in Parkinson's disease and related disorders. Brain Behav. 2017;7(1):e00598.
doi pubmed - Jesus S, Perez I, Caceres-Redondo MT, Carrillo F, Carballo M, Gomez-Garre P, Mir P. Low serum uric acid concentration in Parkinson's disease in southern Spain. Eur J Neurol. 2013;20(1):208-210.
doi pubmed - Gonzalez-Aramburu I, Sanchez-Juan P, Jesus S, Gorostidi A, Fernandez-Juan E, Carrillo F, Sierra M, et al. Genetic variability related to serum uric acid concentration and risk of Parkinson's disease. Mov Disord. 2013;28(12):1737-1740.
doi pubmed - Wen M, Zhou B, Chen YH, Ma ZL, Gou Y, Zhang CL, Yu WF, et al. Serum uric acid levels in patients with Parkinson's disease: A meta-analysis. PLoS One. 2017;12(3):e0173731.
doi pubmed - Qin XL, Zhang QS, Sun L, Hao MW, Hu ZT. Lower serum bilirubin and uric acid concentrations in patients with Parkinson's Disease in China. Cell Biochem Biophys. 2015;72(1):49-56.
doi pubmed - Davis JW, Grandinetti A, Waslien CI, Ross GW, White LR, Morens DM. Observations on serum uric acid levels and the risk of idiopathic Parkinson's disease. Am J Epidemiol. 1996;144(5):480-484.
doi pubmed - Gao X, O'Reilly EJ, Schwarzschild MA, Ascherio A. Prospective study of plasma urate and risk of Parkinson disease in men and women. Neurology. 2016;86(6):520-526.
doi pubmed - Ascherio A, LeWitt PA, Xu K, Eberly S, Watts A, Matson WR, Marras C, et al. Urate as a predictor of the rate of clinical decline in Parkinson disease. Arch Neurol. 2009;66(12):1460-1468.
doi pubmed - Church WH, Ward VL. Uric acid is reduced in the substantia nigra in Parkinson's disease: effect on dopamine oxidation. Brain Res Bull. 1994;33(4):419-425.
doi - McFarland NR, Burdett T, Desjardins CA, Frosch MP, Schwarzschild MA. Postmortem brain levels of urate and precursors in Parkinson's disease and related disorders. Neurodegener Dis. 2013;12(4):189-198.
doi pubmed - Scigliano G, Girotti F, Soliveri P, Musicco M, Radice D, Caraceni T. Increased plasma bilirubin in Parkinson patients on L-dopa: evidence against the free radical hypothesis? Ital J Neurol Sci. 1997;18(2):69-72.
doi pubmed - Moccia M, Picillo M, Erro R, Longo K, Amboni M, Santangelo G, Palladino R, et al. Increased bilirubin levels in de novo Parkinson's disease. Eur J Neurol. 2015;22(6):954-959.
doi pubmed - Macias-Garcia D, Mendez-Del Barrio C, Jesus S, Labrador MA, Adarmes-Gomez A, Vargas-Gonzalez L, Carrillo F, et al. Increased bilirubin levels in Parkinson's disease. Parkinsonism Relat Disord. 2019;63:213-216.
doi pubmed - Feig DI. Uric acid: a novel mediator and marker of risk in chronic kidney disease? Curr Opin Nephrol Hypertens. 2009;18(6):526-530.
doi pubmed - Ikeda K, Nakamura Y, Kiyozuka T, Aoyagi J, Hirayama T, Nagata R, Ito H, et al. Serological profiles of urate, paraoxonase-1, ferritin and lipid in Parkinson's disease: changes linked to disease progression. Neurodegener Dis. 2011;8(4):252-258.
doi pubmed - Zhong LL, Song YQ, Tian XY, Cao H, Ju KJ. Level of uric acid and uric acid/creatinine ratios in correlation with stage of Parkinson disease. Medicine (Baltimore). 2018;97(26):e10967.
doi pubmed - Lolekha P, Wongwan P, Kulkantrakorn K. Association between serum uric acid and motor subtypes of Parkinson's disease. J Clin Neurosci. 2015;22(8):1264-1267.
doi pubmed - Gelb DJ, Oliver E, Gilman S. Diagnostic criteria for Parkinson disease. Arch Neurol. 1999;56(1):33-39.
doi pubmed - Hoehn MM, Yahr MD. Parkinsonism: onset, progression and mortality. Neurology. 1967;17(5):427-442.
doi pubmed - Goetz CG, Poewe W, Rascol O, Sampaio C, Stebbins GT, Counsell C, Giladi N, et al. Movement Disorder Society Task Force report on the Hoehn and Yahr staging scale: status and recommendations. Mov Disord. 2004;19(9):1020-1028.
doi pubmed - Goetz CG, Tilley BC, Shaftman SR, Stebbins GT, Fahn S, Martinez-Martin P, Poewe W, et al. Movement Disorder Society-sponsored revision of the Unified Parkinson's Disease Rating Scale (MDS-UPDRS): scale presentation and clinimetric testing results. Mov Disord. 2008;23(15):2129-2170.
doi pubmed - Stebbins GT, Goetz CG, Burn DJ, Jankovic J, Khoo TK, Tilley BC. How to identify tremor dominant and postural instability/gait difficulty groups with the movement disorder society unified Parkinson's disease rating scale: comparison with the unified Parkinson's disease rating scale. Mov Disord. 2013;28(5):668-670.
doi pubmed - Cockcroft DW, Gault MH. Prediction of creatinine clearance from serum creatinine. Nephron. 1976;16(1):31-41.
doi pubmed - Kidney Disease: Improving Global Outcomes (KDIGO) Acute Kidney Injury Work Group. KDIGO clinical practice guideline for acute kidney injury. Kidney inter. 2012;2(suppl):1-138.
- Kia DA, Noyce AJ, White J, Speed D, Nicolas A, collaborators I, Burgess S, et al. Mendelian randomization study shows no causal relationship between circulating urate levels and Parkinson's disease. Ann Neurol. 2018;84(2):191-199.
doi pubmed - Kobylecki CJ, Nordestgaard BG, Afzal S. Plasma urate and risk of Parkinson's disease: A mendelian randomization study. Ann Neurol. 2018;84(2):178-190.
doi pubmed - Yamamoto N, Izumi Y, Matsuo T, Wakita S, Kume T, Takada-Takatori Y, Sawada H, et al. Elevation of heme oxygenase-1 by proteasome inhibition affords dopaminergic neuroprotection. J Neurosci Res. 2010;88(9):1934-1942.
doi pubmed - McCarty MF. Serum bilirubin may serve as a marker for increased heme oxygenase activity and inducibility in tissues—a rationale for the versatile health protection associated with elevated plasma bilirubin. Med Hypotheses. 2013;81(4):607-610.
doi pubmed
This article is distributed under the terms of the Creative Commons Attribution Non-Commercial 4.0 International License, which permits unrestricted non-commercial use, distribution, and reproduction in any medium, provided the original work is properly cited.
Journal of Clinical Medicine Research is published by Elmer Press Inc.