Journal of Clinical Medicine Research, ISSN 1918-3003 print, 1918-3011 online, Open Access
Article copyright, the authors; Journal compilation copyright, J Clin Med Res and Elmer Press Inc
Journal website http://www.jocmr.org

Original Article

Volume 12, Number 3, March 2020, pages 172-179


Serum Uric Acid, Serum Uric Acid to Serum Creatinine Ratio and Serum Bilirubin in Patients With Parkinson’s Disease: A Case-Control Study

Figure

Figure 1.
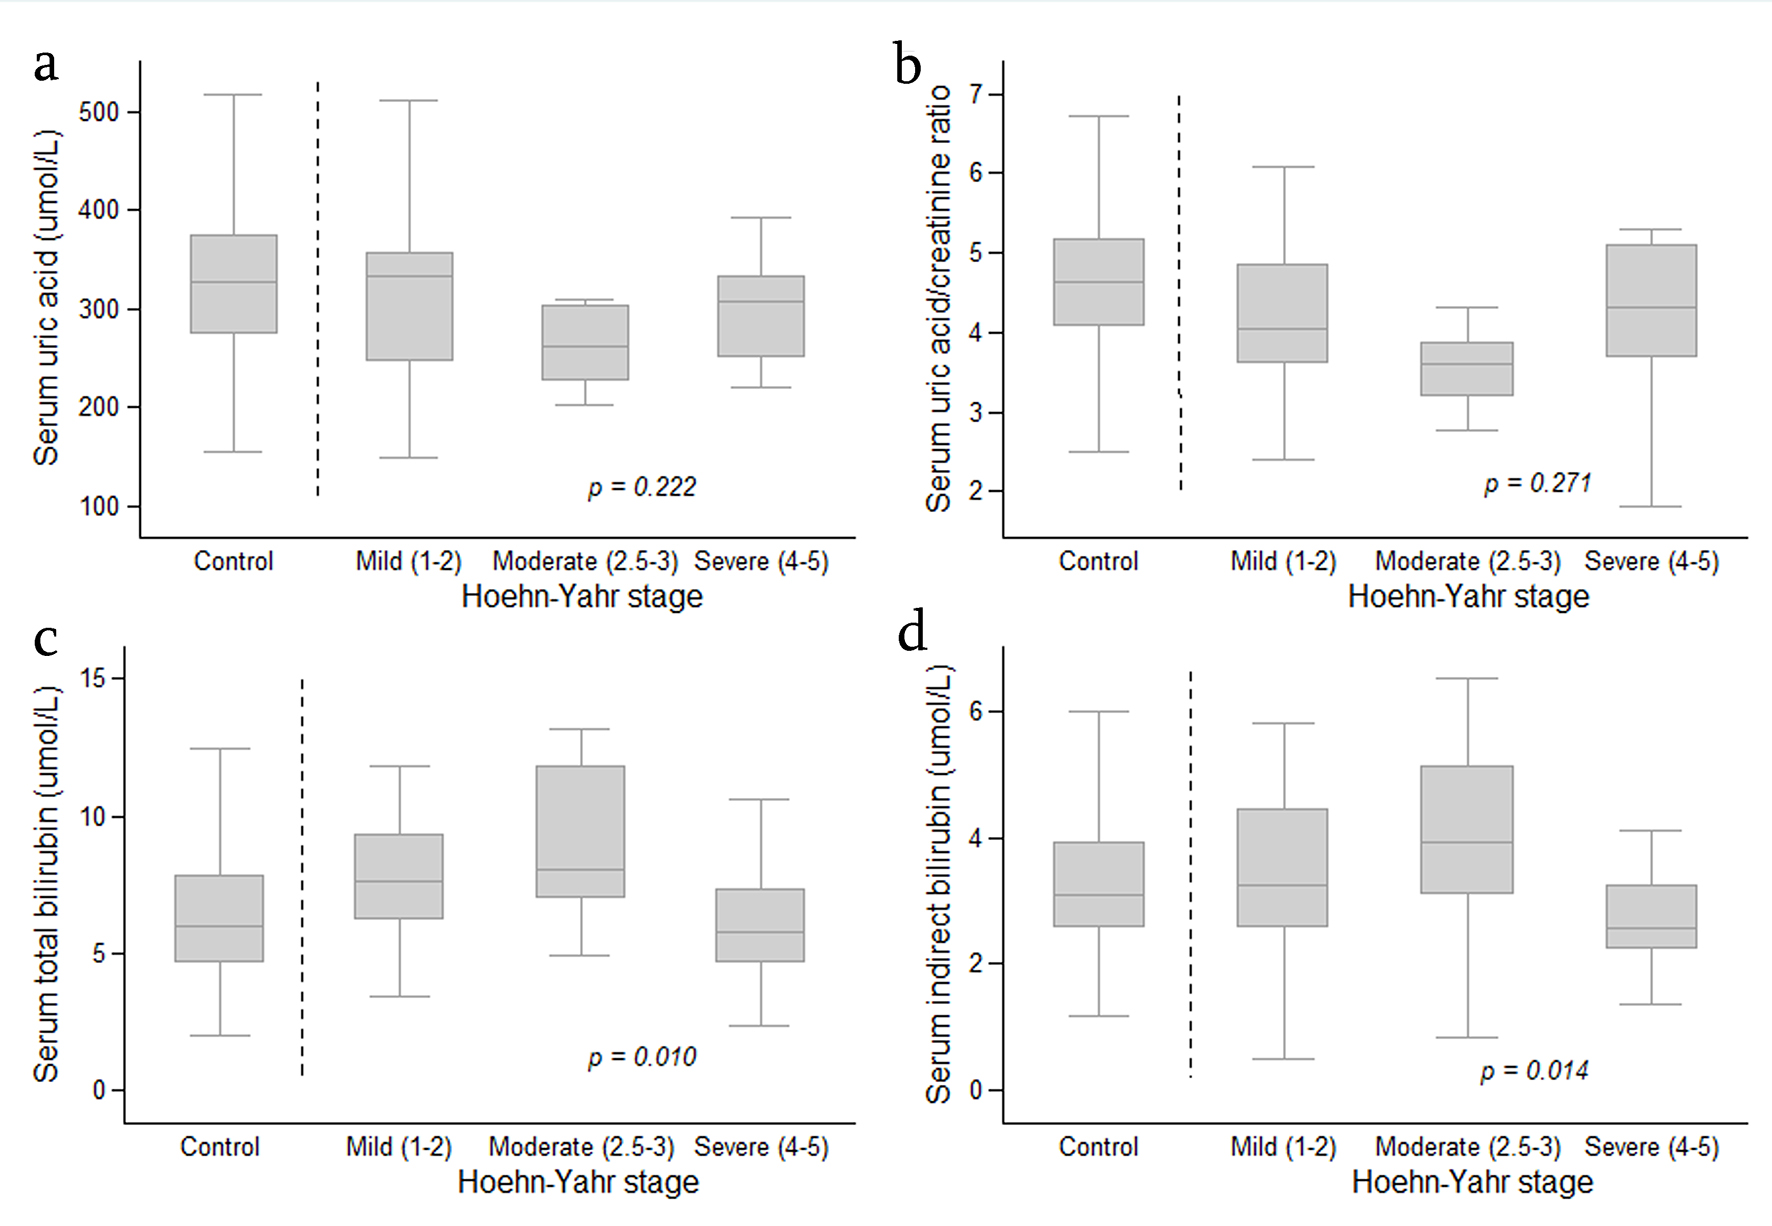
Figure 1. Boxplot graph showing distribution of serum uric acid level (a), serum uric acid/creatinine ratio (b), serum total bilirubin (c) and serum indirect bilirubin (d) in the controls and in patients with Parkinson’s disease (according to Hoehn-Yahr stage). The analysis was performed by Fisher’s least significant difference (LSD) test and was controlled by age and co-morbidities. Data are expressed as median, 25-75 percentile and minimum-maximum.

Tables

Table 1. Demographic and Laboratory Findings Among Parkinson’s Disease Patients and Controls
 
Parkinson’s disease (N = 61)Controls (N = 135)P value
Data are expressed as mean ± SD unless indicated otherwise. BMI: body mass index; CAD: coronary artery disease; H&Y: Hoehn-Yahr; UPDRS: unified Parkinson’s disease rating scale; SUA: serum uric acid; SCr: serum creatinine; SUA/SCr: serum uric acid/serum creatinine; AST: aspartate aminotransferase; ALT: alanine aminotransferase.
Sex, male, n (%)34 (55.73)68 (50.37)0.486
Age, years68.90 ± 6.9566.78 ± 6.510.040
Co-morbidities
  Hypertension, n (%)25 (40.98)2 (1.48)< 0.001
  Diabetes, n (%)4 (6.56)00.009
  CAD, n (%)3 (4.92)1 (0.74)0.090
  Dyslipidemia, n (%)14 (22.95)2 (1.48)< 0.001
BMI (kg/m2)21.52 ± 3.9421.06 ± 3.220.388
Disease duration (years)5.62 ± 4.19--
H&Y stage, n (%)--
  H&Y I13 (21.31)
  H&Y II23 (37.70)
  H&Y III11 (18.03)
  H&Y IV11 (18.03)
  H&Y V3 (4.92)
UPDRS score
  All72.82 ± 47.312.04 ± 2.57< 0.001
  Non-motor (part I + II)27.85 ± 19.361.35 ± 2.11< 0.001
  Motor (part III)39.52 ± 26.680.69 ± 1.10< 0.001
  Motor (part IV)5.44 ± 6.580 ± 0< 0.001
Hemoglobin, g/L124.23 ± 11.74123.74 ± 15.010.806
SCr, µmol/L74.63 ± 17.7371.72 ± 13.760.257
SUA, µmol/L304.22 ± 82.55324.28 ± 77.660.102
SUA/SCr ratio4.12 ± 0.904.59 ± 1.040.003
Albumin, g/L41.75 ± 3.1645.20 ± 32.580.076
AST, IU/L25.13 ± 15.4623.36 ± 7.700.853
ALT, IU/L16.80 ± 15.6218.00 ± 11.520.039
Total bilirubin, µmol/L7.92 ± 3.676.59 ± 2.780.003
Direct bilirubin, µmol/L3.39 ± 1.453.33 ± 1.160.592
Indirect bilirubin, µmol/L4.52 ± 2.483.26 ± 1.82< 0.001


Table 2. Serum Uric Acid Level, Serum Uric Acid/Creatinine Ratio and Serum Bilirubin Levels According to Clinical Characteristics of Parkinson’s Disease
 
Total cases (N)SUA (µmol/L)SUA/SCr ratioTotal bilirubin (µmol/L)Indirect bilirubin (µmol/L)
Data are presented as mean ± SD and geometric mean (95% CI). The analysis was controlled by age and co-morbidities. PD: Parkinson’s disease; H&Y: Hoehn-Yahr; PIGD: postural instability/gait difficulty; SUA: serum uric acid; SUA/SCr: serum uric acid/serum creatinine. aP = 0.009 (total bilirubin; mild vs. severe disease); bP = 0.005 (total bilirubin, moderate vs. severe disease); cP = 0.012 (indirect bilirubin, mild vs. severe disease); dP = 0.008 (indirect bilirubin, moderate vs. severe disease). a-dAnalyzed by Fisher’s least significant difference (LSD) test.
PD disease severity (based on H&Y stage)
  Mild (1 - 2)36315.74 ± 81.764.20 ± 0.887.65 (6.71 - 8.72)a4.28 (3.68 - 4.97)c
  Moderate (2.5 - 3)11269.82 ± 65.063.71 ± 0.808.72 (6.89 - 11.04)b4.93 (3.79 - 6.42)d
  Severe (4 - 5)14301.65 ± 93.944.24 ± 0.995.56 (4.46 - 6.94)2.96 (2.20 - 4.00)
  P value0.2220.2710.0100.014
PD disease duration (years)
  < 2 years9321.85 ± 56.544.10 ± 0.457.70 (6.04 - 9.80)4.08 (2.89 - 5.77)
  ≥ 2 years52301.17 ± 86.324.12 ± 0.967.21 (6.41 - 8.11)4.03 (3.51 - 4.62)
  P value0.5560.9360.6690.906
Motor symptom subtypes
  PIGD44297.94 ± 89.273.99 ± 0.897.09 (6.33 - 7.93)3.94 (3.44 - 4.50)
  Tremor10321.19 ± 46.334.55 ± 0.828.96 (6.28 - 12.77)4.81 (3.09 - 7.50)
  P value0.3430.0790.0820.235


Table 3. Comparison of Serum Total Bilirubin and Indirect Bilirubin Among PD Patients According to PD Disease Severity and Controls
 
Total casesTotal bilirubin (µmol/L)P valueIndirect bilirubin (µmol/L)P value
Data are expressed as geometric mean (95% CI). All comparison were compared with control. The analysis was controlled by age and co-morbidities.
Control1356.07 (5.67 - 6.51)2.78 (2.50 - 3.09)
PD disease severity (based on H&Y stage)
  Mild (1 - 2)367.65 (6.71 - 8.72)0.0254.28 (3.68 - 4.97)0.001
  Moderate (2.5 - 3)118.72 (6.89 - 11.04)0.0184.93 (3.79 - 6.42)0.004
  Severe (4 - 5)145.56 (4.46 - 6.94)0.3282.96 (2.20 - 4.00)0.717


Table 4. Correlation Between Serum Uric Acid, Serum Uric Acid/Serum Creatinine Ratio and Serum Total Bilirubin, Indirect Bilirubin
 
Parkinson’s disease (n = 61)Controls (n = 135)Parkinson’s disease, r (P value) for SUAControls, r (P value) for SUAParkinson’s disease, r (P value) for SUA/SCr ratioControls, r (P value) for SUA/SCr ratio
Data are expressed as mean ± SD. SUA: serum uric acid; SUA/SCr: serum uric acid/serum creatinine.
Total bilirubin, µmol/L7.92 ± 3.676.59 ± 2.780.112 (0.391)0.118 (0.171)0.164 (0.208)0.025 (0.773)
Indirect bilirubin, µmol/L4.52 ± 2.483.26 ± 1.820.096 (0.460)0.125 (0.149)0.204 (0.114)0.060 (0.493)
SUA, µmol/L304.22 ± 82.55324.28 ± 77.66
SUA/SCr ratio4.12 ± 0.904.59 ± 1.04