

| Journal of Clinical Medicine Research, ISSN 1918-3003 print, 1918-3011 online, Open Access |
| Article copyright, the authors; Journal compilation copyright, J Clin Med Res and Elmer Press Inc |
| Journal website https://www.jocmr.org |
Original Article
Volume 14, Number 6, June 2022, pages 229-236

Relationships Between Arterial Pressure-Volume Index and Cardiovascular Disease Biomarkers in Patients With Hypertension
Takashi Hitsumoto
Hitsumoto Medical Clinic, Shimonoseki City, Yamaguchi 750-0025, Japan
Manuscript submitted April 30, 2022, accepted June 17, 2022, published online June 27, 2022
Short title: API and Biomarkers in Hypertensive Patients
doi: https://doi.org/10.14740/jocmr4732
| Abstract | ▴Top |
Background: The arterial pressure-volume index (API), which is obtained by conventional blood pressure measurement, is a new marker for arterial stiffness. The aim of this study was to clarify the relationships between the API and various clinical parameters, including cardiovascular disease (CVD) biomarkers, in patients with hypertension for the prevention of CVD.
Methods: This cross-sectional study enrolled 288 patients with hypertension receiving pharmacological treatment, without a history of CVD (males/females: 115/173; age: 63 ± 11 years (mean ± standard deviation)). The API was automatically calculated using a commercial device.
Results: The API was significantly correlated with important CVD biomarkers, such as the concentration of urinary albumin (r = 0.42, P < 0.001), high-sensitivity troponin T (r = 0.39, P < 0.001), and skin autofluorescence (marker of advanced glycation end products in tissues) (r = 0.41, P < 0.001). Multiple regression analyses demonstrated that when the API was used as a subordinate factor, these biomarkers were independent variables. According to the receiver operating characteristic curve analysis, an API of > 26 is the optimal cut-off point for determining albuminuria as ≥ 30 mg/g Cr, high high-sensitivity cardiac troponin T concentration as ≥ 0.014 ng/mL, or high skin autofluorescence as ≥ 3.0 arbitrary unit (area under the curve = 0.703, 0.702, and 0.704; and P < 0.001, respectively).
Conclusion: This investigation demonstrates that API had an independent relationship with relevant CVD biomarkers, such as urinary albumin, high-sensitivity troponin T, and skin autofluorescence. Additionally, the outcomes of receiver operating characteristic curve analysis are presented as values that an API > 26 defines for these biomarkers linked with the formation of CVD.
Keywords: Arterial stiffness; Arterial pressure-volume index; Hypertension; Biomarker; Urinary albumin; High-sensitivity cardiac troponin T; Skin autofluorescence
| Introduction | ▴Top |
Reduction of blood pressure is an important therapeutic strategy for preventing cardiovascular disease (CVD) events in patients with hypertension [1, 2]. However, patients with CVD events exist despite receiving anti-hypertensive pharmacological treatment. Therefore, we should also consider other factors that may affect the levels of blood pressure during the treatment of hypertension for the prevention of CVD. In fact, several biomarkers detected in blood or urine samples have been investigated and used to prevent CVD events in patients with hypertension [3-5]. Furthermore, researchers have reported that skin autofluorescence (AF), indicating the presence of advanced glycation end products (AGEs) in vivo, is a considerable risk factor for CVD in patients with hypertension [6-8]. Arterial stiffness is involved in the pathogenesis of CVD. Several physiological markers of arterial stiffness (e.g., stiffness β, pulse wave velocity, and cardio-ankle vascular index) have been used in clinical settings. A number of clinical reports have shown the usefulness of these physiological markers as risk factors of CVD in patients with hypertension [9-11]. Recently, researchers also investigated a method for calculating the arterial pressure-volume index (API), which indicates arterial stiffness, using oscillometric blood pressure measurements [12]. The API can be easily and immediately obtained by conventional blood pressure measurement in the sitting position. Several studies demonstrated the importance of the API as a risk factor for CVD in the clinical setting [13-15]. Nevertheless, the usefulness of API as a risk factor for CVD in patients with hypertension is currently poorly understood. This cross-sectional investigation ascertained the link between API and various biomarkers of CVD in patients with hypertension. Additionally, using receiver operating characteristic (ROC) curve analysis, this research evaluated the cut-off values of the API for strange levels of CVD biomarkers.
| Materials and Methods | ▴Top |
Patients
Eligible patients with hypertension were enrolled in this study from September 2019 to August 2020. Patients without history of CVD (e.g., coronary artery disease, cerebrovascular disease, peripheral arterial disease, and hospitalization for heart failure) visited the Hitsumoto Medical Clinic (Yamaguchi, Japan) for the determination of clinical parameters, including the API. A total of 288 hypertensive patients were selected (age: 63 ± 11 years (mean ± standard deviation)).
Ethical considerations
This study was conducted in accordance with the tenets of the Declaration of Helsinki and the ethical standards of the responsible agency for humans. All patients provided informed consent, and the research protocol was performed by the Institutional Review Board Approval of Hitsumoto Medical Clinic (approval number: HMC-2019-7R).
API measurement
API was calculated automatically using a commercially available device (PASESA AVE-1500; Shisei Datum, Tokyo, Japan). Details of API measurements have been previously described [12]. In brief, the blood pressure measurement cuff was wrapped around the upper left arm in a sitting position, pressurized to 190 mm Hg at a rate of 10 mm Hg/s, and depressurized to 10 mm Hg at a rate of 3 mm Hg/s. The cuff pressure during pressurization and depressurization was determined using a pressure transducer. The API is the numerical coefficient of the pressure-volume curve equation obtained by calculating the numerical integration of the mean gradient. Previous studies have shown that the coefficient of variation for repeated measurements on the day of API determination (within an individual of three measurements) is 7.5% [12].
Evaluation of cardiovascular risk factors
The body mass index (body weight (kg)/height squared (m2)) was used as a marker of the degree of obesity. The diagnostic criteria for smoking, diabetes mellitus and dyslipidemia were derived from previous reports [11]. A blood sample was obtained from the peripheral vein in the morning after a 12-h fast; a urine sample was simultaneously collected. The levels of blood glucose, hemoglobin A1c, serum lipid, creatinine, high-sensitivity C-reactive protein, brain natriuretic peptide, and high-sensitivity cardiac troponin T (hs-cTnT) were measured using standard laboratory procedures. The estimated glomerular filtration rate (eGFR), a marker of kidney function, was calculated using a report of a Japanese committee [16]. The levels of brain natriuretic peptide and hs-cTnT were evaluated using commercially available kits (SHIONOSPOT Reader; Shionogi & Co., Osaka, Japan and Roche Diagnostics, Switzerland, respectively) [17]. The levels of urine albumin were evaluated with a commercially available kit (Siemens/Bayer DCA 2000+ Analyzer; Siemens Healthineers, Tokyo, Japan). Skin AF was automatically measured using a commercially available device (AGE Reader™; DiagnOptics, Groningen, Netherlands) [18, 19]. The measurement method was identical to that reported in previous studies. The levels of skin AF were expressed using arbitrary units. A previous study indicated that the level of pentosidine, a major AGE component obtained by skin biopsy, is significantly correlated with skin AF [20]. As an assessment of oral medications, calcium channel blocker (CCB), the renin-angiotensin system (RAS) inhibitor, β-blocker, diuretics, and statins were examined.
Statistical analysis
The StatView J5.0 (HULINKS, Tokyo, Japan) and MedCalc for Windows (version 14.8.1; MedCalc Software, Ostend, Belgium) software were used for statistical analysis. Continuous variables were expressed using the mean and standard deviation. Pearson’s or Spearman’s rank correlation analysis was used to estimate the correlation coefficient. One-way analysis of variance was utilized to compare the three groups, while post-hoc testing was conducted using Fisher’s protected least significant differences. Multiple regression analysis was used for multivariate analysis. The Youden’s index derived from the ROC curve was calculated [21], to determine the optimal API value for predicting albuminuria, high hs-cTnT, and high skin AF. P-values < 0.05 denoted statistically significant differences.
| Results | ▴Top |
Patient characteristics
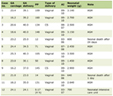
The characteristics of patients included in this study are shown in Table 1. The mean value of the API was 27 ± 5. Figure 1 illustrates the distribution of the API in this study population. The API showed a nearly normal distribution, with a mean value of 27 (range: 16 - 42).
 Click to view | Table 1. Characteristics of Patients |
 Click for large image | Figure 1. Distribution of API. The API shows a nearly normal distribution, with a mean value of 27 (range: 16 - 42). API: arterial pressure-volume index. |
Correlations between the API and biomarkers of CVD
Table 2 shows the correlations between the API and clinical parameters. The API exhibited a relatively strong positive correlation with systolic blood pressure. Regarding its relationships with biomarkers of CVD, the API was significantly positively correlated with the levels of high-sensitivity C-reactive protein, urinary albumin concentrations, brain natriuretic peptide, hs-cTnT, and skin AF. Conversely, the API was significantly negatively correlated with the eGFR.
Click to view | Table 2. Relationship Between API and Various Clinical Parameters |
Comparison of the API in patients treated with CCB and/or RAS inhibitors
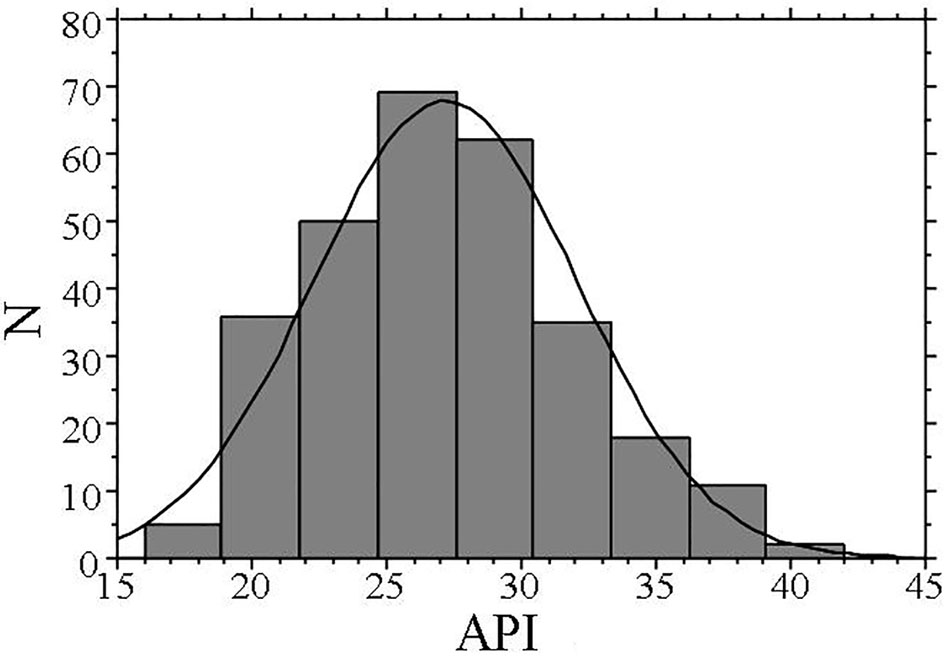
A total of 219 patients received treatment with CCB and/or RAS inhibitors, without other anti-hypertensive drugs. Figure 2 shows the comparison of the API in the three groups (CCB alone (n = 66); RAS inhibitor alone (n = 62); combination of CCB and RAS inhibitors (n = 91)). The API was similar between the CCB alone (API: 27 ± 5) and RAS inhibitor alone (API: 28 ± 5) groups. However, patients receiving treatment with a combination of CCB and RAS inhibitors (API: 25 ± 4) had a significantly lower API than those treated with CCB or RAS inhibitors alone. The levels of systolic blood pressure were significantly lower in patients treated with a combination of CCB and RAS inhibitors than in those receiving treatment with CCB alone or RAS inhibitors alone.
 Click for large image | Figure 2. Comparisons of API in patients with CCB and/or RAS inhibitor, showing the comparison of the API in the three groups (CCB alone (n = 66); RAS inhibitor alone (n = 62); combination of CCB and RAS inhibitors (n = 91)). The API was similar between the CCB alone (API: 27 ± 5) and RAS inhibitor alone (API: 28 ± 5) groups. However, patients receiving treatment with a combination of CCB and RAS inhibitors (API: 25 ± 4) had a significantly lower API than those treated with CCB or RAS inhibitors alone. The bars show standard deviation. *P = 0.003 vs. CCB. **P < 0.001 vs. RAS-i. #P = 0.047 vs. CCB, ##P = 0.009 vs. RAS-i. API: arterial pressure-volume index; CCB: calcium channel blocker; RAS-i: renin angiotensin system inhibitor; SBP: systolic blood pressure. |
Multivariate analysis
Multiple regression analysis with API as a subordinate factor was performed (Table 3). Examination of the multicollinearity of variables or a stepwise method was conducted for the selection of explanatory factors. When the API was used as a subordinate factor, systolic blood pressure, urinary albumin concentration, combination of CCB and RAS inhibitors, hs-cTnT, and skin AF were identified as independent variables.
Click to view | Table 3. Multiple Regression Analysis |
ROC curve analysis
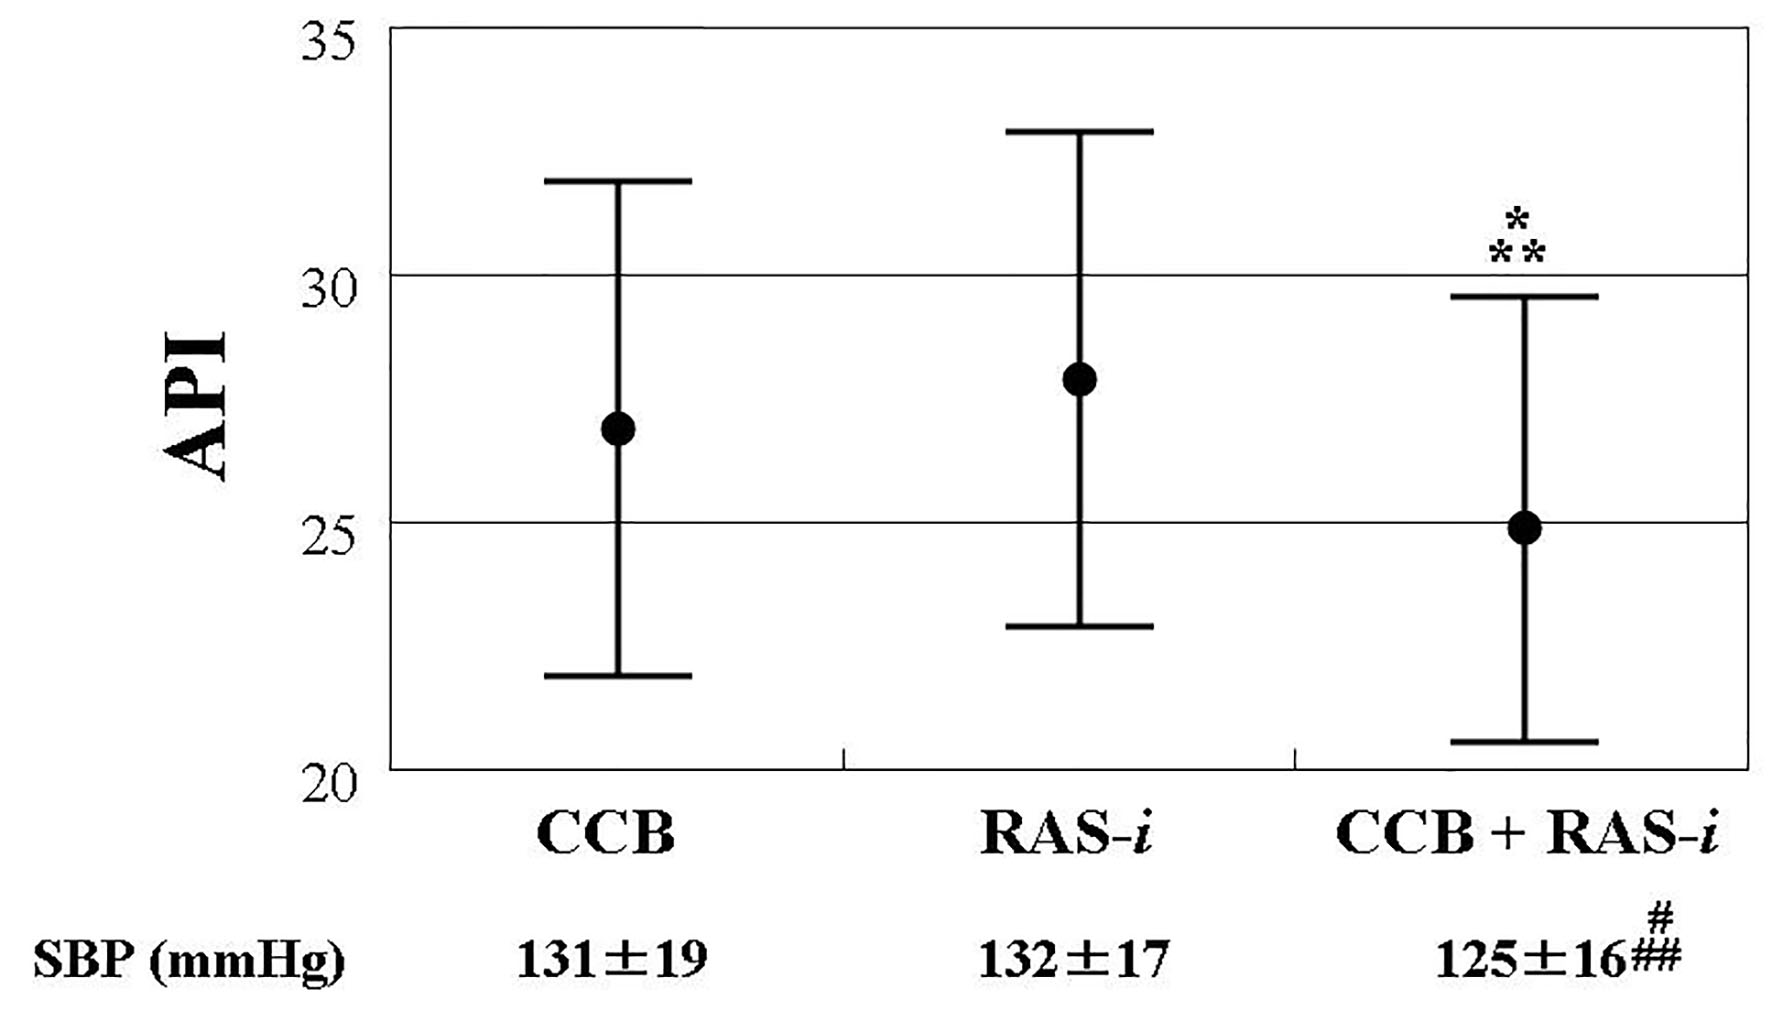
A ROC curve was generated to detect albuminuria (≥ 30 mg/g Cr), high hs-cTnT concentration (≥ 0.014 ng/mL), or high skin AF (≥ 3.0 arbitrary unit) (Fig. 3) as previously described for CVD events [22-24]. The maximum Youden’s index revealed that an API > 26 was the optimal cut-off point for determining albuminuria, high hs-cTnT concentration, or high skin AF (area under the curve = 0.703, 0.702, and 0.704; and P < 0.001, respectively).
 Click for large image | Figure 3. Receiver-operating characteristic curve analysis. The detection of albuminuria (≥ 30 mg/g Cr) (a), high hs-cTnT concentration (≥ 0.014 ng/mL) (b), or high skin AF (≥ 3.0 arbitrary unit) (c) were determined by previous reports. The maximum Youden’s index indicated that an API of >26 was the optimal cut-off point for the determination of albuminuria (AUC = 0.703, P < 0.001), high hs-cTnT concentration (AUC = 0.702, P < 0.001), or high skin AF (AUC = 0.704, P < 0.001). API: arterial pressure-volume index; hs-cTnT: high-sensitivity cardiac troponin T; AF: autofluorescence; AUC area under the curve. |
| Discussion | ▴Top |
This study demonstrated that API had a high link with systolic blood pressure, and an independent association was observed between the two markers. In current publications, API has a substantial association with systolic blood pressure, similar to this research’s results [15]. Nevertheless, API was found to be substantially linked with critical CVD biomarkers, such as urinary albumin concentration, hs-cTnT, and skin AF. Additionally, in multivariate analysis, these biomarkers were chosen as independent drivers of the dependent API, even when corrected for systolic blood pressure. ROC curve analysis indicated that an API > 26 is the ideal cut-off point for estimating albuminuria, high hs-cTnT concentration, or high skin AF, which is often linked with CVD cases. However, this investigation implies that a combination of CCB and RAS inhibitors may effectively reduce API levels.
The API exhibited a significant correlation with biomarkers of kidney function, such as the eGFR and urinary albumin concentrations. Thus, these results indicated that the API was related to kidney function in hypertensive patients. In addition, the levels of urinary albumin were selected as an independent variable for the API. Researchers reported that these levels are a marker of systemic vascular endothelial function [25]. Therefore, based on these findings, the API may be a physiological marker reflecting vascular endothelial function. However, flow-mediated vasodilation in the brachial artery is also commonly used for assessing vascular endothelial function [26, 27]. Nevertheless, this approach requires certain technical expertise. Therefore, although the API is explored as a parameter of arterial stiffness, it provides the possibility to simply evaluate vascular endothelial function through conventional blood pressure measurement in the sitting position.
Blood troponin levels reflect the degree of myocardial injury. However, several researchers have shown that arterial wall stiffness is significantly associated with biomarkers of myocardial damage [28-30]. A number of investigations have revealed a significant association between left ventricular dysfunction and myocardial injury [31, 32]. In addition, researchers emphasized the increase of aortic artery wall stiffness in the progression of left ventricular dysfunction [33, 34]. Hence, the independent association between hs-cTnT and the API observed in this analysis can be partly attributed to the myocardial damage via left ventricular dysfunction, as a consequence of the worsened artery wall stiffness. Nonetheless, several studies reported a significant association between myocardial injury and coronary atherosclerosis [35, 36]. Ueda et al reported that the API was a significant independent variable linked to the presence of significant coronary stenosis [13]. Of note, patients with a history of coronary artery disease were not included and the coronary artery was not evaluated in this study. Nevertheless, the independent association between hs-cTnT and the API detected in the present investigation may be partly attributed to myocardial injury, which is caused by potential coronary atherosclerosis.
According to numerous studies, AGEs or their receptors are closely linked to the progression of atherosclerosis [37-39]. Moreover, the independent association between skin AF and the API implies that AGEs play an important role in the arterial function of hypertensive patients. However, basic research has shown that anti-hypertensive drugs, such as RAS inhibitors and CCB, decreased the levels of AGEs or their receptors in arterial tissues [40, 41]. Therefore, it is possible that aggressive treatment of patients with hypertension and high skin AF levels with these medications decreased the incidence of CVD events by reducing the levels of AGEs in arterial wall tissues. However, Isami et al showed that individual lifestyle habits (e.g., sleep, smoking, and dietary content) were independently linked to skin AF levels [42]. Thus, the continuation of appropriate lifestyle habits is also important for maintaining a lower API in hypertensive patients.
Using ROC curve analysis, this investigation established the optimum values of the API to evaluate albuminuria, high hs-cTnT concentration, or high skin AF, which is connected with CVD events. The data indicated that an API > 26 is the optimal cut-off value for determining high levels of these CVD biomarkers. Thus, maintaining an API ≤ 26 in daily clinical practice might decrease the incidence of CVD events in patients with hypertension. In this study, systolic blood pressure levels and combination of RAS inhibitors and CCB were independently associated with the API. CCB or RAS inhibitors are often used in the clinical setting owing to their effectiveness in reducing blood pressure [43]. Furthermore, several studies have shown the benefits of the combination of CCB and RAS inhibitors for the prevention of CVD events in hypertensive patients [44, 45]. Although this was a cross-sectional study, the results emphasize the need to actively attempt to lower the levels of systolic blood pressure using a combination of CCB and RAS inhibitors in hypertensive patients with a high API. This approach may consequently prevent the occurrence of CVD events in the future.
Limitations
The drawbacks of this research are outlined below. First, the independent relationship between the API and systolic blood pressure was discovered. Considering that API is hinged on systolic blood pressure at the estimation time increased API than proper stiffness might be derived in hypertensive patients. Further investigations are required to better understand the characteristics of API as a biomarker of arterial stiffness. Second, based on the findings of ROC curve analysis, an API > 26 was calculated as an estimated value for the risk of experiencing CVD. However, this investigation is cross-sectional, and it is essential to assess the reliability of API > 26 through further investigation in the future.
Conclusions
This study demonstrates that API had an independent relationship with crucial CVD indicators, such as urinary albumin, high-sensitivity troponin T, and skin AF. Additionally, the ROC curve analysis results are displayed as values with API > 26 defined for these indicators linked with the formation of CVD. Future investigations concentrating on API in hypertensive patients must validate these findings.
Acknowledgments
The author would like to thank the patients who participated in this study.
Financial Disclosure
None to declare.
Conflict of Interest
None to declare.
Informed Consent
Informed consent was obtained from all patients who participated in this study.
Author Contributions
TH contributed to the research planning, data acquisition and analysis, and manuscript writing and editing.
Data Availability
The author declares that data supporting the findings of this study are available within the article.
| References | ▴Top |
- Viera AJ. Screening for hypertension and lowering blood pressure for prevention of cardiovascular disease events. Med Clin North Am. 2017;101(4):701-712.
doi pubmed - Kirk JK, Allsbrook J, Hansell M, Mann EM. A systematic review of hypertension outcomes and treatment strategies in older adults. Arch Gerontol Geriatr. 2017;73:160-168.
doi pubmed - Everett BM, Zeller T, Glynn RJ, Ridker PM, Blankenberg S. High-sensitivity cardiac troponin I and B-type natriuretic Peptide as predictors of vascular events in primary prevention: impact of statin therapy. Circulation. 2015;131(21):1851-1860.
doi pubmed - Pontremoli R, Leoncini G, Viazzi F, Ratto E, Vaccaro V, Falqui V, Parodi A, et al. Evaluation of subclinical organ damage for risk assessment and treatment in the hypertensive patient: role of microalbuminuria. J Am Soc Nephrol. 2006;17(4 Suppl 2):S112-114.
doi pubmed - Cortez AF, Muxfeldt ES, Cardoso CR, Salles GF. Prognostic value of C-reactive protein in resistant hypertension. Am J Hypertens. 2016;29(8):992-1000.
doi pubmed - Hartog JW, van de Wal RM, Schalkwijk CG, Miyata T, Jaarsma W, Plokker HW, van Wijk LM, et al. Advanced glycation end-products, anti-hypertensive treatment and diastolic function in patients with hypertension and diastolic dysfunction. Eur J Heart Fail. 2010;12(4):397-403.
doi pubmed - Hitsumoto T. Relationship between hemorheology assessed using microchannel array flow analyzer and kidney function in hypertensive patients. Cardiol Res. 2017;8(4):147-153.
doi pubmed - Hitsumoto T. Clinical impact of skin autofluorescence on high-sensitivity troponin T in hypertensive patients. Clin Hypertens. 2017;23:19.
doi pubmed - Jaroch J, Loboz-Grudzien K, Magda S, Florescu M, Bociaga Z, Ciobanu AO, Kruszynska E, et al. The relationship of carotid arterial stiffness and left ventricular concentric hypertrophy in hypertension. Adv Clin Exp Med. 2016;25(2):263-272.
doi pubmed - Safar ME. Arterial stiffness as a risk factor for clinical hypertension. Nat Rev Cardiol. 2018;15(2):97-105.
doi pubmed - Hitsumoto T. Correlation between the cardio-ankle vascular index and renal resistive index in patients with essential hypertension. Cardiol Res. 2020;11(2):106-112.
doi pubmed - Komine H, Asai Y, Yokoi T, Yoshizawa M. Non-invasive assessment of arterial stiffness using oscillometric blood pressure measurement. Biomed Eng Online. 2012;11:6.
doi pubmed - Ueda T, Miura S, Suematsu Y, Shiga Y, Kuwano T, Sugihara M, Ike A, et al. Association of arterial pressure volume index with the presence of significantly stenosed coronary vessels. J Clin Med Res. 2016;8(8):598-604.
doi pubmed - Komatsu S, Tomiyama H, Kimura K, Matsumoto C, Shiina K, Yamashina A. Comparison of the clinical significance of single cuff-based arterial stiffness parameters with that of the commonly used parameters. J Cardiol. 2017;69(4):678-683.
doi pubmed - Yamanashi H, Koyamatsu J, Nagayoshi M, Shimizu Y, Kawashiri SY, Kondo H, Fukui S, et al. Screening validity of arterial pressure-volume index and arterial velocity-pulse index for preclinical atherosclerosis in Japanese community-dwelling adults: the Nagasaki islands study. J Atheroscler Thromb. 2018;25(9):792-798.
doi pubmed - Imai E, Horio M, Nitta K, Yamagata K, Iseki K, Hara S, Ura N, et al. Estimation of glomerular filtration rate by the MDRD study equation modified for Japanese patients with chronic kidney disease. Clin Exp Nephrol. 2007;11(1):41-50.
doi pubmed - Mingels A, Jacobs L, Michielsen E, Swaanenburg J, Wodzig W, van Dieijen-Visser M. Reference population and marathon runner sera assessed by highly sensitive cardiac troponin T and commercial cardiac troponin T and I assays. Clin Chem. 2009;55(1):101-108.
doi pubmed - Meerwaldt R, Links TP, Graaff R, Hoogenberg K, Lefrandt JD, Baynes JW, Gans RO, et al. Increased accumulation of skin advanced glycation end-products precedes and correlates with clinical manifestation of diabetic neuropathy. Diabetologia. 2005;48(8):1637-1644.
doi pubmed - Nomoto K, Yagi M, Arita S, Hamada U, Yonei Y. A survey of fluorescence derived from advanced glycation end products in the skin of Japanese: differences with age and measurement location. Anti Aging Med. 2012;9(5):119-124.
- Meerwaldt R, Graaff R, Oomen PHN, Links TP, Jager JJ, Alderson NL, Thorpe SR, et al. Simple non-invasive assessment of advanced glycation endproduct accumulation. Diabetologia. 2004;47(7):1324-1330.
doi pubmed - Schisterman EF, Perkins NJ, Liu A, Bondell H. Optimal cut-point and its corresponding Youden Index to discriminate individuals using pooled blood samples. Epidemiology. 2005;16(1):73-81.
doi pubmed - Pontremoli R, Leoncini G, Ravera M, Viazzi F, Vettoretti S, Ratto E, Parodi D, et al. Microalbuminuria, cardiovascular, and renal risk in primary hypertension. J Am Soc Nephrol. 2002;13(Suppl 3):S169-172.
doi pubmed - Saunders JT, Nambi V, de Lemos JA, Chambless LE, Virani SS, Boerwinkle E, Hoogeveen RC, et al. Cardiac troponin T measured by a highly sensitive assay predicts coronary heart disease, heart failure, and mortality in the atherosclerosis risk in communities study. Circulation. 2011;123(13):1367-1376.
doi pubmed - Hitsumoto T. Clinical significance of skin autofluorescence in patients with type 2 diabetes mellitus with chronic heart failure. Cardiol Res. 2018;9(2):83-89.
doi pubmed - Pedrinelli R, Giampietro O, Carmassi F, Melillo E, Dell'Omo G, Catapano G, Matteucci E, et al. Microalbuminuria and endothelial dysfunction in essential hypertension. Lancet. 1994;344(8914):14-18.
doi - Donald AE, Halcox JP, Charakida M, Storry C, Wallace SM, Cole TJ, Friberg P, et al. Methodological approaches to optimize reproducibility and power in clinical studies of flow-mediated dilation. J Am Coll Cardiol. 2008;51(20):1959-1964.
doi pubmed - Thijssen DH, Black MA, Pyke KE, Padilla J, Atkinson G, Harris RA, Parker B, et al. Assessment of flow-mediated dilation in humans: a methodological and physiological guideline. Am J Physiol Heart Circ Physiol. 2011;300(1):H2-12.
doi pubmed - Hitsumoto T. Clinical significance of cardio-ankle vascular index as a cardiovascular risk factor in elderly patients with type 2 diabetes mellitus. J Clin Med Res. 2018;10(4):330-336.
doi pubmed - Bai Y, Ye P, Luo L, Xiao W, Xu R, Wu H, Bai J. Arterial stiffness is associated with minimally elevated high-sensitivity cardiac, troponin T levels in a community-dwelling population. Atherosclerosis. 2011;218(2):493-498.
doi pubmed - Gedikli O, Ozturk S, Yilmaz H, Baykan M, Kiris A, Durmus I, Baltaci D, et al. Relationship between arterial stiffness and myocardial damage in patients with newly diagnosed essential hypertension. Am J Hypertens. 2008;21(9):989-993.
doi pubmed - Jungbauer CG, Riedlinger J, Buchner S, Birner C, Resch M, Lubnow M, Debl K, et al. High-sensitive troponin T in chronic heart failure correlates with severity of symptoms, left ventricular dysfunction and prognosis independently from N-terminal pro-b-type natriuretic peptide. Clin Chem Lab Med. 2011;49(11):1899-1906.
doi pubmed - Buiten MS, de Bie MK, Rotmans JI, Dekker FW, van Buren M, Rabelink TJ, Cobbaert CM, et al. Serum cardiac troponin-I is superior to troponin-T as a marker for left ventricular dysfunction in clinically stable patients with end-stage renal disease. PLoS One. 2015;10(8):e0134245.
doi pubmed - Jaroch J, Loboz Grudzien K, Bociaga Z, Kowalska A, Kruszynska E, Wilczynska M, Dudek K. The relationship of carotid arterial stiffness to left ventricular diastolic dysfunction in untreated hypertension. Kardiol Pol. 2012;70(3):223-231.
- Kim H, Kim HS, Yoon HJ, Park HS, Cho YK, Nam CW, Hur SH, et al. Association of cardio-ankle vascular index with diastolic heart function in hypertensive patients. Clin Exp Hypertens. 2014;36(4):200-205.
doi pubmed - Januzzi JL, Jr., Suchindran S, Coles A, Ferencik M, Patel MR, Hoffmann U, Ginsburg GS, et al. High-sensitivity troponin I and coronary computed tomography in symptomatic outpatients with suspected CAD: insights from the PROMISE trial. JACC Cardiovasc Imaging. 2019;12(6):1047-1055.
doi pubmed - Ndrepepa G, Braun S, Schulz S, Mehilli J, Schomig A, Kastrati A. High-sensitivity troponin T level and angiographic severity of coronary artery disease. Am J Cardiol. 2011;108(5):639-643.
doi pubmed - Yan SF, Ramasamy R, Schmidt AM. The RAGE axis: a fundamental mechanism signaling danger to the vulnerable vasculature. Circ Res. 2010;106(5):842-853.
doi pubmed - Suga T, Iso T, Shimizu T, Tanaka T, Yamagishi S, Takeuchi M, Imaizumi T, et al. Activation of receptor for advanced glycation end products induces osteogenic differentiation of vascular smooth muscle cells. J Atheroscler Thromb. 2011;18(8):670-683.
doi pubmed - Prevost G, Bulckaen H, Gaxatte C, Boulanger E, Beraud G, Creusy C, Puisieux F, et al. Structural modifications in the arterial wall during physiological aging and as a result of diabetes mellitus in a mouse model: are the changes comparable? Diabetes Metab. 2011;37(2):106-111.
doi pubmed - Akira K, Amano M, Okajima F, Hashimoto T, Oikawa S. Inhibitory effects of amlodipine and fluvastatin on the deposition of advanced glycation end products in aortic wall of cholesterol and fructose-fed rabbits. Biol Pharm Bull. 2006;29(1):75-81.
doi pubmed - Bro S. Cardiovascular effects of uremia in apolipoprotein E-deficient mice. Dan Med Bull. 2009;56(4):177-192.
- Isami F, West BJ, Nakajima S, Yamagishi SI. Association of advanced glycation end products, evaluated by skin autofluorescence, with lifestyle habits in a general Japanese population. J Int Med Res. 2018;46(3):1043-1051.
doi pubmed - Ishida T, Oh A, Hiroi S, Shimasaki Y, Nishigaki N, Tsuchihashi T. Treatment patterns and adherence to antihypertensive combination therapies in Japan using a claims database. Hypertens Res. 2019;42(2):249-256.
doi pubmed - Sawada T, Yamada H, Shiraishi J, Kimura S, Matsubara H. Combination effect of calcium channel blocker and valsartan on cardiovascular event prevention in patients with high-risk hypertension: ancillary results of the KYOTO HEART Study. Clin Exp Hypertens. 2012;34(2):153-159.
doi pubmed - Koyanagi R, Hagiwara N, Yamaguchi J, Kawada-Watanabe E, Haruta S, Takagi A, Ogawa H, et al. Efficacy of the combination of amlodipine and candesartan in hypertensive patients with coronary artery disease: a subanalysis of the HIJ-CREATE study. J Cardiol. 2013;62(4):217-223.
doi pubmed
This article is distributed under the terms of the Creative Commons Attribution Non-Commercial 4.0 International License, which permits unrestricted non-commercial use, distribution, and reproduction in any medium, provided the original work is properly cited.
Journal of Clinical Medicine Research is published by Elmer Press Inc.