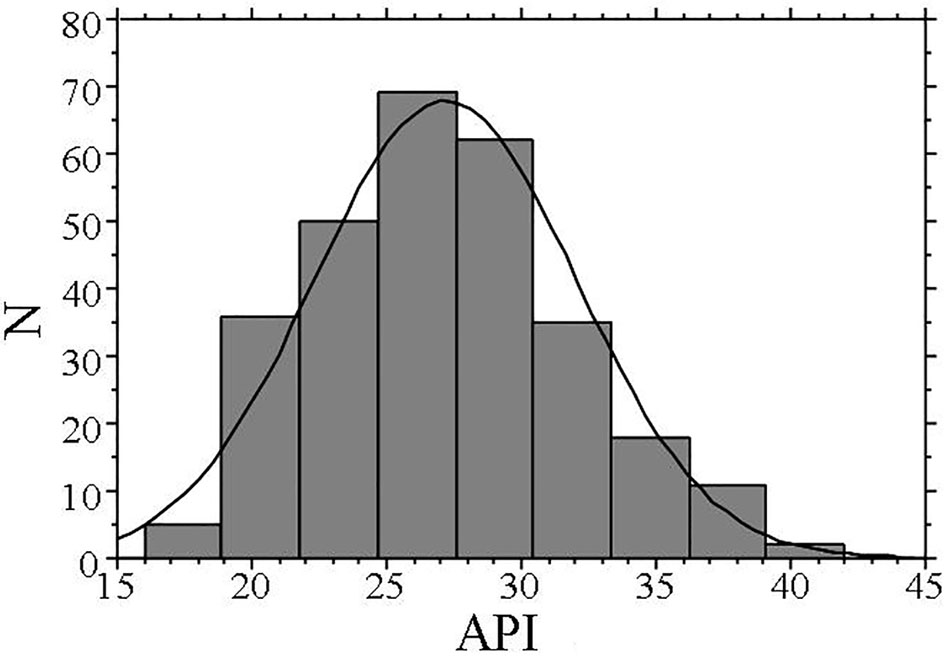
Figure 1. Distribution of API. The API shows a nearly normal distribution, with a mean value of 27 (range: 16 - 42). API: arterial pressure-volume index.
| Journal of Clinical Medicine Research, ISSN 1918-3003 print, 1918-3011 online, Open Access |
| Article copyright, the authors; Journal compilation copyright, J Clin Med Res and Elmer Press Inc |
| Journal website https://www.jocmr.org |
Original Article
Volume 14, Number 6, June 2022, pages 229-236
Relationships Between Arterial Pressure-Volume Index and Cardiovascular Disease Biomarkers in Patients With Hypertension
Figures
Tables
| Continuous values are mean ± SD or median (25-75th percentile). LDL: low-density lipoprotein; HDL: high-density lipoprotein; eGFR: estimated glomerular filtration rate; hs-CRP: high-sensitivity C-reactive protein; BNP: brain natriuretic peptide; hs-cTnT: high-sensitivity cardiac troponin T; AU: arbitrary unit; API: arterial pressure-volume index; CCB: calcium channel blocker; RAS: renin-angiotensin system. | |
| n (male/female) | 288 (115/173) |
| Age (years) | 63 ± 11 |
| Body mass index (kg/m2) | 23.0 ± 3.9 |
| Current smoker, n (%) | 59 (20) |
| Systolic blood pressure (mm Hg) | 130 ± 18 |
| Diastolic blood pressure (mm Hg) | 81 ± 12 |
| Pulse rate (/min) | 67 ± 10 |
| Diabetes mellitus, n (%) | 132 (46) |
| Fasting blood glucose (mg/dL) | 113 ± 27 |
| Hemoglobin A1c (%) | 6.4 ± 0.9 |
| Dyslipidemia, n (%) | 189 (66) |
| Total cholesterol (mg/dL) | 216 ± 42 |
| LDL-cholesterol (mg/dL) | 139 ± 40 |
| Triglyceride (mg/dL) | 146 ± 65 |
| HDL-cholesterol (mg/dL) | 49 ± 14 |
| eGFR (mL/min/1.73 m2) | 70 ± 20 |
| Urinary albumin (mg/g Cr) | 29 (15 - 51) |
| hs-CRP (mg/dL) | 0.073 (0.034 - 0.166) |
| BNP (pg/mL) | 44.6 (20.0 - 74.3) |
| hs-cTnT (ng/ml) | 0.010 (0.007 - 0.014) |
| Skin autofluorescence (AU) | 2.6 ± 0.5 |
| API | 27 ± 5 |
| Medication | |
| CCB, n (%) | 205 (71) |
| RAS inhibitor, n (%) | 157 (55) |
| β-blocker, n (%) | 58 (20) |
| Diuretics, n (%) | 45 (16) |
| Statin, n (%) | 128 (44) |
| r | P value | |
|---|---|---|
| r expressed correlation coefficient. API: arterial pressure-volume index; LDL: low-density lipoprotein; HDL: high-density lipoprotein; eGFR: estimated glomerular filtration rate; hs-CRP: high-sensitivity C-reactive protein; BNP: brain natriuretic peptide; hs-cTnT: high-sensitivity cardiac troponin T; CCB: calcium channel blocker; RAS: renin-angiotensin system. | ||
| Sex (female = 0, male = 1) | -0.26 | < 0.001 |
| Age | 0.21 | < 0.001 |
| Body mass index | 0.10 | 0.09 |
| Current smoker (no = 0, yes = 1) | 0.06 | 0.28 |
| Systolic blood pressure | 0.60 | < 0.001 |
| Diastolic blood pressure | 0.05 | 0.45 |
| Pulse rate | -0.10 | 0.09 |
| Diabetes mellitus (no = 0, yes = 1) | 0.11 | 0.08 |
| Fasting blood glucose | 0.03 | 0.56 |
| Hemoglobin A1c | 0.06 | 0.36 |
| Dyslipidemia (no = 0, yes = 1) | 0.05 | 0.43 |
| Total cholesterol | 0.02 | 0.73 |
| LDL-cholesterol | 0.02 | 0.71 |
| Triglyceride | -0.05 | 0.43 |
| HDL-cholesterol | -0.07 | 0.22 |
| eGFR | -0.13 | 0.03 |
| Log-urinary albumin | 0.42 | < 0.001 |
| Log-hs-CRP | 0.15 | 0.01 |
| Log-BNP | 0.23 | < 0.001 |
| Log-hs-cTnT | 0.39 | < 0.001 |
| Skin autofluorescence | 0.41 | < 0.001 |
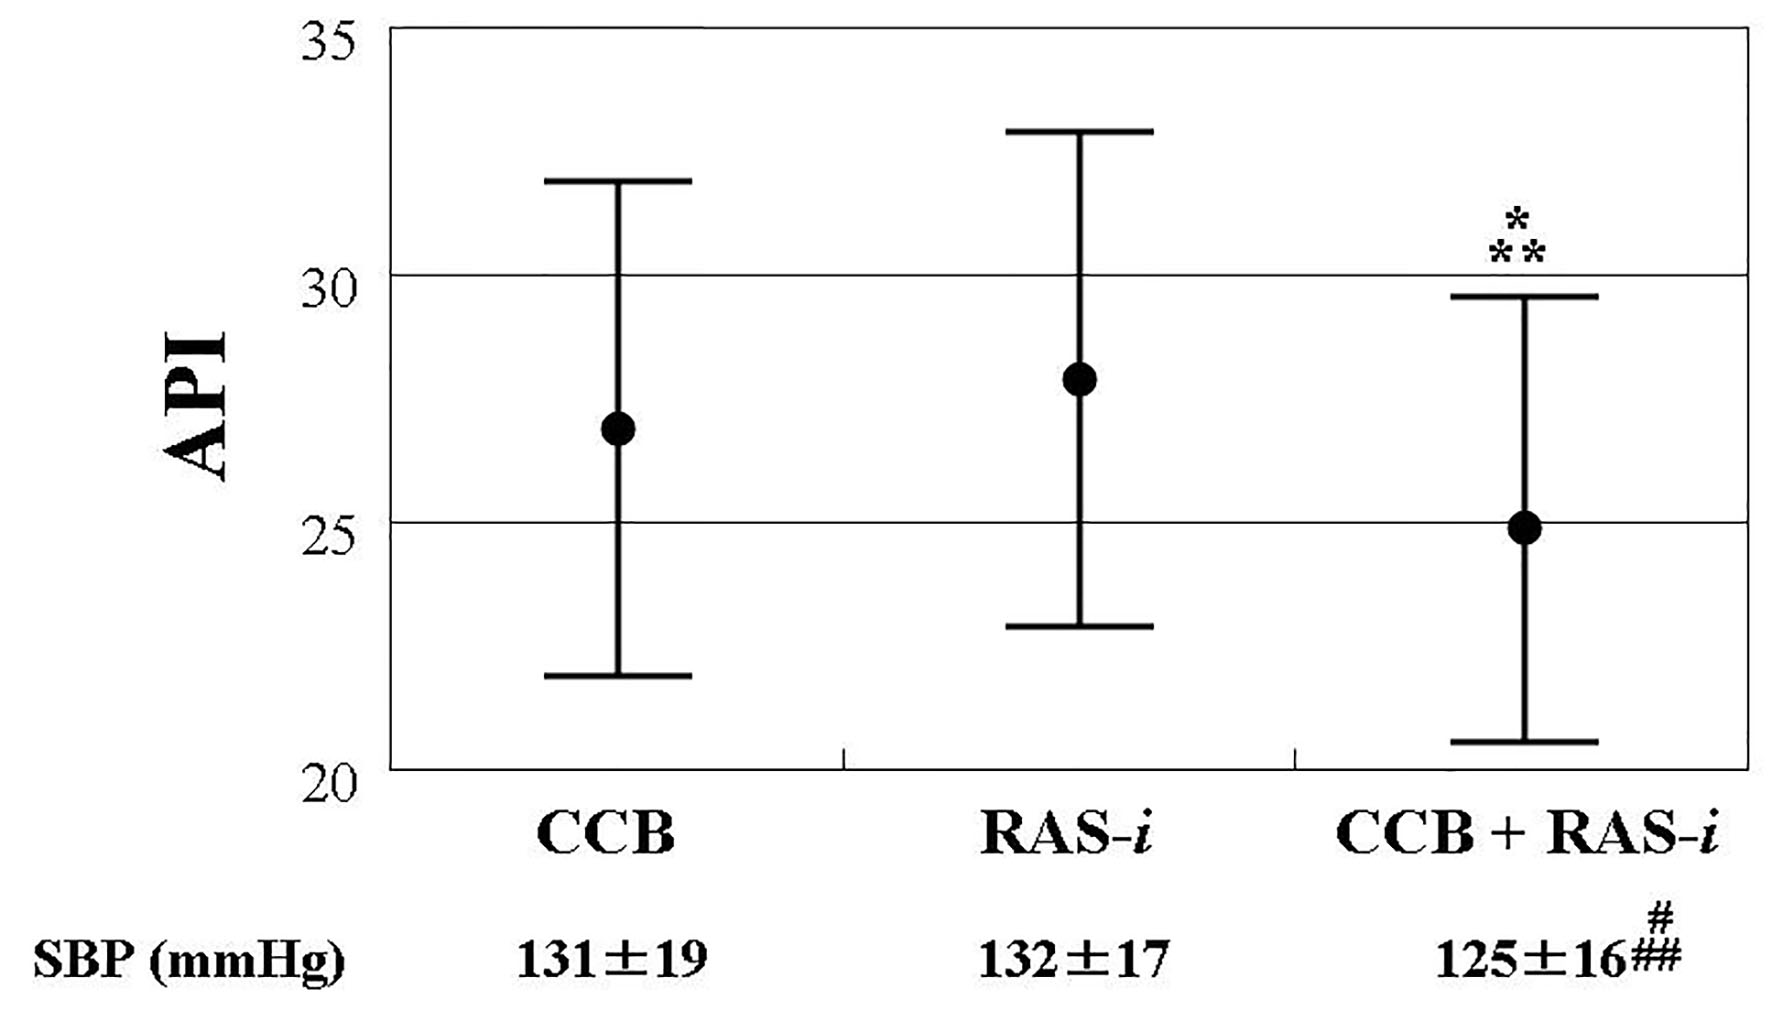
| CCB (no = 0, yes = 1) | -0.16 | 0.01 |
| RAS inhibitor (no = 0, yes = 1) | -0.15 | 0.01 |
| β-blocker (no = 0, yes = 1) | 0.11 | 0.08 |
| Diuretics (no = 0, yes = 1) | 0.09 | 0.12 |
| Statin (no = 0, yes = 1) | -0.04 | 0.47 |
| Explanatory factor | β | P value |
|---|---|---|
| Subordinate factor is API. R2 = 0.52, P < 0.001. Explanatory factors were selected by examining the multicollinearity among the variables or by conducting a stepwise method. CCB: calcium channel blocker; RAS: renin-angiotensin system; hs-cTnT: high-sensitivity cardiac troponin T; β: standardized regression coefficient; API: arterial pressure-volume index; R2: coefficient of determination. | ||
| Systolic blood pressure | 0.28 | < 0.001 |
| Log-urinary albumin | 0.15 | < 0.001 |
| CCB + RAS inhibitor | -0.14 | < 0.001 |
| Log-hs-cTnT | 0.13 | 0.001 |
| Skin autofluorescence | 0.11 | 0.01 |
| Sex (male) | -0.09 | 0.06 |
| Age | 0.07 | 0.08 |