

| Journal of Clinical Medicine Research, ISSN 1918-3003 print, 1918-3011 online, Open Access |
| Article copyright, the authors; Journal compilation copyright, J Clin Med Res and Elmer Press Inc |
| Journal website https://www.jocmr.org |
Original Article
Volume 14, Number 2, February 2022, pages 95-105

Shear Wave Elastography in the Evaluation of Renal Parenchymal Stiffness in Patients With Chronic Kidney Disease: A Meta-Analysis
Xian Ling Moa, c, d, Hui Yan Mengb, c, d, Yan Yan Wua, Xue Yan Weia, Zong Ke Lia, Su Qin Yanga
aDepartment of Ultrasound, Laibin People’s Hospital, Laibin, Guangxi, China
bDepartment of Ultrasound, Ruikang Hospital Affiliated to Guangxi University of Traditional Chinese Medicine, Nanning, Guangxi, China
cThese authors contributed equally to this work.
dCorresponding Author: Xian Ling Mo, Department of Ultrasound, Laibin People’s Hospital, Laibin, Guangxi, China; Hui Yan Meng, Department of Ultrasound, Ruikang Hospital Affiliated to Guangxi University of Traditional Chinese Medicine, Nanning, Guangxi, China
Manuscript submitted December 2, 2021, accepted January 11, 2022, published online February 24, 2022
Short title: SWE Evaluating Renal Fibrosis in CKD Patients
doi: https://doi.org/10.14740/jocmr4621
| Abstract | ▴Top |
Background: Chronic kidney disease (CKD) is a progressive loss of renal function, mainly due to hypertension, diabetes, and primary kidney disease. The histopathological findings are that of glomerulosclerosis, tubulointerstitial fibrosis and loss of renal parenchyma characterized. Therefrom, CKD can lead to higher morbidity and mortality. Patients with CKD have multiple risk factors, and the prevention work is complicated and arduous. Therefore, it is important to quantify the severity of CKD. The aim of this study is to investigate the value of shear wave elastography (SWE) in the evaluating renal parenchymal stiffness in patients with CKD.
Methods: We carried out the systematic search of databases for publications in PubMed, Embase and Cochrane Library on SWE evaluating renal fibrosis in patients with CKD. The Endnote X9, STATA 16, Review Manager 5.3 and other software were used to sort out documents, extract, integrate and analyze data.
Results: The outcomes were utilized to appraise the diagnostic accuracy of SWE and diagnose the CKD with renal fibrosis. A total of 405 patients were enrolled and their data analysis results were as follows: summary of sensitivity (S-SEN) 84% (95% confidence interval (CI): 80-87%); specificity (S-SPE) 80% (95% CI: 76-84%); summary of DLR (digital light radiography) positive (DLR-P) 4.29 (95% CI: 3.43 - 5.37); and DLR negative (DLR-N) 0.20 (95% CI: 0.16 - 0.25). The corresponding areas under the curves of diagnostic odds ratio (DOR) and summary receiver operating characteristic curve (SROC) were 21.50 (95% CI: 14.69 - 31.46) and 89% (95% CI: 86-92%), respectively.
Conclusions: SWE is highly accurate and has clinical significance for evaluating renal fibrosis, especially when the shear modulus value is used as the threshold.
Keywords: Shear wave elastography; Chronic kidney disease; Meta-analysis
| Introduction | ▴Top |
Chronic kidney disease (CKD) is an important cause of an increasing epidemiologic burden and a major health burden all over the world [1]. More than 500 million of 6.4 billion people have different types and different stages of kidney diseases in the whole world. It is predicted that by 2030, the number of patients requiring dialysis or transplantation due to renal failure will exceed 2 million [2, 3]. CKD caused 1.2 million deaths worldwide in 2017. More than 1 million CKD patients die of cardiovascular diseases every year in China, accounting for the first cause of death [4-7]. During the course of the disease, the mechanisms contributing to CKD consist of the rarefaction, destruction, necrosis of the capillary network, chronic hypoxia and inflammation [8], resulting in CKD progression with parenchymal fibrosis, tubulointerstitial atrophy and sclerosis of the glomerular compartment (Fig. 1).
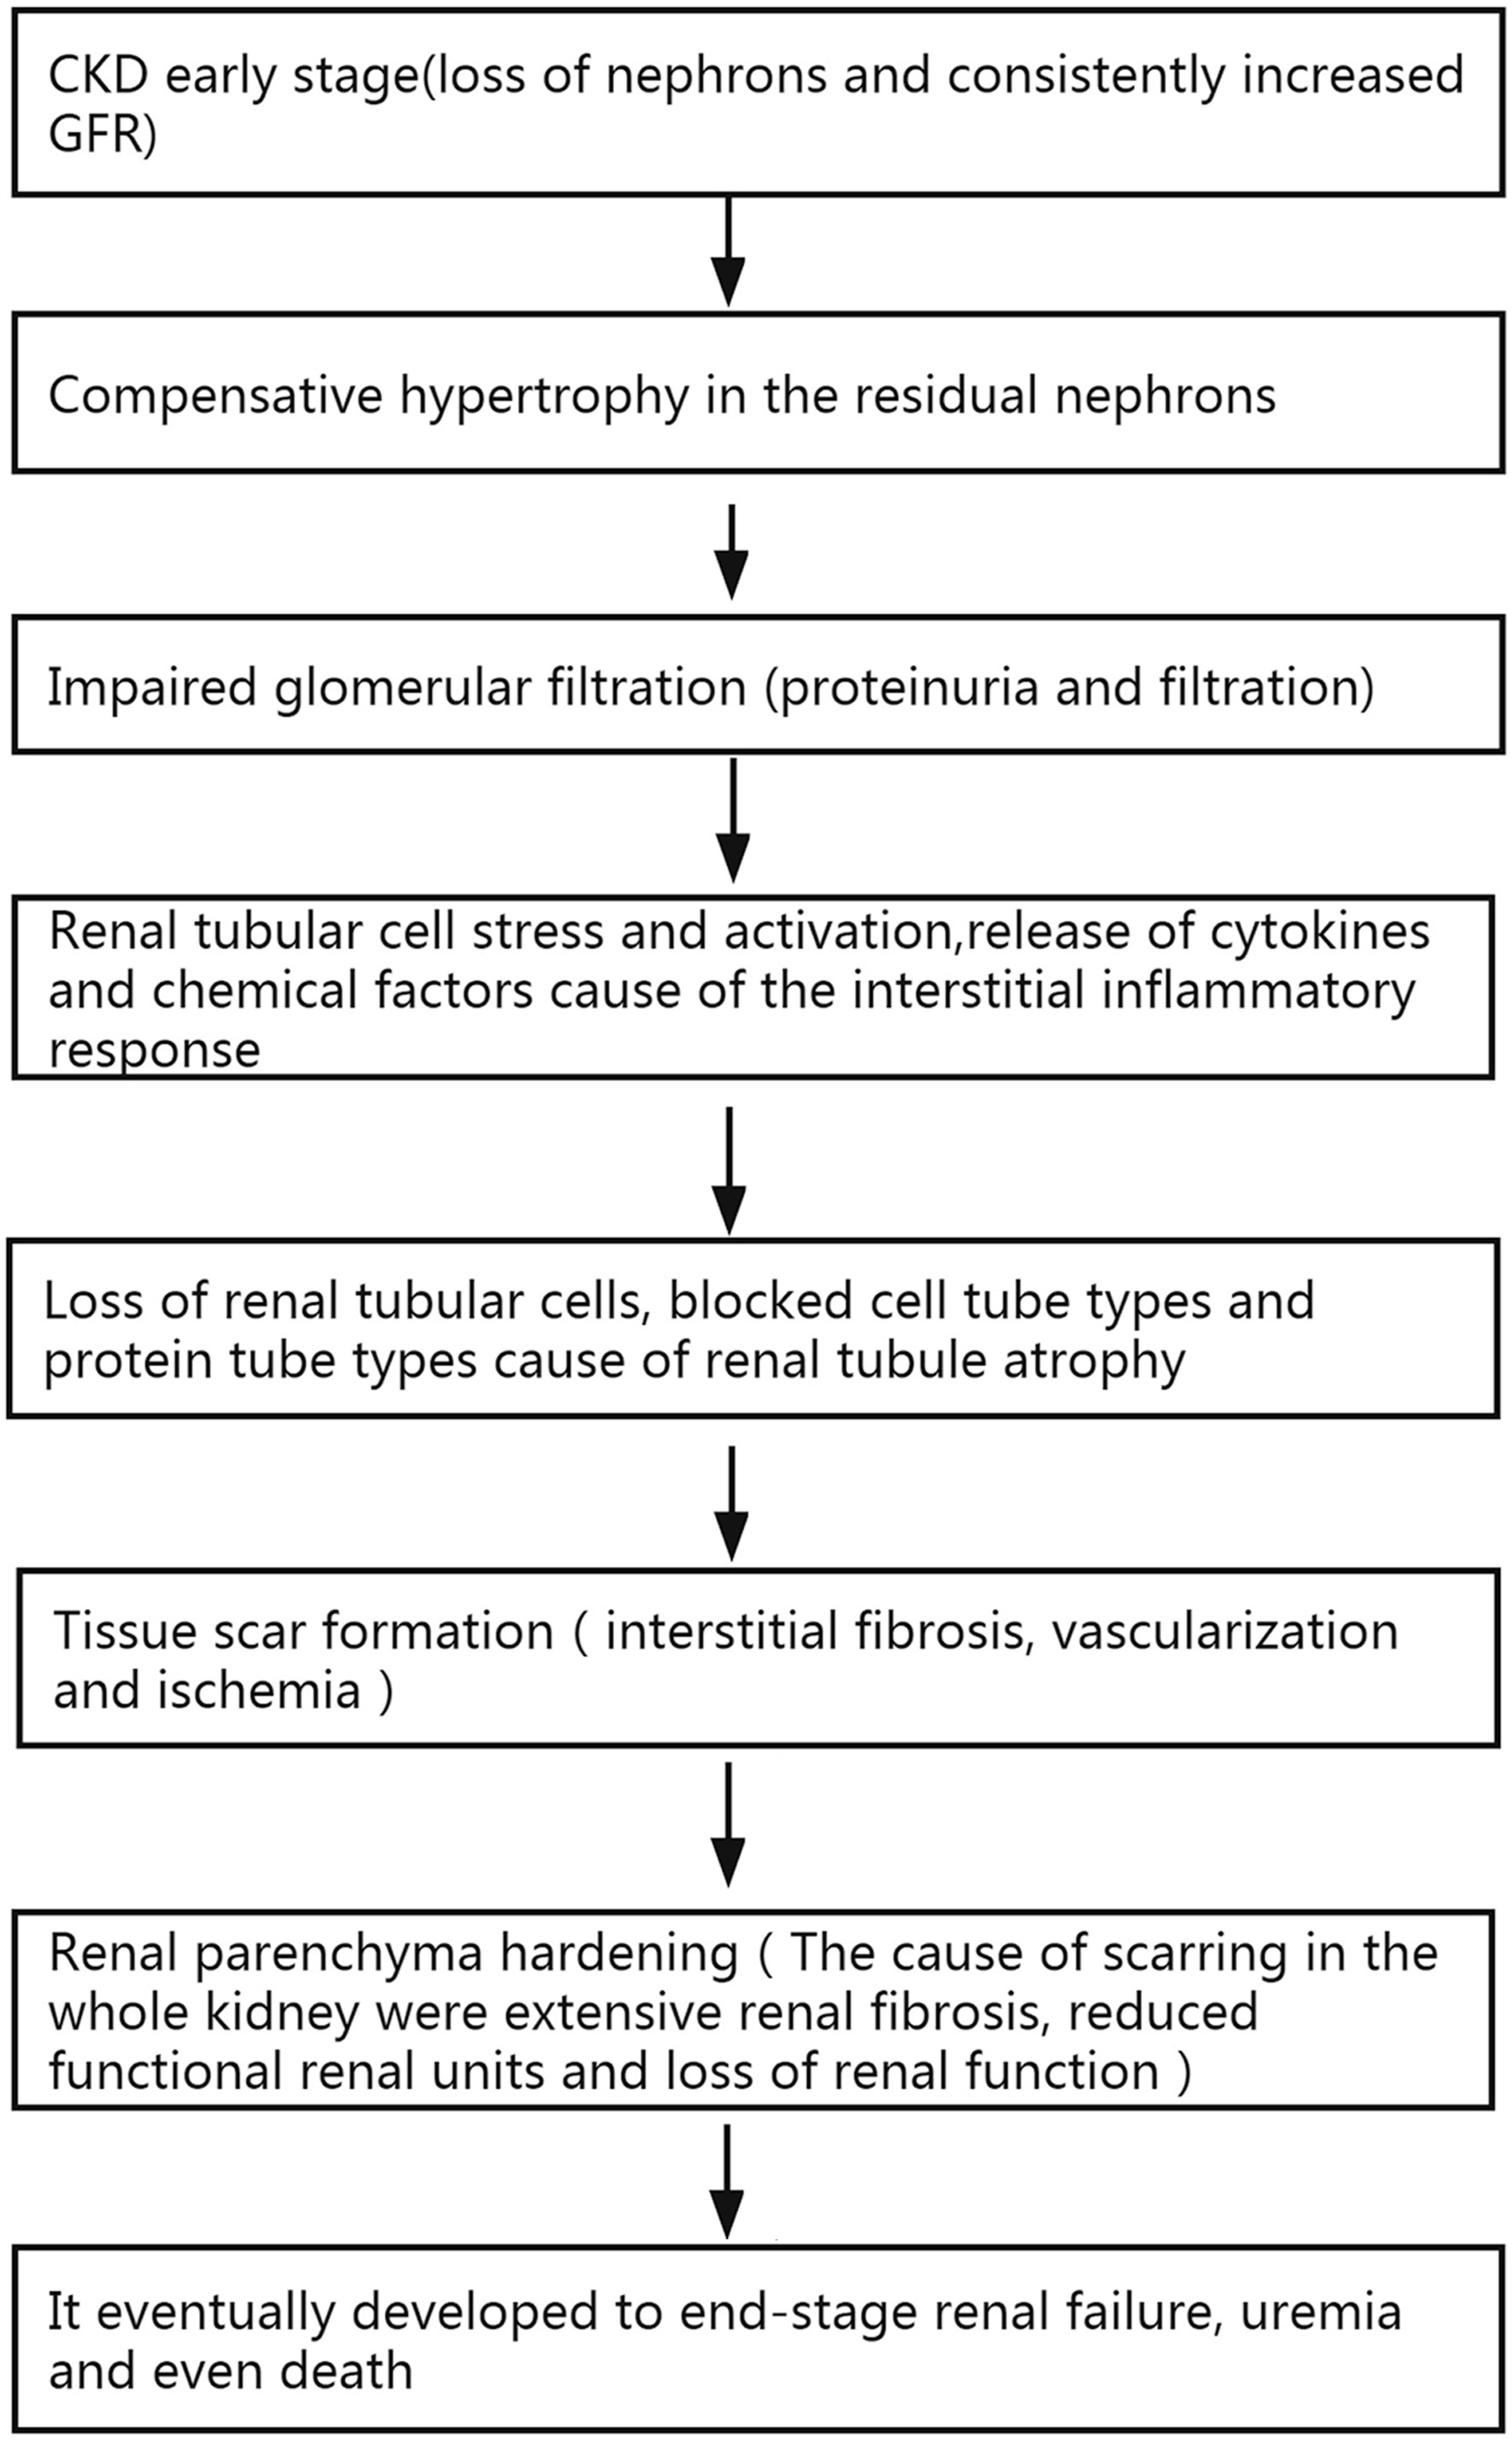 Click for large image | Figure 1. Relationship or mechanisms between renal parenchyma stiffness, fibrosis, impaired renal function, and mortality. CKD: chronic kidney disease; GFR: glomerular filtration rate. |
These structural abnormalities detected by traditional gray-scale ultrasound imaging cannot be objectively quantified [9]. Although the accuracy of percutaneous renal biopsy is rather high, the puncture and invasive diagnosis may easily lead to complications [10]. Therefore, a reliable noninvasive technique is needed to detect the renal fibrosis in patients with CKD, as well as evaluate treatment response [11]. Shear wave elastography (SWE) is a noninvasive, low-cost, fast, quantitative and real-time short-time ultrasound technique for assessing renal stiffness. SWE is a focused acoustic energy pulse used to generate microstructure displacement and shear waves that propagate perpendicularly to the main ultrasonic beam. The ultrasonic scanner is able to monitor the tissue displacement as the shear waves move through the tissue and measure the time to peak displacement and recovery time. Quantification of rigid (Young’s modulus (YM)) propagation velocity within tissues is measured at local tissues with meters per second (m/s) to kilopascals (kPa). The shear wave velocity of pathological tissue increases, and the hardness of pathological tissue may be significantly higher than that of normal tissue. It is a potential tool to reduce the need for kidney biopsies. Many studies [12-14] have confirmed that the SWE technology has highly application value in evaluating tissue fibrosis and many applications in the evaluation of liver fibrosis, breast mass hardness, and thyroid mass hardness. When using SWE to measure the elastic modulus of renal parenchyma in CKD patients in real time, quantitative analysis of absolute kidney stiffness information can objectively assess the CKD with renal stiffness, thereby opening up a new approach to the evaluation of CKD fibrosis.
| Materials and Methods | ▴Top |
The present Hand Institutional Review Board approved the waiver. This study was carried out in accordance with the ethical standards of the responsible body on human subjects as well as the Declaration of Helsinki.
Search protocol
Databases of PubMed, Embase and Cochrane Library were searched for the use of SWE to assess CKD fibrosis up to April 26, 2021. Mesh strategies and free words were used for searching in the database: “chronic kidney failure” OR “kidney disease” OR “kidney failure” OR “chronic kidney disease” OR “kidney failure, chronic” OR “renal insufficiency, chronic” OR “kidney stiffness” OR “renal parenchymal stiffness” OR “kidney elasticity” AND “elasticity imaging techniques” OR “acoustic radiation force impulse imaging” OR “elastographies” OR “fibroscan” OR “ultrasonically” AND “elastance” AND “image”. In order to search the entire document as much as possible, the retrieval method in this study is in combination of subject terms with free words, network retrieval with manual retrieval, and a second review of the retrieved related documents. Then the two investigators independently screened according to the standard that is used to analyze the diagnostic ratio than literature.
Study and data selection
Inclusion criteria are: 1) The types of literature mainly include the published diagnostic tests on SWE evaluation of CKD; 2) The research object is CKD caused by various reasons; 3) The research method is to use SWE to detect the severity of renal fibrosis; 4) The literature provides the original data and we can directly/indirectly calculate the sensitivity, specificity, false negatives, false positives and other data.
Exclusion criteria are: 1) The diagnosis of CKD/renal insufficiency is not clear; 2) The data are incomplete; 3) Repeated publications that are within the same main research literature.
Data extraction and quality assessment
According to the established standards, the two investigators independently screened relevant database documents and extracted the data. The extracted data include authors, the year published in journals and publications, samples, research location, etiology, average age, and gender. Data are related to SWE and diagnostic tests for renal insufficiency diseases, as well as the calculation of the sensitivity and specificity, the number of true positives, false positives, true negatives, and false negatives. The Quality Assessment of Diagnostic Accuracy Studies (QUADAS)-2 tool is used to assess the data quality [15]. Disagreements were resolved through discussions between the two investigators. Case selection, trial evaluation, diagnostic criteria and risk assessment are included in the study.
Statistical analysis
The main meta-analysis software for extracted data includes STATA 16 (Stata Corp., University of Texas College, USA) and Review Manager 5.3 (The Nordic Cochrane Center, The Cochrane Collaboration, Copenhagen, Denmark). They are used to calculate the pooled sensitivity (S-SEN), specificity (S-SPE), pooled positive likelihood ratio (PLR-P), negative likelihood ratio (PLR-N), diagnostic odds ratio (DOR) and 95% confidence interval (95% CI), and summary receiver operating characteristic curve (SROC) and area under the curve (AUC) [16, 17]. The S-SEN and S-SPE forest maps were constructed using SWE to assess the accuracy of renal fibrosis. A DOR ROC chart was drawn to determine the threshold effect. The heterogeneity test was performed by Cochrane-Q and I2 statistic. If inconsistency (I2) ≥ 25% and P < 0.05, DOR is considered heterogeneous, and the random effects model is selected. Otherwise, the fixed effects mode shall be selected.
| Results | ▴Top |
Literature searches
A total of 1,306 English documents were searched in the relevant literature database, and those duplicate articles were deleted. After completing detailed manual review, 16 articles met the inclusion and exclusion criteria. After a detailed manual review, the duplicates and documents that did not meet the inclusion criteria were eliminated. Finally, there were six documents in line with the inclusion criteria. See Figure 2 for the literature screening process and results of the Preferred Reporting Items for Systematic Reviews and Meta-Analyses (PRISMA) research guide. The main features of meta-analysis in the study were included in Table 1 [18-23].
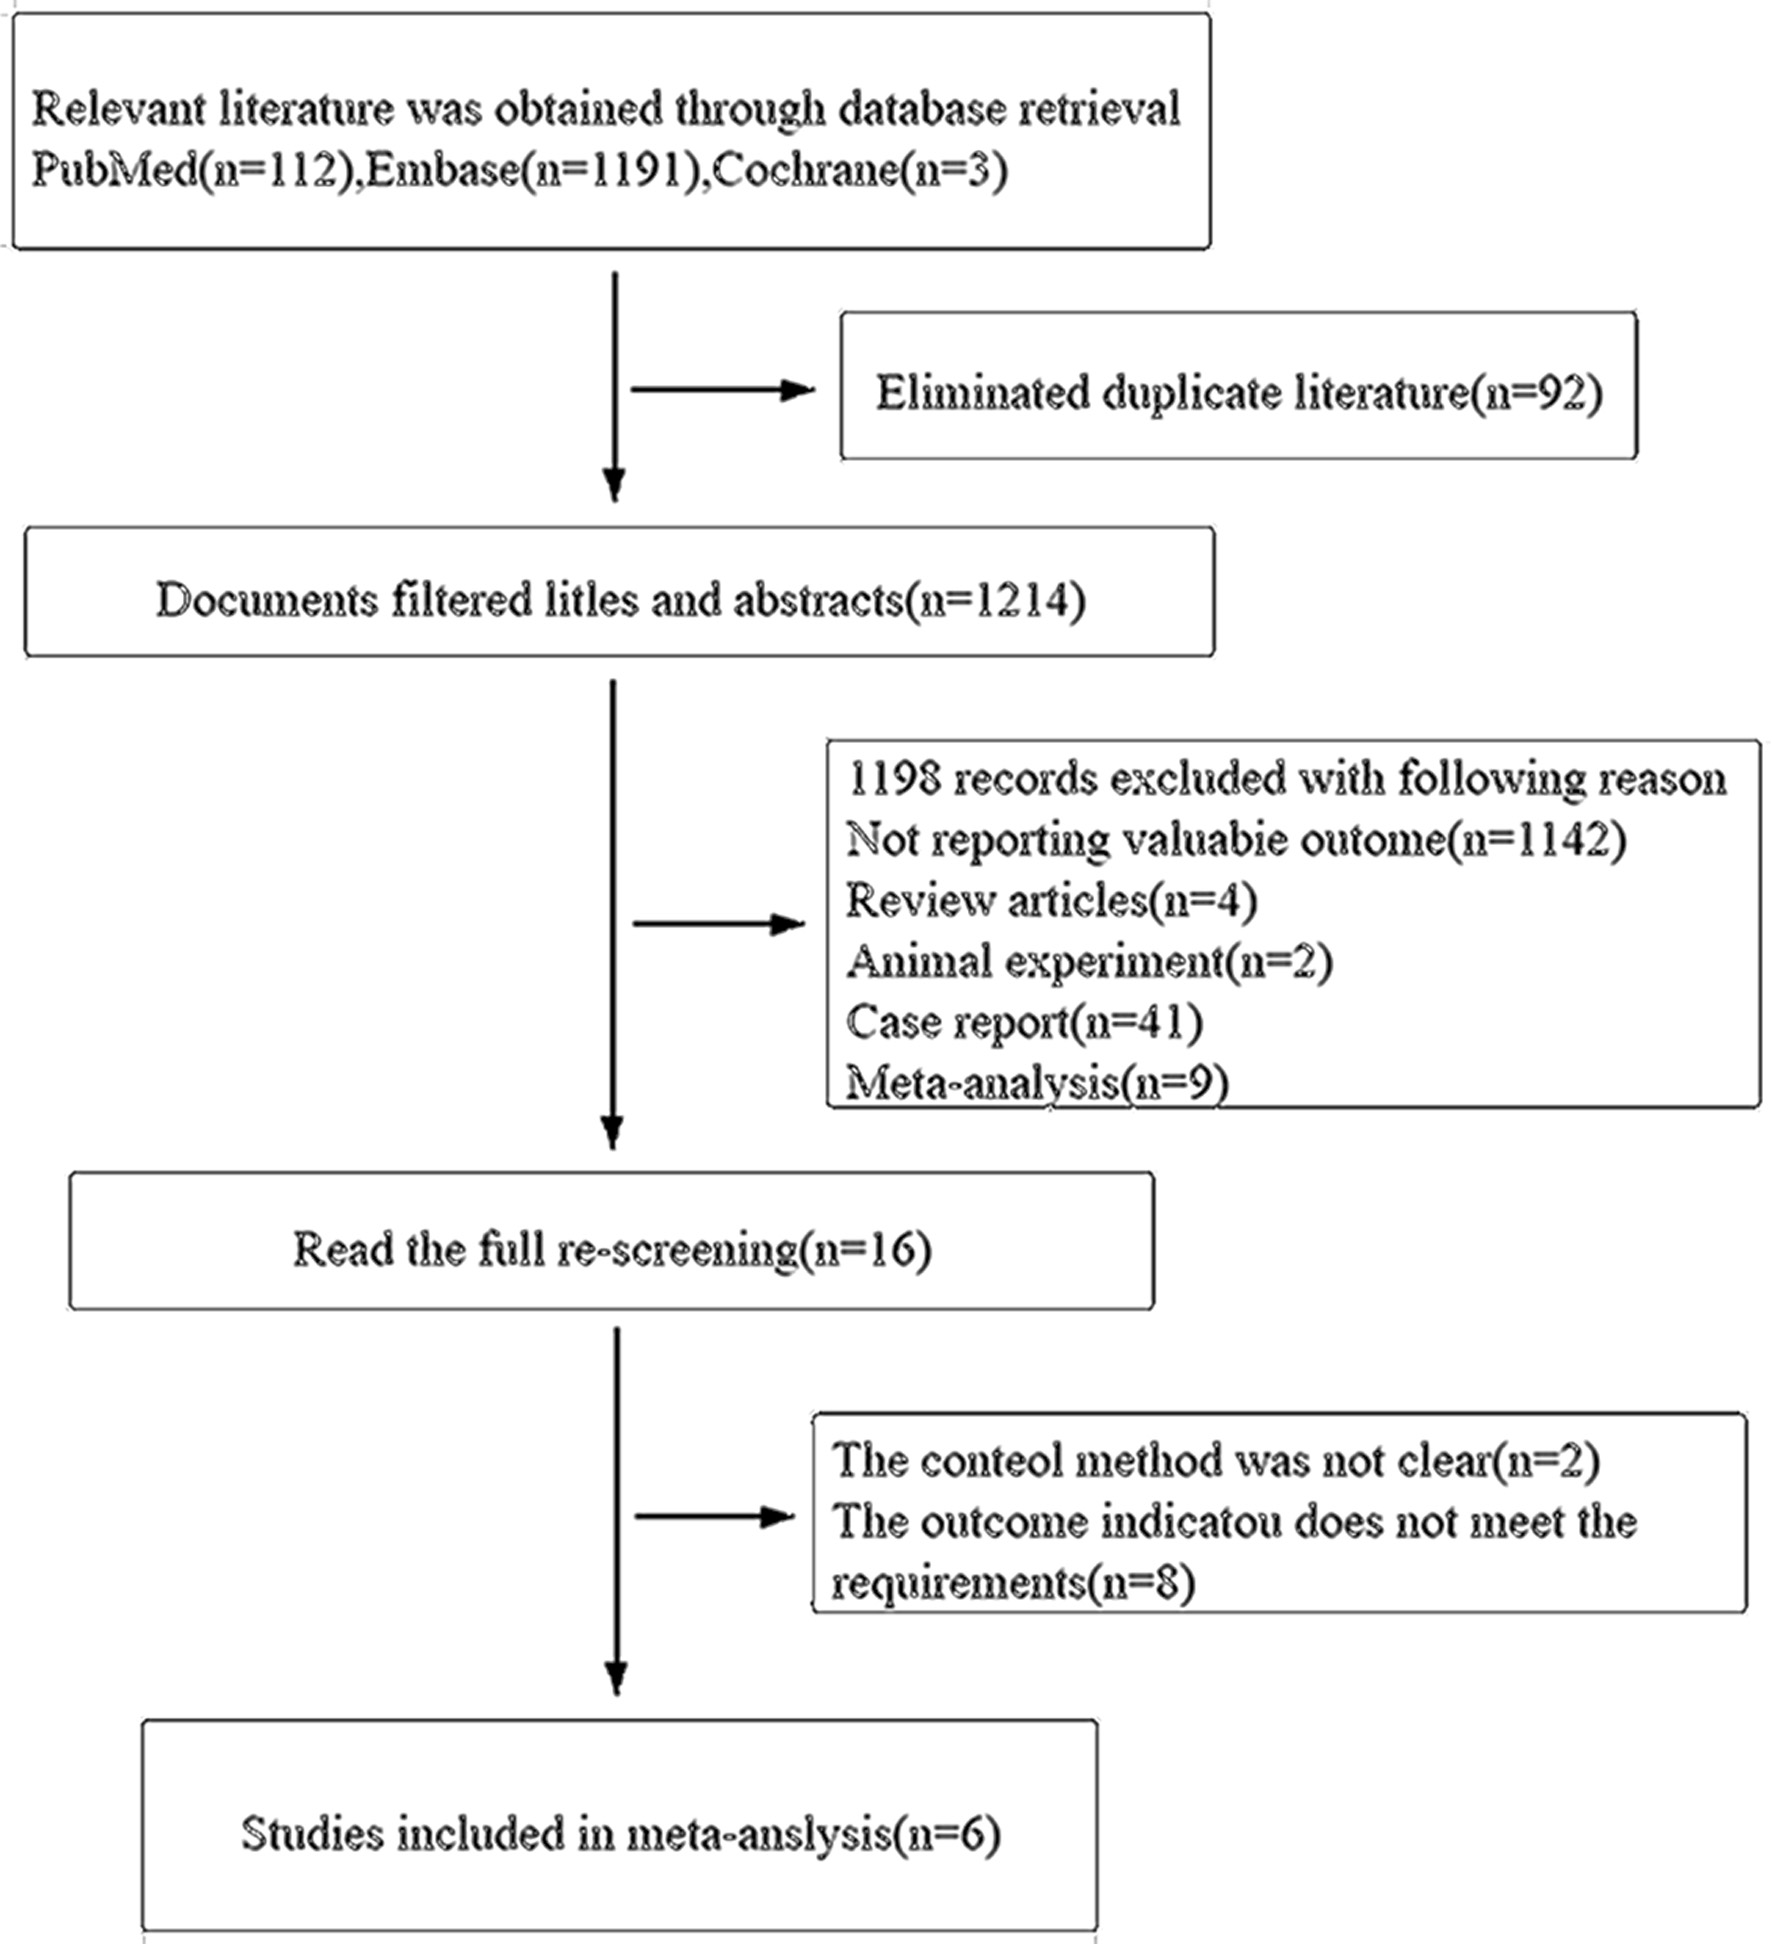 Click for large image | Figure 2. Screening processes of document and results. |
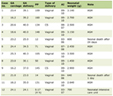 Click to view | Table 1. Characteristics and Diagnostic Performance of Included Studies of CKD Fibrosis |
Study characteristics
Six studies were included in the meta-analysis, including 405 patients, aged between 23 and 79 years. The etiology was divided into CKD, idiopathic nephrotic syndrome (INS) and immunoglobulin A nephropathy (IgAN). In these studies, there are some [18-22] YM values that were used to evaluate the degree of renal fibrosis in CKD patients. The results of the studies indicate that the YM value is higher as the CKD condition progresses. It should be pointed out that in the study by Grosu et al, the hardness of the kidney was evaluated by shear wave velocity (SWV) on an ultrasound machine [23]. The results showed that the two-dimensional (2D)-SWE value of CKD was significantly higher than that of the healthy group, and patients with reduced estimate the glomerular filtration rate (GFR) have higher SWV values. Compared with normal kidneys, the cut-off values of the six studies found that the SWE diagnostic threshold of CKD renal insufficiency is lower, while the cut-off value of autoimmune nephropathy is higher [24] (Table 2 [18-23]). In addition, Radulescu et al [19] studied the high diagnostic threshold of SWE mainly because most of the CKD patients selected for the study were stage 4 and 5 CKD patients.
Click to view | Table 2. The Diagnostic Threshold (kPa) of SWE in Fibrosis With Chronic Kidney Disease |
Methodological quality assessment
According to the methodological assessment of the QUADAS-2 checklist, all studies were prospective and well designed, indicating good quality of inclusion studies. Patients have been included in all studies continuously; laboratory tests and/or clinical diagnosis were used as the reference criteria. The risk of case selection, trial evaluation, diagnostic criteria and clinical applicability was low. The outcomes were shown in Figure 3.
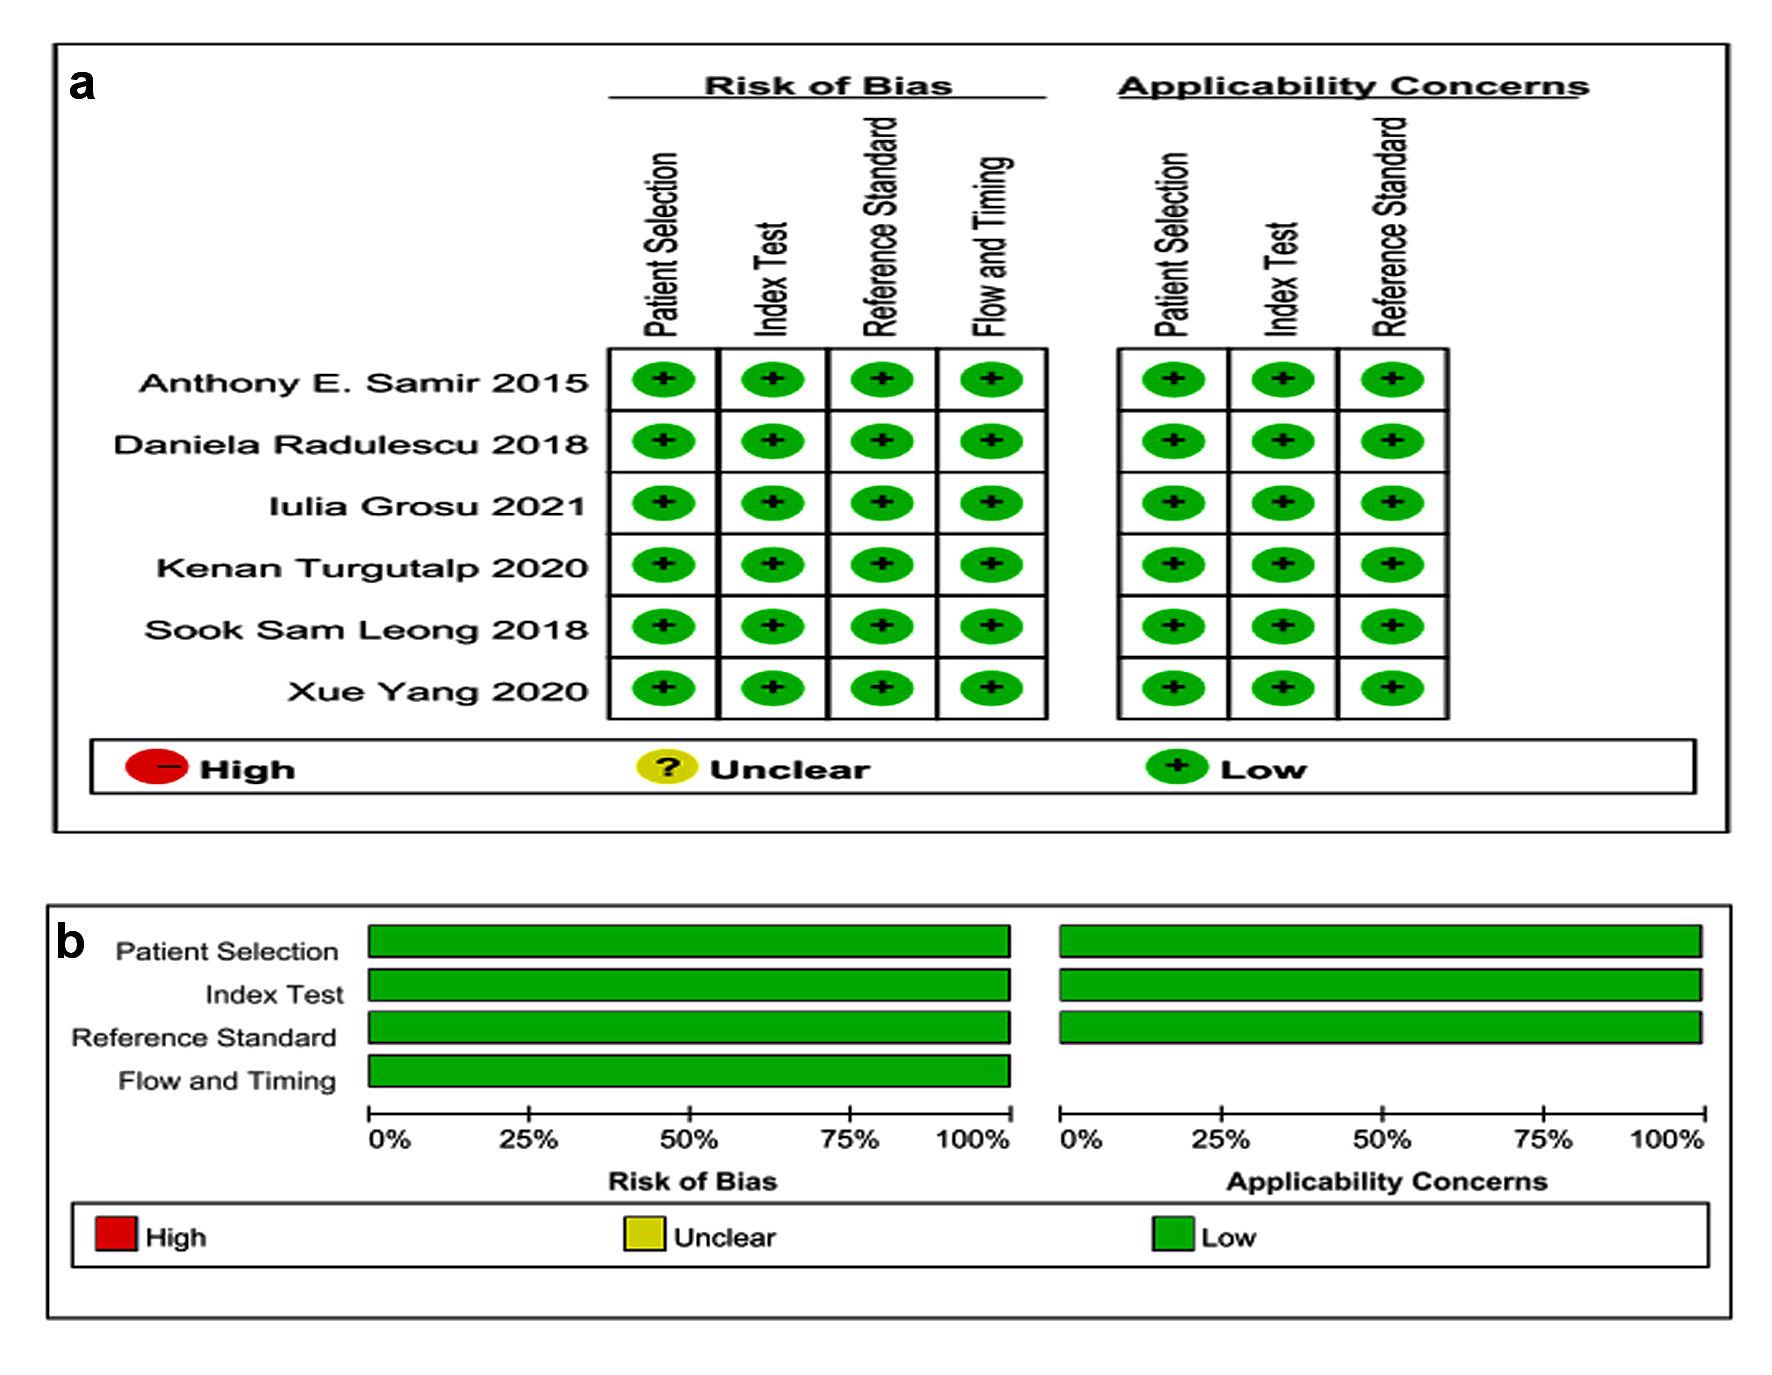 Click for large image | Figure 3. Quality assessment of the studies according to QUADAS-2. QUADAS: Quality Assessment of Diagnostic Accuracy Studies. |
Meta-analysis
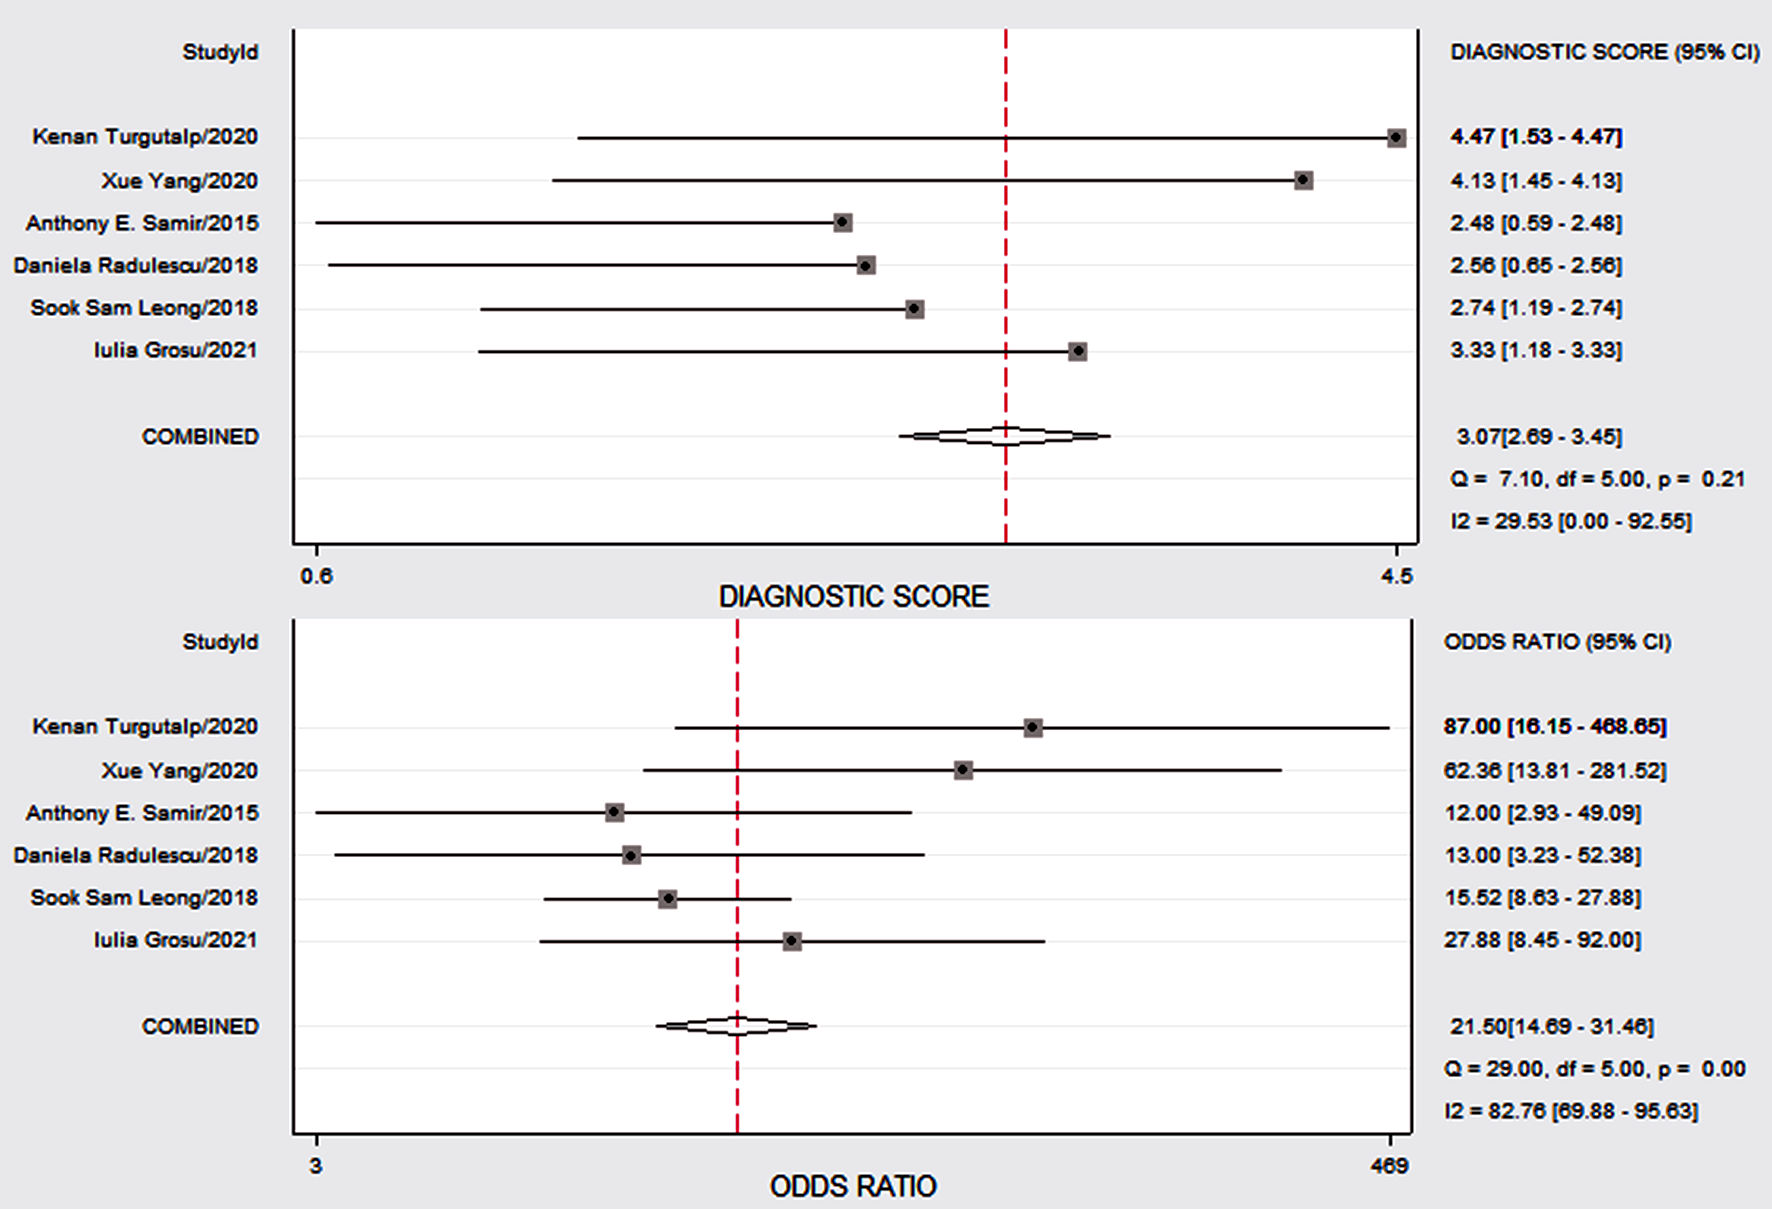
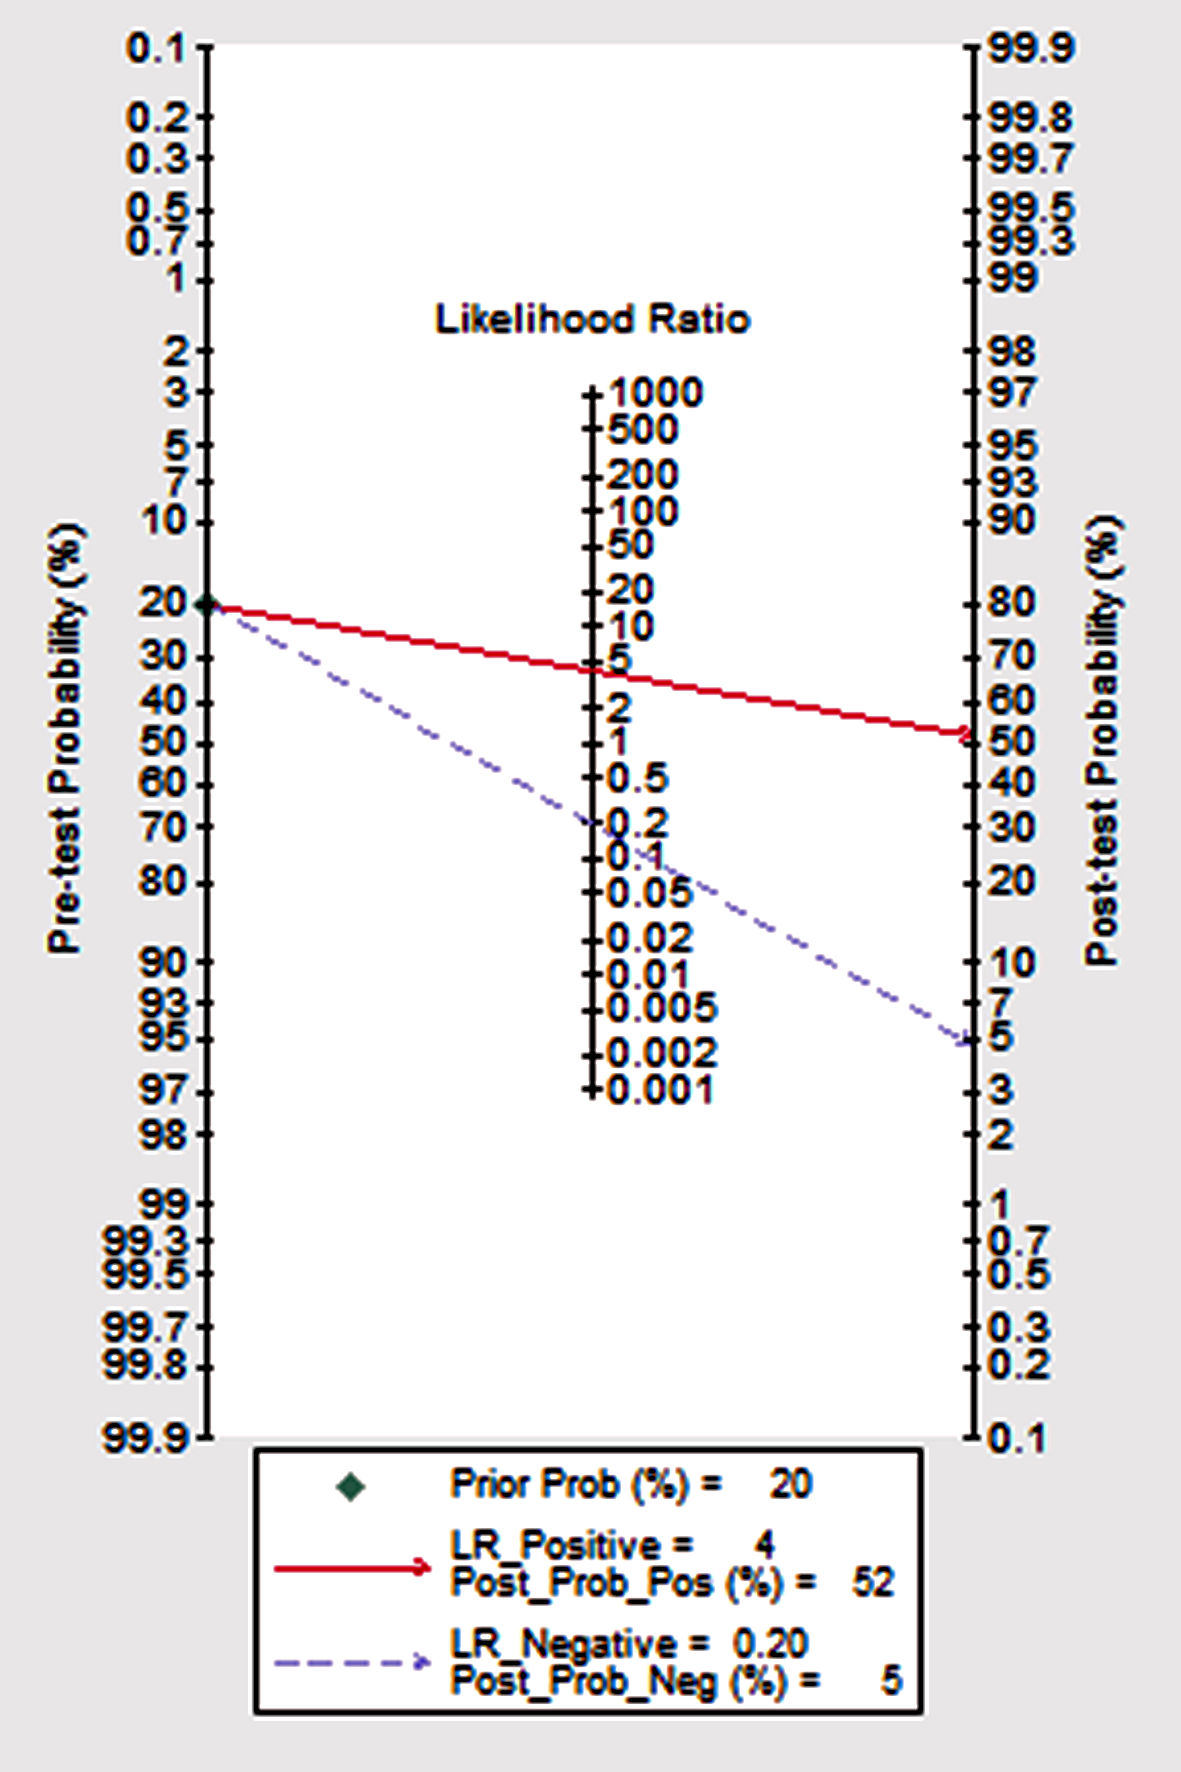
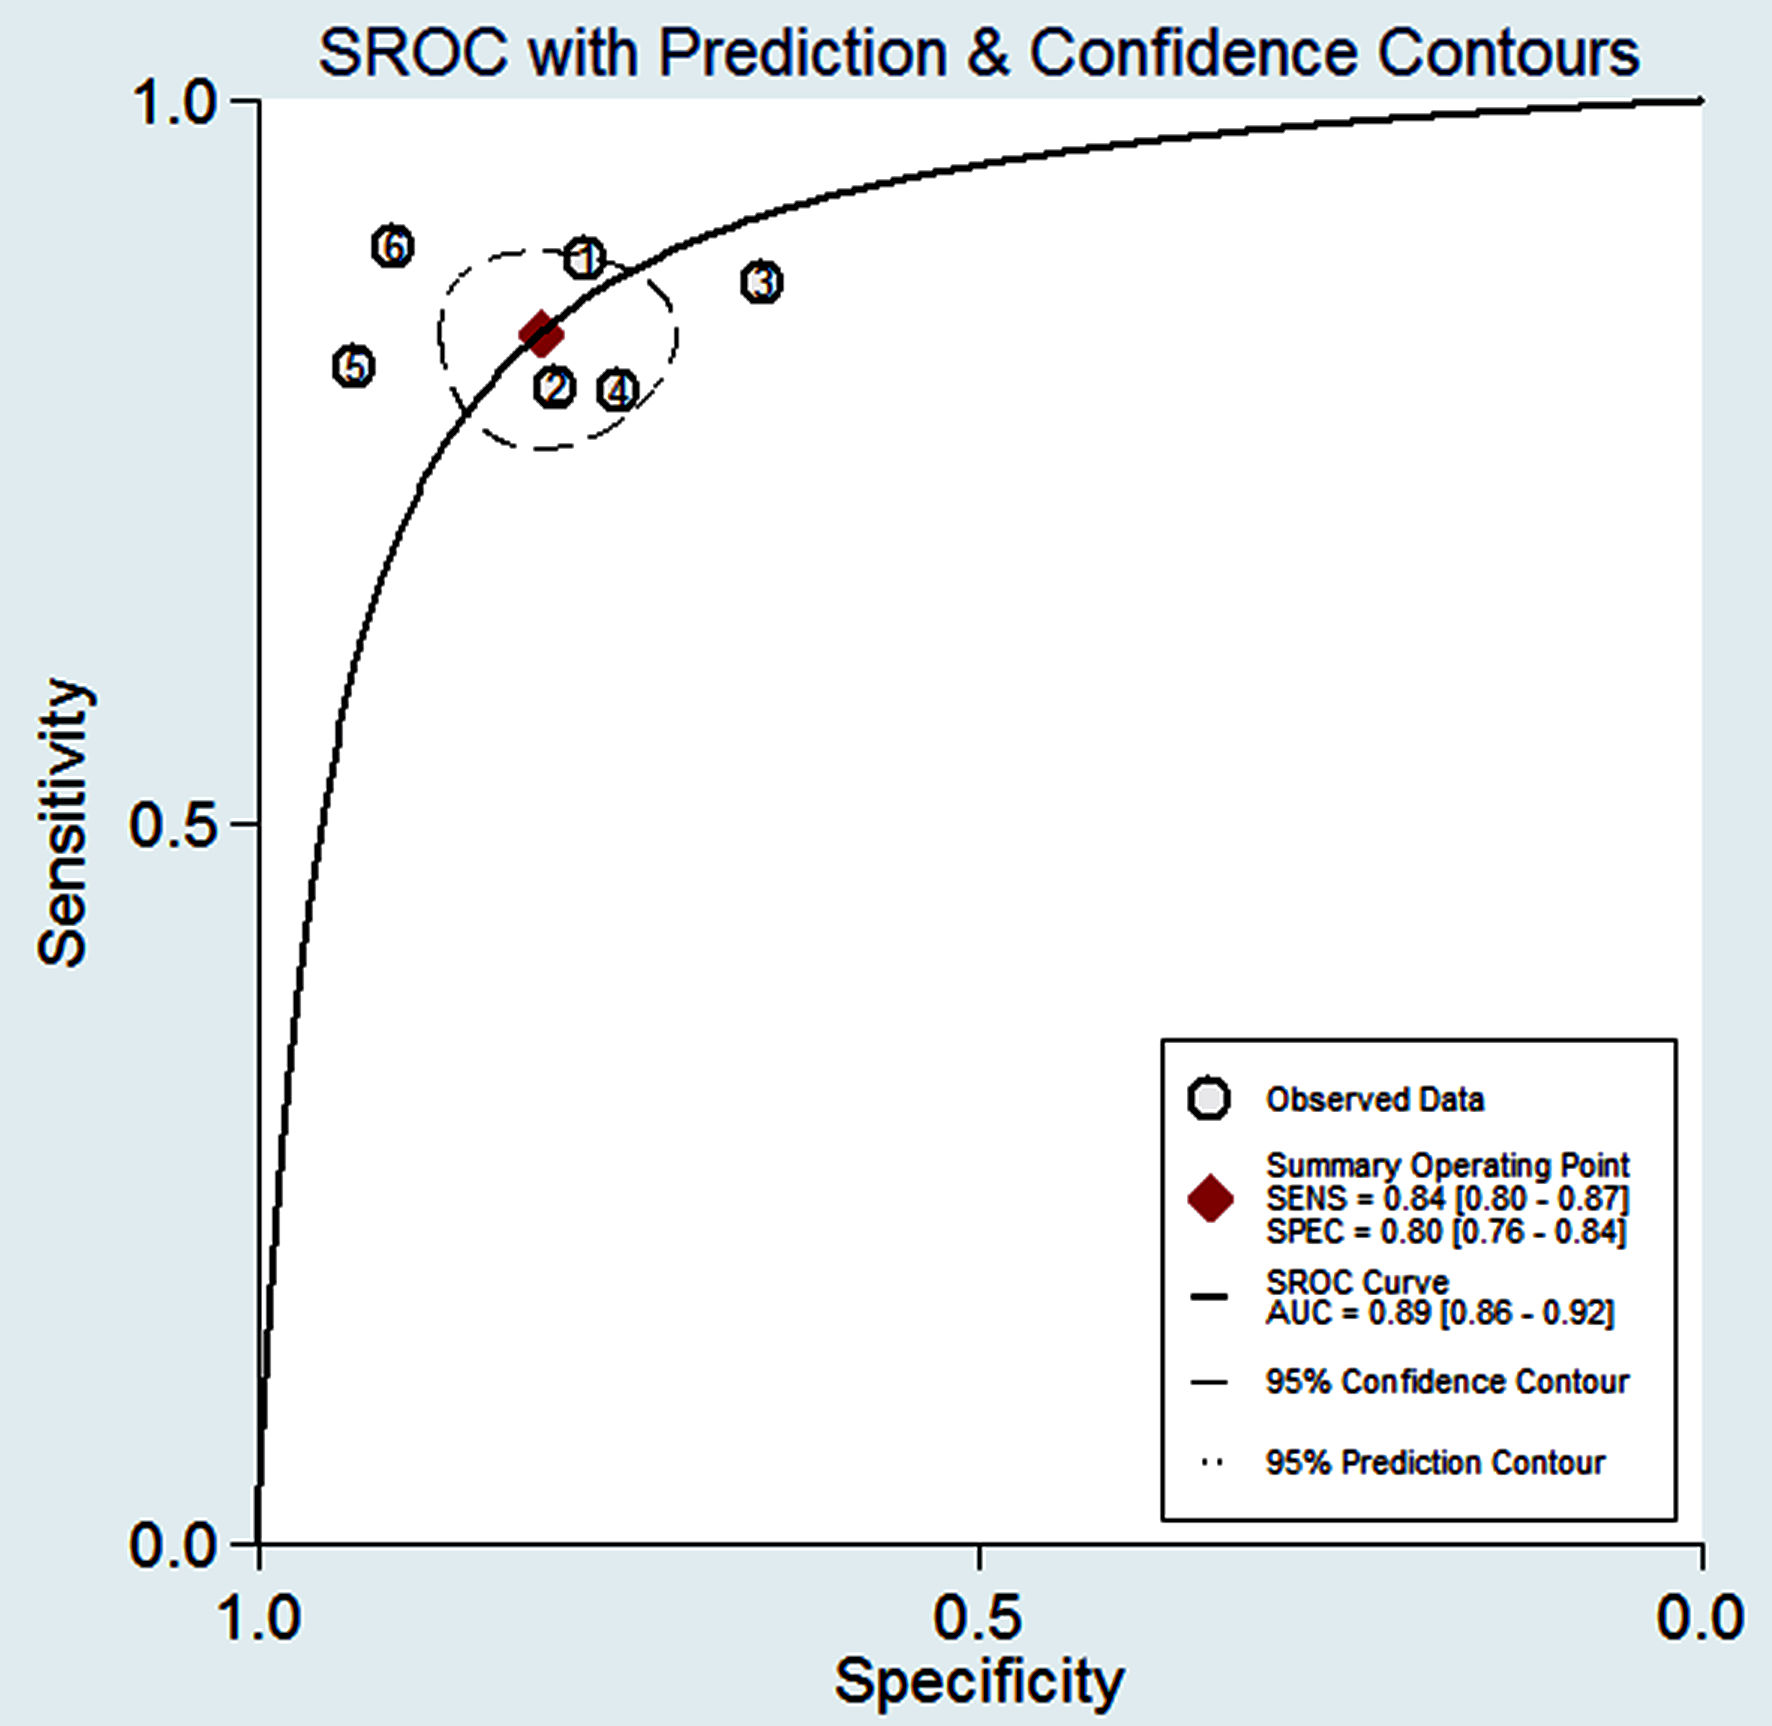
Figure 4 shows the preliminary analysis of the S-SEN (I2 = 0.00%, Q = 4.81, P = 0.44 (> 0.1)) and S-SPE (I2 = 44.36%, Q = 8.99, P = 0.11 (> 0.1)). It revealed that there was no significant heterogeneity. The S-SEN, S-SPE and DOR were 84% (95% CI: 80-87%), 80% (95% CI: 76-84%) and 21.50 (95% CI: 14.69 - 31.46), respectively. PLR-P was 4.29 (95% CI: 3.41 - 5.37) and PLR-N was 0.20 (95% CI: 0.16 - 0.25), of which the PLR-P was greater than 4 and the PLR-N was less than 0.3, providing “strong” diagnostic evidence. The area under the SROC curve was 0.89 (95% CI: 86-92%), which suggested high diagnostic accuracy. Fagan diagram was drawn according to Bayes principle. After the test, the PLR-P increased to 52% from 20%, while the PLR-N decreased to 5% (Figs. 5 - 8).
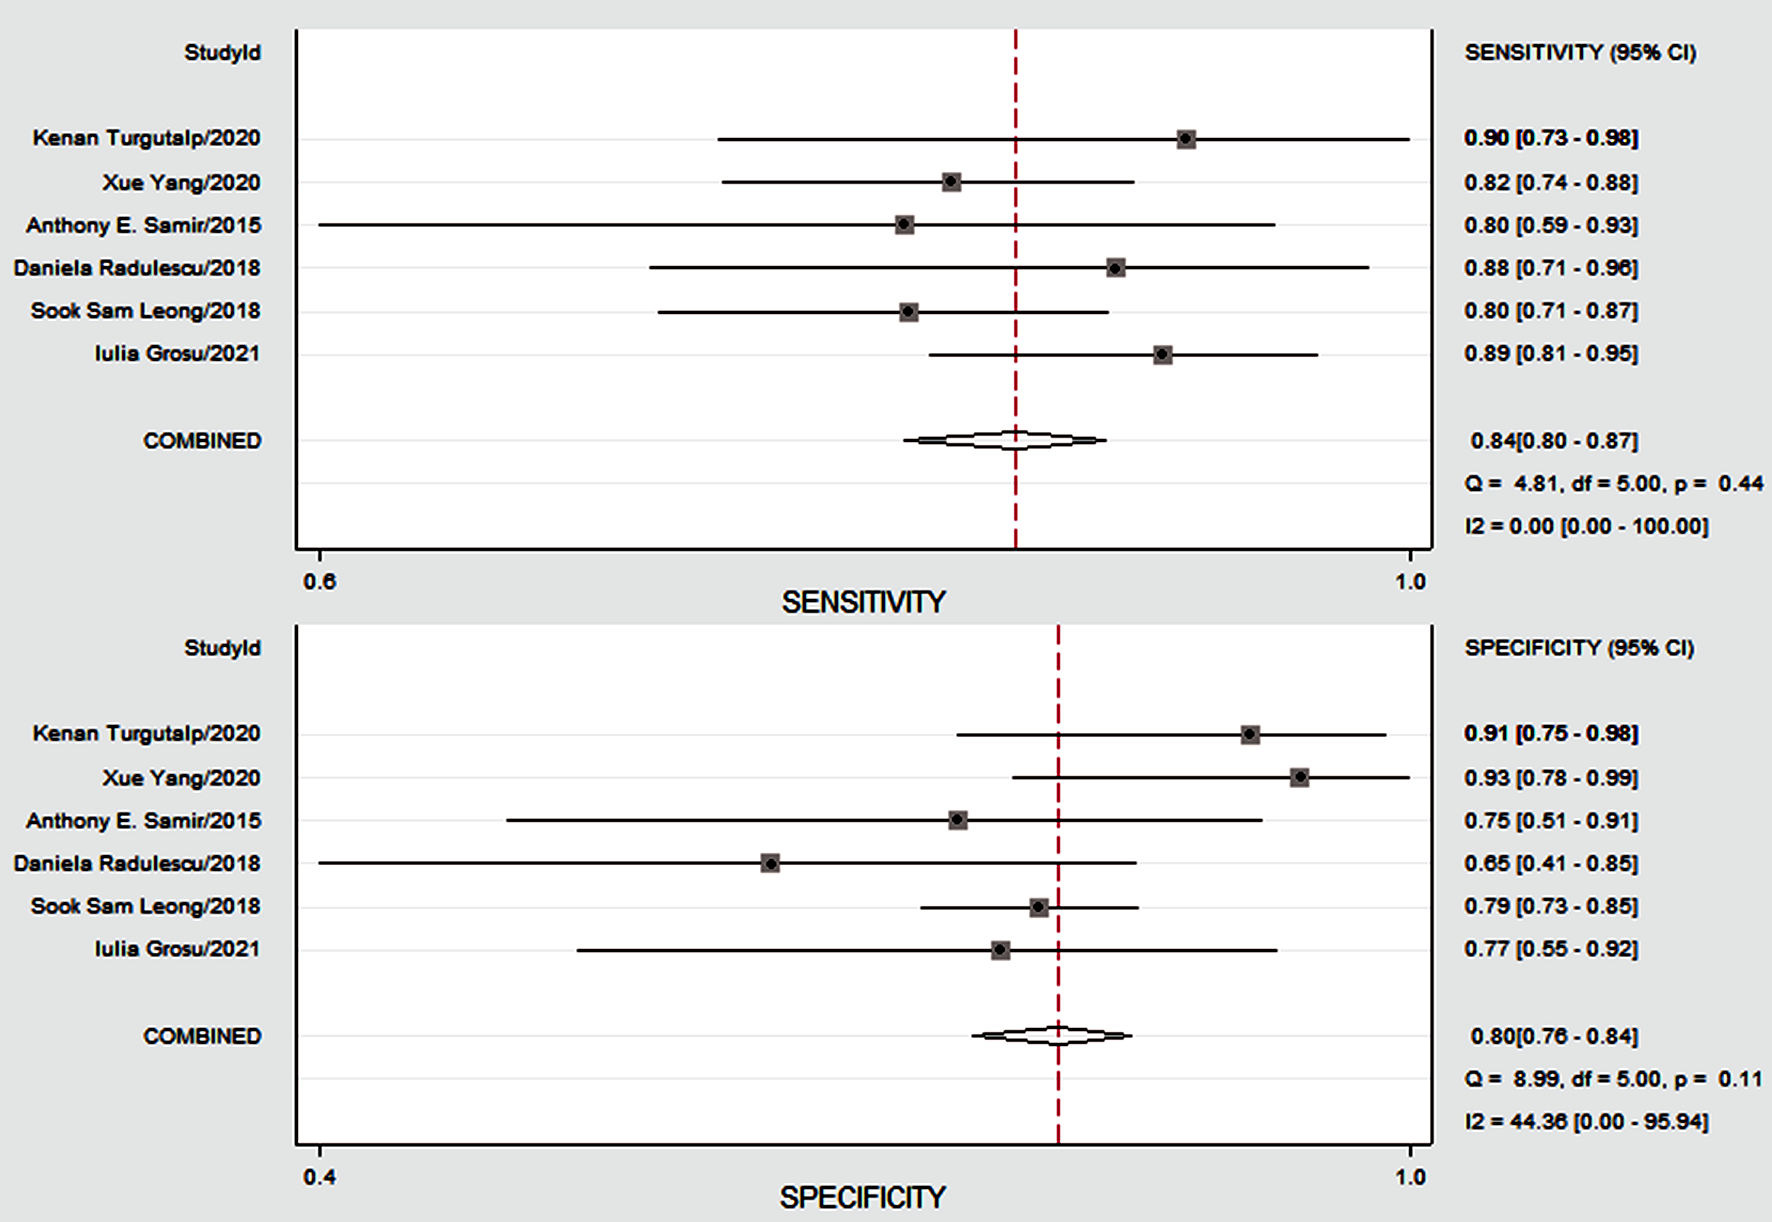 Click for large image | Figure 4. The Forest plots showing diagnostic performance estimates (sensitivity and specificity) of CKD fibrosis. CKD: chronic kidney disease; CI: confidence interval. |
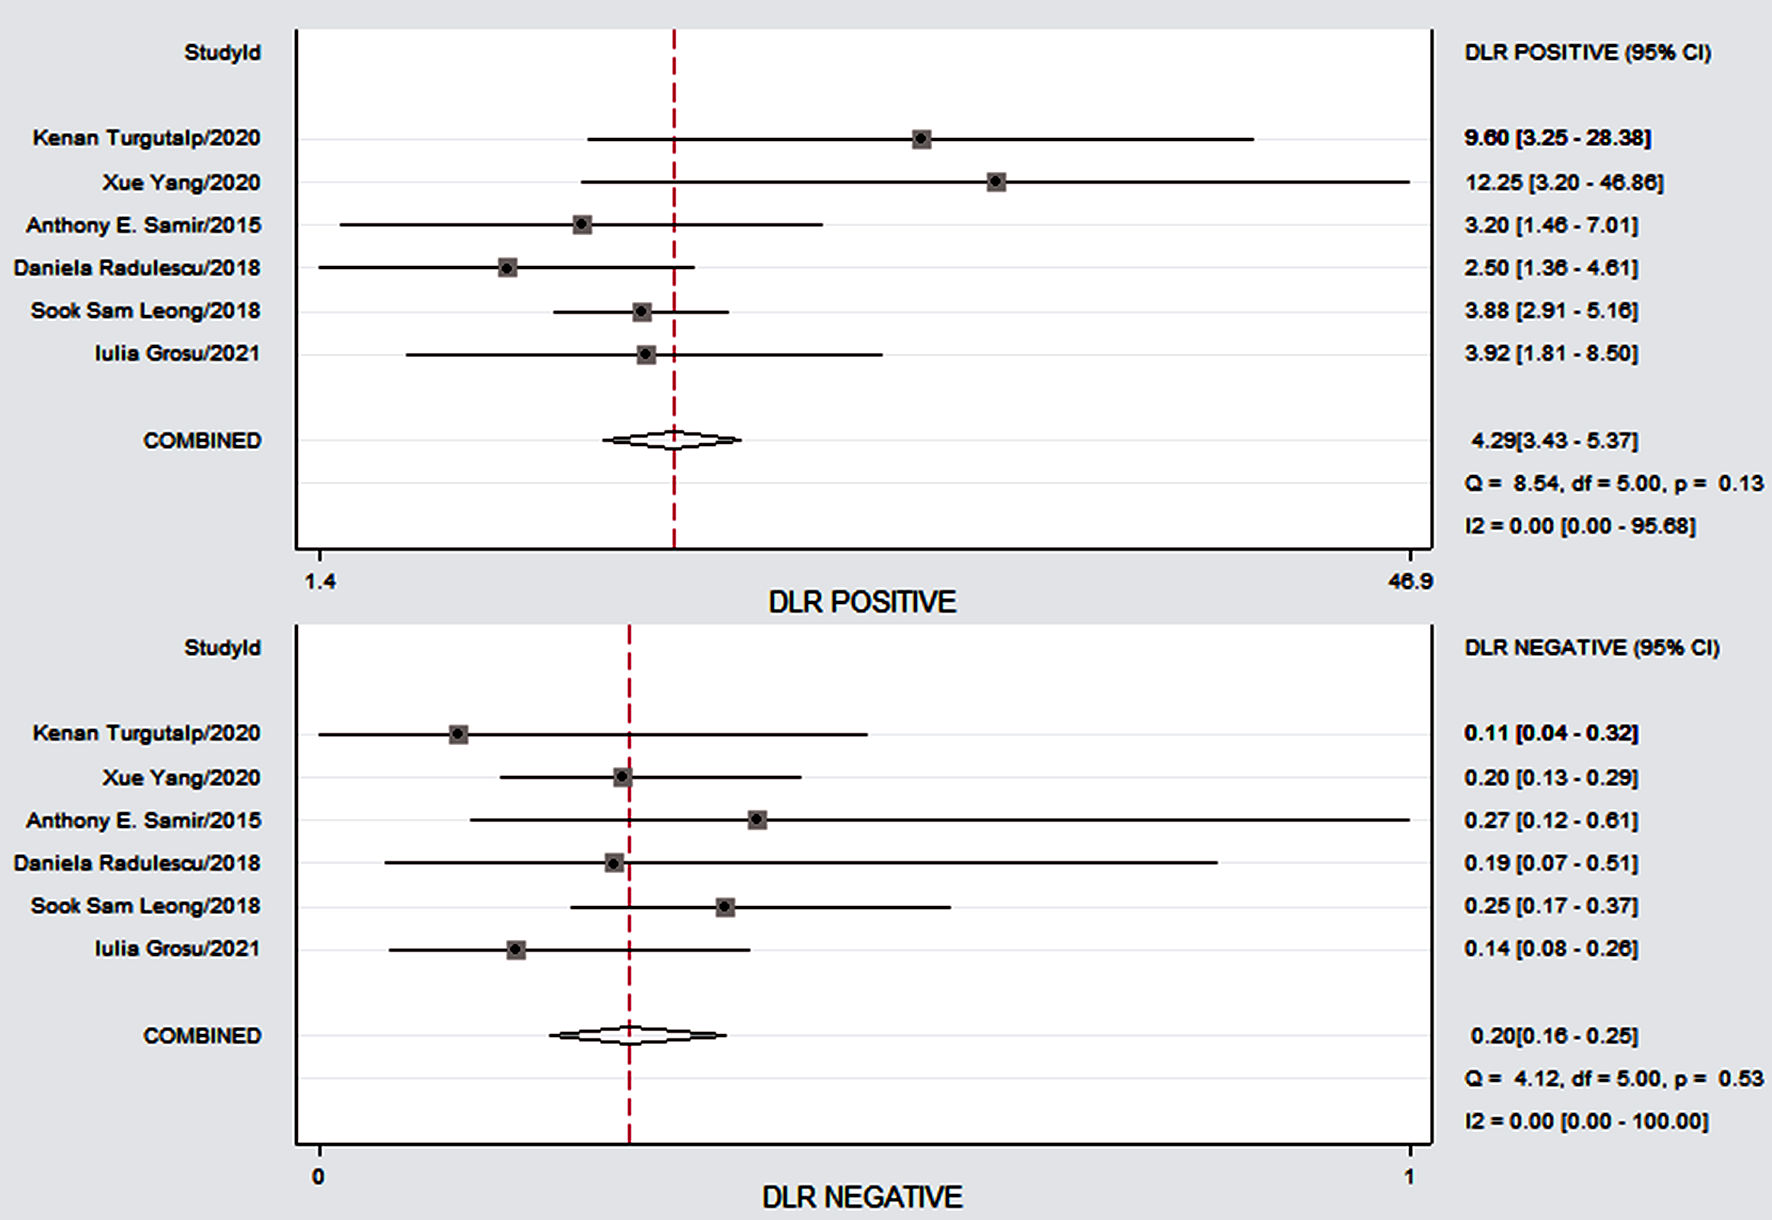 Click for large image | Figure 5. The Forest plots demonstrating the study specificity of SWE on the right y axis in the evaluation of CKD fibrosis. CKD: chronic kidney disease; SWE: shear wave elastography; CI: confidence interval; DLR: digital light radiography. |
 Click for large image | Figure 6. The Forest map plot designed to demonstrate study-specific CKD of SWE on the right y axis in assessment. CKD: chronic kidney disease; SWE: shear wave elastography; CI: confidence interval. |
 Click for large image | Figure 7. The SROC curve: midas tp fp fn tn, es (x) plot SROC2 graph. SROC: summary receiver operating characteristic curve; LR: likelihood ratio. |
 Click for large image | Figure 8. The Fagan’s nomogram for SWE illustrating post-test probability with a fixed pre-test probability of 20% for CKD. CKD: chronic kidney disease; SWE: shear wave elastography; SEN: sensitivity; SPE: specificity. |
Publication bias
The Deeks’ funnel chart was used to detect in publication bias. The P value was 0.53 and all studies were distributed on both sides of the regression line, indicating no obvious deviation in publications (Fig. 9).
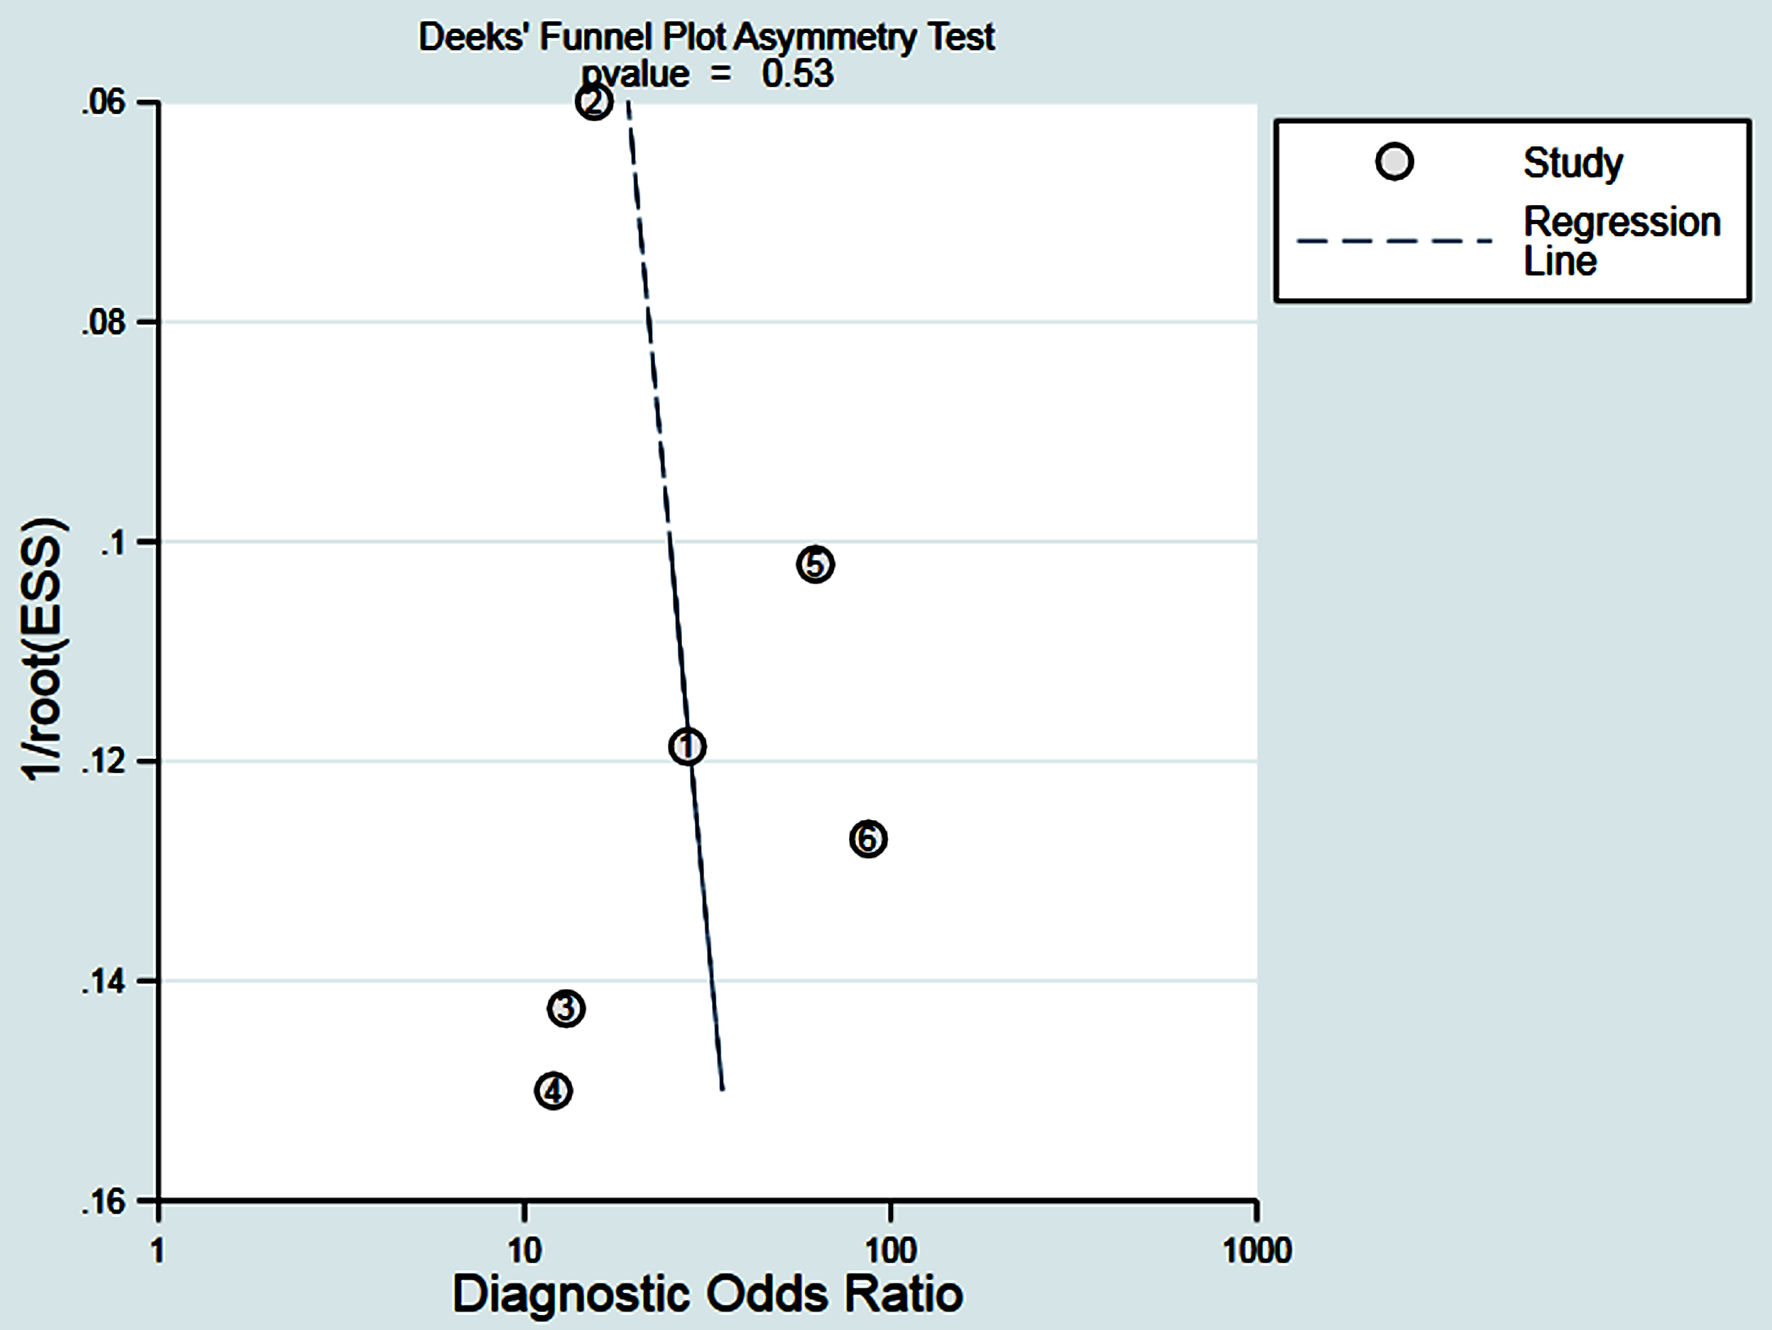 Click for large image | Figure 9. The Deeks funnel plot is a bias-odd detection of the published results, all distributed on both sides of the regression lines, indicating that no significant deviations were found. |
| Discussions | ▴Top |
At present, the incidence of CKD is very high worldwide. However, regardless of the underlying cause, the progression of CKD includes substantial fibrosis, tubular interstitial atrophy, and glomerular compartment sclerosis. CKD is a common cause of kidney fibrosis, associated with the severity of the disease [25-27]. The histological examination of kidney biopsy specimens is currently the only clinical histological evaluation method for renal fibrosis. Invasiveness is associated with specific risks of surgery and the risk of sampling errors [20]. The detection mainly relies on biomarkers in medical practice. SWE generates shear waves through sensors and measures tissue stiffness noninvasively. Existing human and animal studies have shown a correlation between the SWE estimation of renal YM and the presence of CKD or fibrosis [20, 28, 29].
With the development of noninvasive quantitative technology and the rapid development of diagnostic techniques in the field of liver fibrosis, renal elastography technology has become available. As the incidence of CKD increases, the application of elastography may be of critical value in the assessment of tissue stiffness. This study has collected the domestic and foreign researches on the diagnosis of CKD by SWE technology. When extracting data, we collected according to uniform standards the literature that involves and summarizes the same quantitative parameters. The analysis of the diagnostic value of SWE summarizes in the diagnosis of CKD with fibrosis, and provides strong evidence for SWE in the study of CKD with renal stiffness in the future.
Meta-analyses showed that in six studies, SWE imaging techniques assessed the sensitivity and specificity of tissue stiffness in 80.0-89.2% and 65.0-93.3%. The efficacy of SWE imaging technology in assessing tissue stiffness is judged from a single study. It is not easy. The sensitivity and specificity by meta-analysis are 84% (95% CI: 80-87%) and 80% (95% CI: 76-84%). The DOR is 21.50 (95% CI: 14.69 - 31.46) and the SROC curve is 89% (95% CI: 86-92%), indicating that the application of elastography technology has a higher value in the evaluation of chronic kidney fibers. The results of Leong et al [18] show that YM measurements are significantly correlated with estimated glomerular filtration rate (eGFR), serum creatinine and urea, which is consistent with our results. SWE can achieve equivalent S-SEN and S-SPE, which shows that SWE is a truly valuable imaging method for evaluating renal fibrosis. Mehmet Sami et al [30] use SWE to evaluate the fibrosis of CKD in a study, and the results shows a highly correlation with the elasticity measurement of fibrosis patients in renal biopsy (P = 0.046). Likelihood ratio (LR) is a comprehensive indicator that reflects the diagnostic value of diagnostic experiments [31, 32]. In our study, PLR-P is 4.29 (95% CI: 3.43 - 5.37) and PLR-N is 0.20 (95% CI: 0.16 - 0.25), providing “strong” diagnostic evidence. In this study, it is found that the AUC of chronic renal fibrosis exceeds 89%, indicating that SWE can accurately assess different causes of renal fibrosis and has highly diagnostic performance.
The SWE cannot accurately and quantitatively assess renal fibrosis, which will lead to an increase in P-SEN and a decrease in P-SPE. The results are consistent with the study of Sia et al [33]. A large number of published research results [34-36] show that kidney stiffness of the estimated value seems to increase with increasing in the CKD stage. The strong correlation with histological markers of fibrosis indicates that the observed difference is due to renal parenchymal stiffness. In the meta-analysis, studies with low sample sizes are included and no subgroup analysis is performed. Therefore, extensive analysis and multiple subgroup analysis are needed to assess the diagnostic value of SWE in the diagnosis of CKD fibrosis in future studies.
The meta-analysis with the P-SEN (I2 = 0.00%) and P-SPE (I2 = 44.367%) of the forest plot 95% CI shows a moderate degree of heterogeneity. The main reason is maybe due to the different staging and grouping study design and patient characteristics of CKD. Secondly, it is related to the threshold of each individual study. There are multiple confounding factors in the study object.
Limitations of this study include: 1) Shear modulus is a new imaging technique for evaluating tissue stiffness, and the stiffness measurement of the kidney is affected by factors such as anisotropy and blood perfusion rate; 2) In some research projects, CKD patients had not clinically undergone renal biopsy, and the stage of CKD was not accurately determined; 3) There are differences between the two investigators in the evaluation of renal stiffness, as well as the ultrasound equipment used in the literature. Different manufacturers and models may cause large differences in the measured values. However, due to the limited sample size of the included literature, it is impossible to conduct the subgroup analysis based on the sources of heterogeneity in this aspect of the data; 4) We also use known imperfect eGFR reference standards to estimate the severity of CKD. There are no kidney biopsy data available to quantify the histological fibrosis.
In short, this study shows that SWE has a highly performance in evaluating the hardness of CKD, especially when using a higher shear modulus threshold, which can provide a reference for clinical judgment and has a great application prospect. Nonetheless, this result still needs to be approved.
Larger multi-center studies and longitudinal follow-up are needed to conduct a more comprehensive evaluation to assess the development of CKD more accurately.
Conclusions
The meta-analysis shows that SWE is accurate in diagnosing renal fibrosis. However, as mentioned above, due to the various causes of renal fibrosis, different renal stiffness may be produced. Therefore, the diagnostic critical threshold needs to be adjusted under the specific case. The institute involves a limited number of researches, and it is necessary to further study the relationship between the tissue elasticity and the severity of renal fibrosis.
Acknowledgments
Thanks for the help of Dream Team of the Ultrasound Department of Shenzhen People’s Hospital.
Financial Disclosure
None to declare.
Conflict of Interest
The authors disclose no conflict of interest.
Informed Consent
Informed consent was waived in this manuscript.
Author Contributions
Xian Ling Mo (chief physician) and Hui Yan Meng (deputy chief physician) independently screened according to the standard that can analyze the diagnostic ratio than literature, had full access to all the data in the study, and take responsibility for the integrity of the data and the accuracy of the data analysis. Concept and design, acquisition, analysis, or interpretation of data: Xian Ling Mo, Hui Yan Meng, Yan Yan Wu, Xue Yan Wei, Zong Ke Li, and Su Qin Yang. Drafting of the manuscript: Xian Ling Mo. Critical revision of the manuscript for important intellectual content: all authors. Statistical analysis: Xian Ling Mo. Administrative, technical, or material support: Xian Ling Mo and Hui Yan Meng. Supervision: Xian Ling Mo.
Data Availability
The authors declare that data supporting the findings of this study are available within the article.
Abbreviations
CKD: chronic kidney disease; SWE: shear wave elastography; S-SEN: summary sensitivity; S-SPE: summary specificity; DLR: digital light radiography; DLR-P: DLR positive; DLR-N: DLR negative; PLR-P: positive likelihood ratio; PLR-N: negative likelihood ratio; DOR: diagnostic odds ratio; SROC: summary receiver operating characteristic curve; AUC: area under the curve; INS: idiopathic nephrotic syndrome; IgAN: immunoglobulin A nephropathy; SWV: shear wave velocity; kPa: kilopascals; YM: Young’s modulus; QUADAS: Quality Assessment of Diagnostic Accuracy Studies; eGFR: estimated glomerular filtration rate; GFR: glomerular filtration rate; LR: likelihood ratio
| References | ▴Top |
- Hill NR, Fatoba ST, Oke JL, Hirst JA, O'Callaghan CA, Lasserson DS, Hobbs FD. Global prevalence of chronic kidney disease - a systematic review and meta-analysis. PLoS One. 2016;11(7):e0158765.
doi pubmed - Collins AJ, Foley RN, Herzog C, Chavers BM, Gilbertson D, Ishani A, Kasiske BL, et al. Excerpts from the US renal data system 2009 annual data report. Am J Kidney Dis. 2010;55(1 Suppl 1):A6-A7.
doi pubmed - Coresh J, Byrd-Holt D, Astor BC, Briggs JP, Eggers PW, Lacher DA, Hostetter TH. Chronic kidney disease awareness, prevalence, and trends among U.S. adults, 1999 to 2000. J Am Soc Nephrol. 2005;16(1):180-188.
doi pubmed - Liang S, Wang WL, Zhu FL, Duan SW, Sun XF, Chen XM, Cai GY, et al. Chinese observational prospective study of ageing population with chronic kidney disease (C-OPTION): a study protocol. BMJ Open. 2018;8(2):e019457.
doi pubmed - Huang JT, Cheng HM, Yu WC, Lin YP, Sung SH, Wang JJ, Wu CL, et al. Value of excess pressure integral for predicting 15-year all-cause and cardiovascular mortalities in end-stage renal disease patients. J Am Heart Assoc. 2017;6(12):e006701.
doi - Bowling CB, Inker LA, Gutierrez OM, Allman RM, Warnock DG, McClellan W, Muntner P. Age-specific associations of reduced estimated glomerular filtration rate with concurrent chronic kidney disease complications. Clin J Am Soc Nephrol. 2011;6(12):2822-2828.
doi pubmed - Drawz PE, Babineau DC, Rahman M. Metabolic complications in elderly adults with chronic kidney disease. J Am Geriatr Soc. 2012;60(2):310-315.
doi pubmed - Kidney Disease: Improving Global Outcomes (KDIGO) CKD Work Group. KDIGO 2012 clinical practice guideline for the evaluation and management of chronic kidney disease. Kidney Int. 2013; 3(suppl):1-150.
- Buturovic-Ponikvar J, Visnar-Perovic A. Ultrasonography in chronic renal failure. Eur J Radiol. 2003;46(2):115-122.
doi - Li C, Zhang C, Li J, Huo H, Song D. Diagnostic Accuracy of Real-Time Shear Wave Elastography for Staging of Liver Fibrosis: A Meta-Analysis. Med Sci Monit. 2016;22:1349-1359.
doi pubmed - Shan QY, Liu BX, Tian WS, Wang W, Zhou LY, Wang Y, Xie XY. Elastography of shear wave speed imaging for the evaluation of liver fibrosis: A meta-analysis. Hepatol Res. 2016;46(12):1203-1213.
doi pubmed - Chhajer G, Arunachalam VK, Ramasamy R, Mehta P, Cherian M. Elastography: a surrogate marker of renal allograft fibrosis - quantification by shear-wave technique. Pol J Radiol. 2021;86:e151-e156.
doi pubmed - Liu Q, Wang Z. Diagnostic value of real-time shear wave elastography in children with chronic kidney disease. Clin Hemorheol Microcirc. 2021;77(3):287-293.
doi pubmed - Hassan K, Loberant N, Abbas N, Fadi H, Shadia H, Khazim K. Shear wave elastography imaging for assessing the chronic pathologic changes in advanced diabetic kidney disease. Ther Clin Risk Manag. 2016;12:1615-1622.
doi pubmed - Whiting P, Rutjes AW, Reitsma JB, Bossuyt PM, Kleijnen J. The development of QUADAS: a tool for the quality assessment of studies of diagnostic accuracy included in systematic reviews. BMC Med Res Methodol. 2003;3:25.
doi pubmed - Zamora J, Abraira V, Muriel A, Khan K, Coomarasamy A. Meta-DiSc: a software for meta-analysis of test accuracy data. BMC Med Res Methodol. 2006;6:31.
doi pubmed - Moses LE, Shapiro D, Littenberg B. Combining independent studies of a diagnostic test into a summary ROC curve: data-analytic approaches and some additional considerations. Stat Med. 1993;12(14):1293-1316.
doi pubmed - Leong SS, Wong JHD, Md Shah MN, Vijayananthan A, Jalalonmuhali M, Ng KH. Shear wave elastography in the evaluation of renal parenchymal stiffness in patients with chronic kidney disease. Br J Radiol. 2018;91(1089):20180235.
doi pubmed - Radulescu D, Peride I, Petcu LC, Niculae A, Checherita IA. Supersonic shear wave ultrasonography for assessing tissue stiffness in native kidney. Ultrasound Med Biol. 2018;44(12):2556-2568.
doi pubmed - Samir AE, Allegretti AS, Zhu Q, Dhyani M, Anvari A, Sullivan DA, Trottier CA, et al. Shear wave elastography in chronic kidney disease: a pilot experience in native kidneys. BMC Nephrol. 2015;16:119.
doi pubmed - Yang X, Hou FL, Zhao C, Jiang CY, Li XM, Yu N. The role of real-time shear wave elastography in the diagnosis of idiopathic nephrotic syndrome and evaluation of the curative effect. Abdom Radiol (NY). 2020;45(8):2508-2517.
doi pubmed - Turgutalp K, Balci Y, Ozer C, Bardak S, Gurses I, Karabulut Y, Helvaci I, et al. Shear wave elastography findings in Immunoglobulin A Nephropathy patients: is it more specific and sensitive for interstitial fibrosis or interstitial fibrosis/tubular atrophy? Ren Fail. 2020;42(1):590-599.
doi pubmed - Grosu I, Bob F, Sporea I, Popescu A, Sirli R, Schiller A. Two-Dimensional Shear-Wave Elastography for Kidney Stiffness Assessment. Ultrasound Q. 2019;37(2):144-148.
doi pubmed - Fu J, Wu B, Wu H, Lin F, Deng W. Accuracy of real-time shear wave elastography in staging hepatic fibrosis: a meta-analysis. BMC Med Imaging. 2020;20(1):16.
doi pubmed - Bohle A, Mackensen-Haen S, von Gise H. Significance of tubulointerstitial changes in the renal cortex for the excretory function and concentration ability of the kidney: a morphometric contribution. Am J Nephrol. 1987;7(6):421-433.
doi pubmed - Eddy AA. Experimental insights into the tubulointerstitial disease accompanying primary glomerular lesions. J Am Soc Nephrol. 1994;5(6):1273-1287.
doi pubmed - Hewitson TD. Fibrosis in the kidney: is a problem shared a problem halved? Fibrogenesis Tissue Repair. 2012;5(Suppl 1):S14.
doi pubmed - Wang L, Xia P, Lv K, Han J, Dai Q, Li XM, Chen LM, et al. Assessment of renal tissue elasticity by acoustic radiation force impulse quantification with histopathological correlation: preliminary experience in chronic kidney disease. Eur Radiol. 2014;24(7):1694-1699.
doi pubmed - Gennisson JL, Grenier N, Combe C, Tanter M. Supersonic shear wave elastography of in vivo pig kidney: influence of blood pressure, urinary pressure and tissue anisotropy. Ultrasound Med Biol. 2012;38(9):1559-1567.
doi pubmed - Islamoglu MS, Durak H, Gulcicek S, et al. Noninvasive assessment of renal fibrosis by shear wave elastography. Nephrology Dialysis Transplantation. 2015;30(suppl_3):iii166.
doi - Jaeschke R, Guyatt GH, Sackett DL. Users' guides to the medical literature. III. How to use an article about a diagnostic test. B. What are the results and will they help me in caring for my patients? The Evidence-Based Medicine Working Group. JAMA. 1994;271(9):703-707.
doi pubmed - Ge X, Lan ZK, Chen J, Zhu SY. Effectiveness of contrast-enhanced ultrasound for detecting the staging and grading of bladder cancer: a systematic review and meta-analysis. Med Ultrason. 2021;23(1):29-35.
doi pubmed - Sia CSM, Leong LCY, Wong ETY, Goh GH, Leo CCH. Empagliflozin-induced severe osmotic nephrosis and acute renal injury in advanced chronic kidney disease. Ann Acad Med Singap. 2021;50(3):255-257.
doi pubmed - Gupta VG, Kumar S, Singh SK, Lal A, Kakkar N. Contrast enhanced ultrasound in urothelial carcinoma of urinary bladder: An underutilized staging and grading modality. Cent European J Urol. 2016;69(4):360-365.
doi - Caruso G, Salvaggio G, Campisi A, Melloni D, Midiri M, Bertolotto M, Lagalla R. Bladder tumor staging: comparison of contrast-enhanced and gray-scale ultrasound. AJR Am J Roentgenol. 2010;194(1):151-156.
doi pubmed - Drudi FM, Di Leo N, Malpassini F, Antonini F, Corongiu E, Iori F. CEUS in the differentiation between low and high-grade bladder carcinoma. J Ultrasound. 2012;15(4):247-251.
doi pubmed
This article is distributed under the terms of the Creative Commons Attribution Non-Commercial 4.0 International License, which permits unrestricted non-commercial use, distribution, and reproduction in any medium, provided the original work is properly cited.
Journal of Clinical Medicine Research is published by Elmer Press Inc.