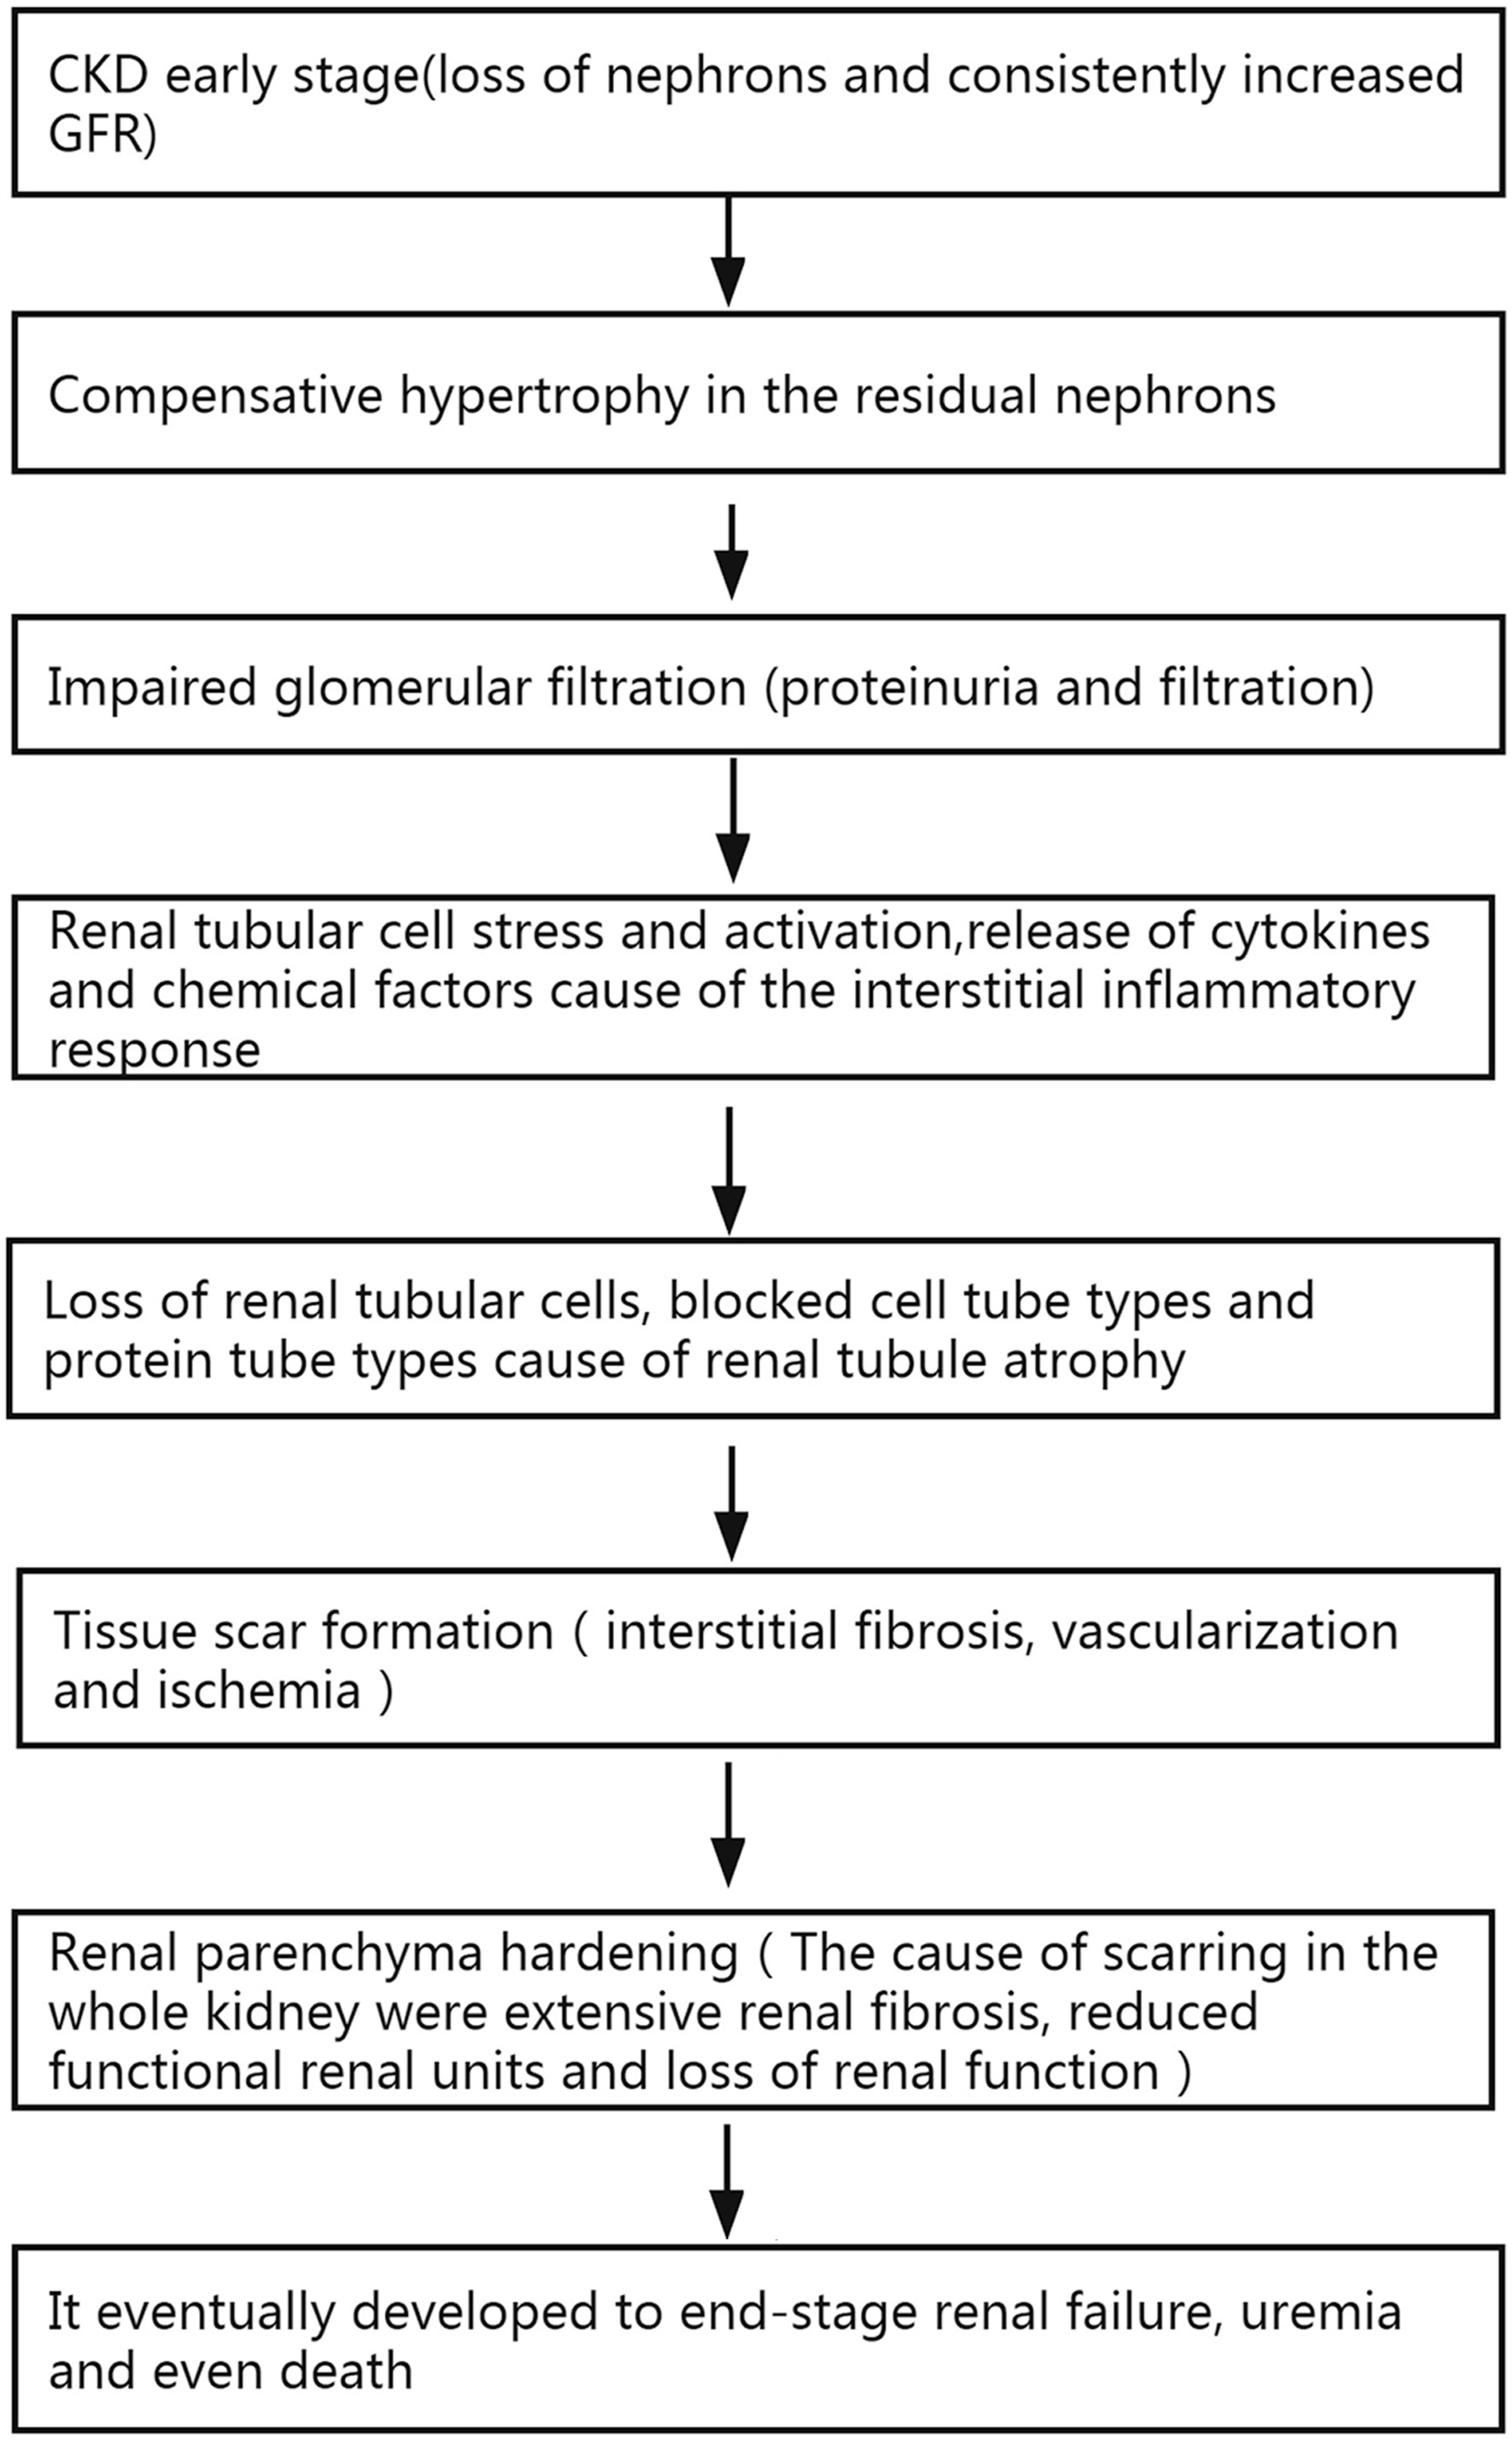
Figure 1. Relationship or mechanisms between renal parenchyma stiffness, fibrosis, impaired renal function, and mortality. CKD: chronic kidney disease; GFR: glomerular filtration rate.
| Journal of Clinical Medicine Research, ISSN 1918-3003 print, 1918-3011 online, Open Access |
| Article copyright, the authors; Journal compilation copyright, J Clin Med Res and Elmer Press Inc |
| Journal website https://www.jocmr.org |
Original Article
Volume 14, Number 2, February 2022, pages 95-105
Shear Wave Elastography in the Evaluation of Renal Parenchymal Stiffness in Patients With Chronic Kidney Disease: A Meta-Analysis
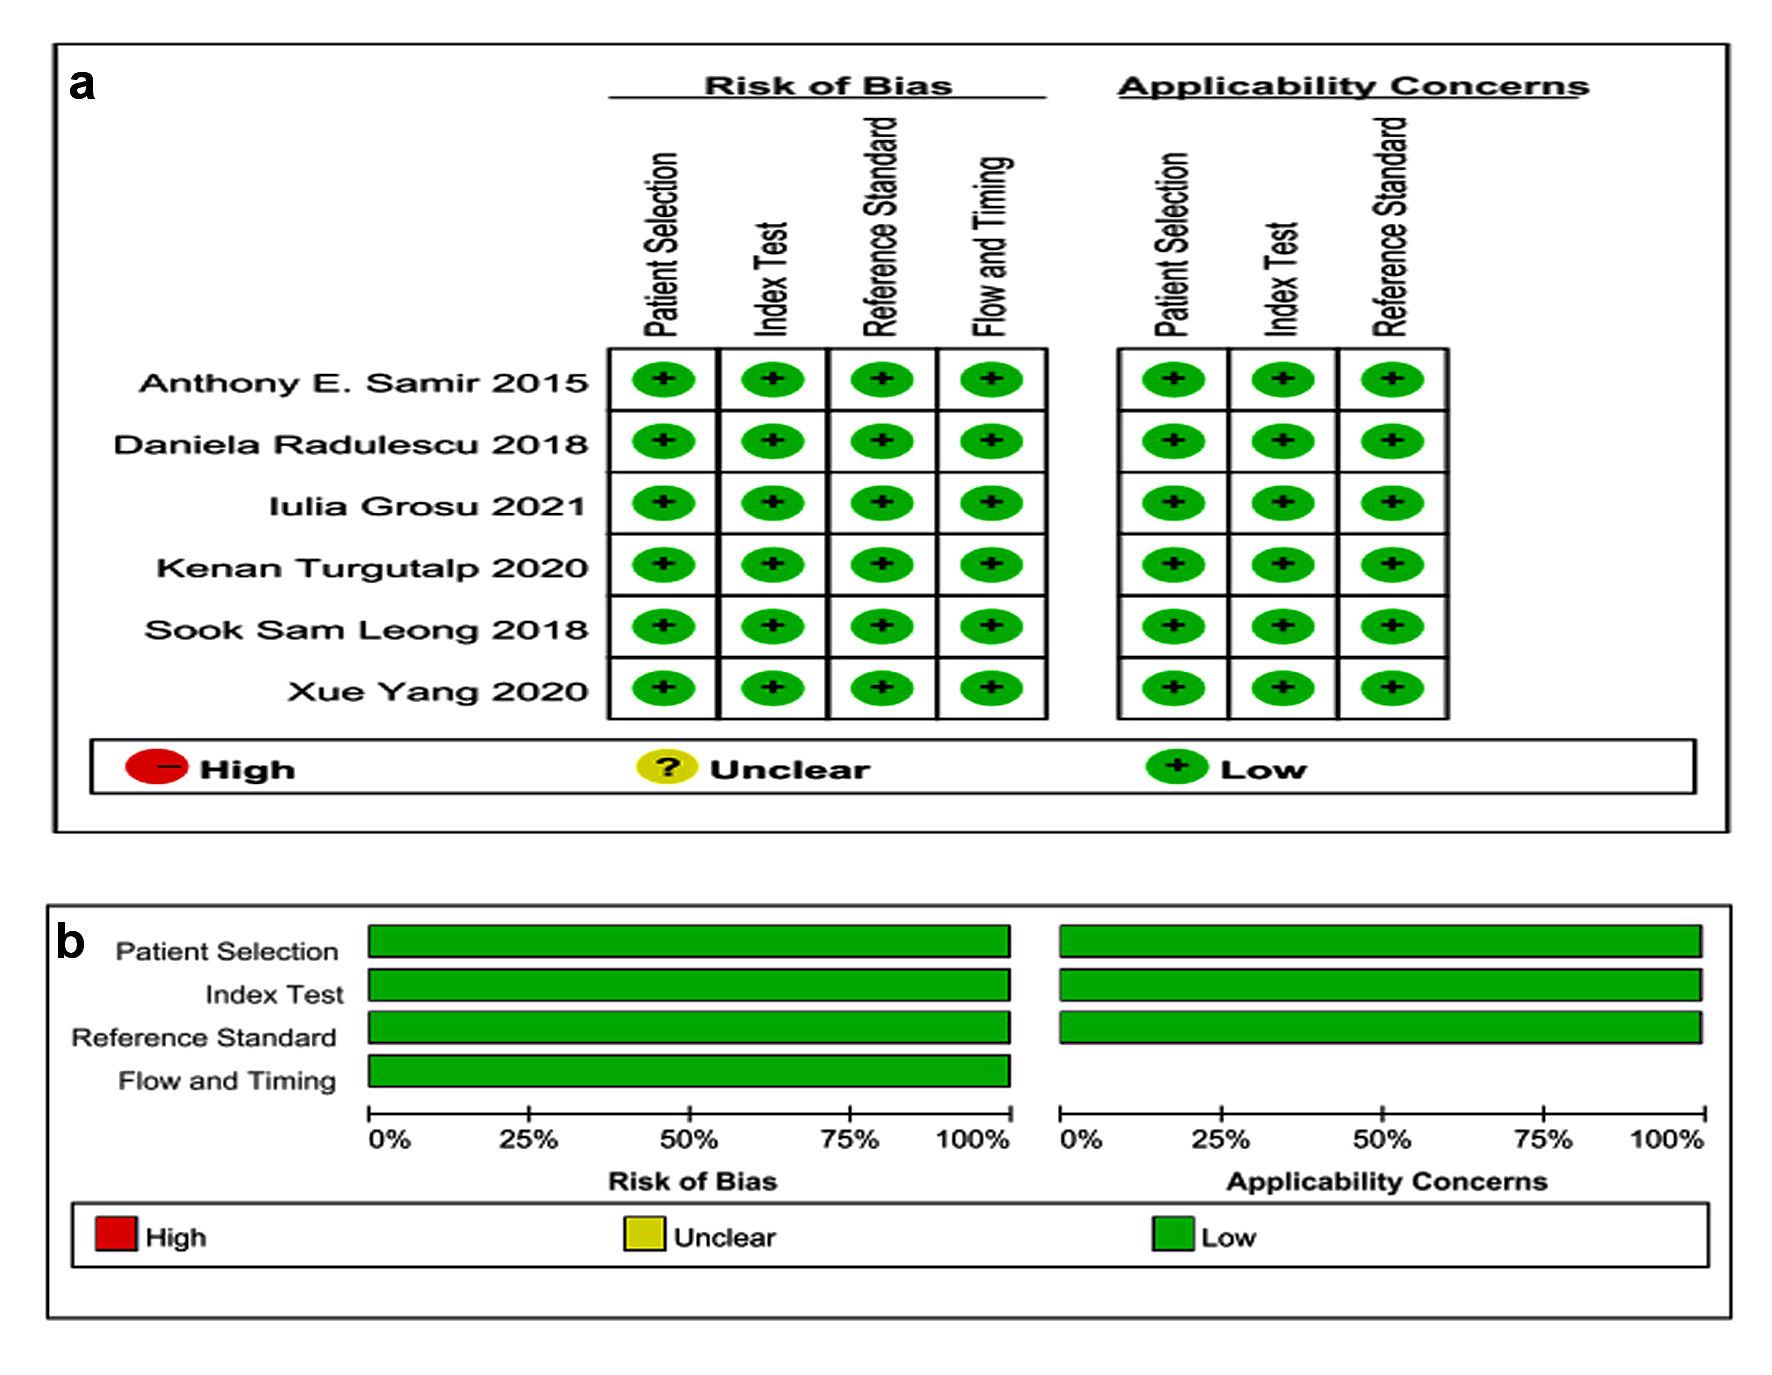
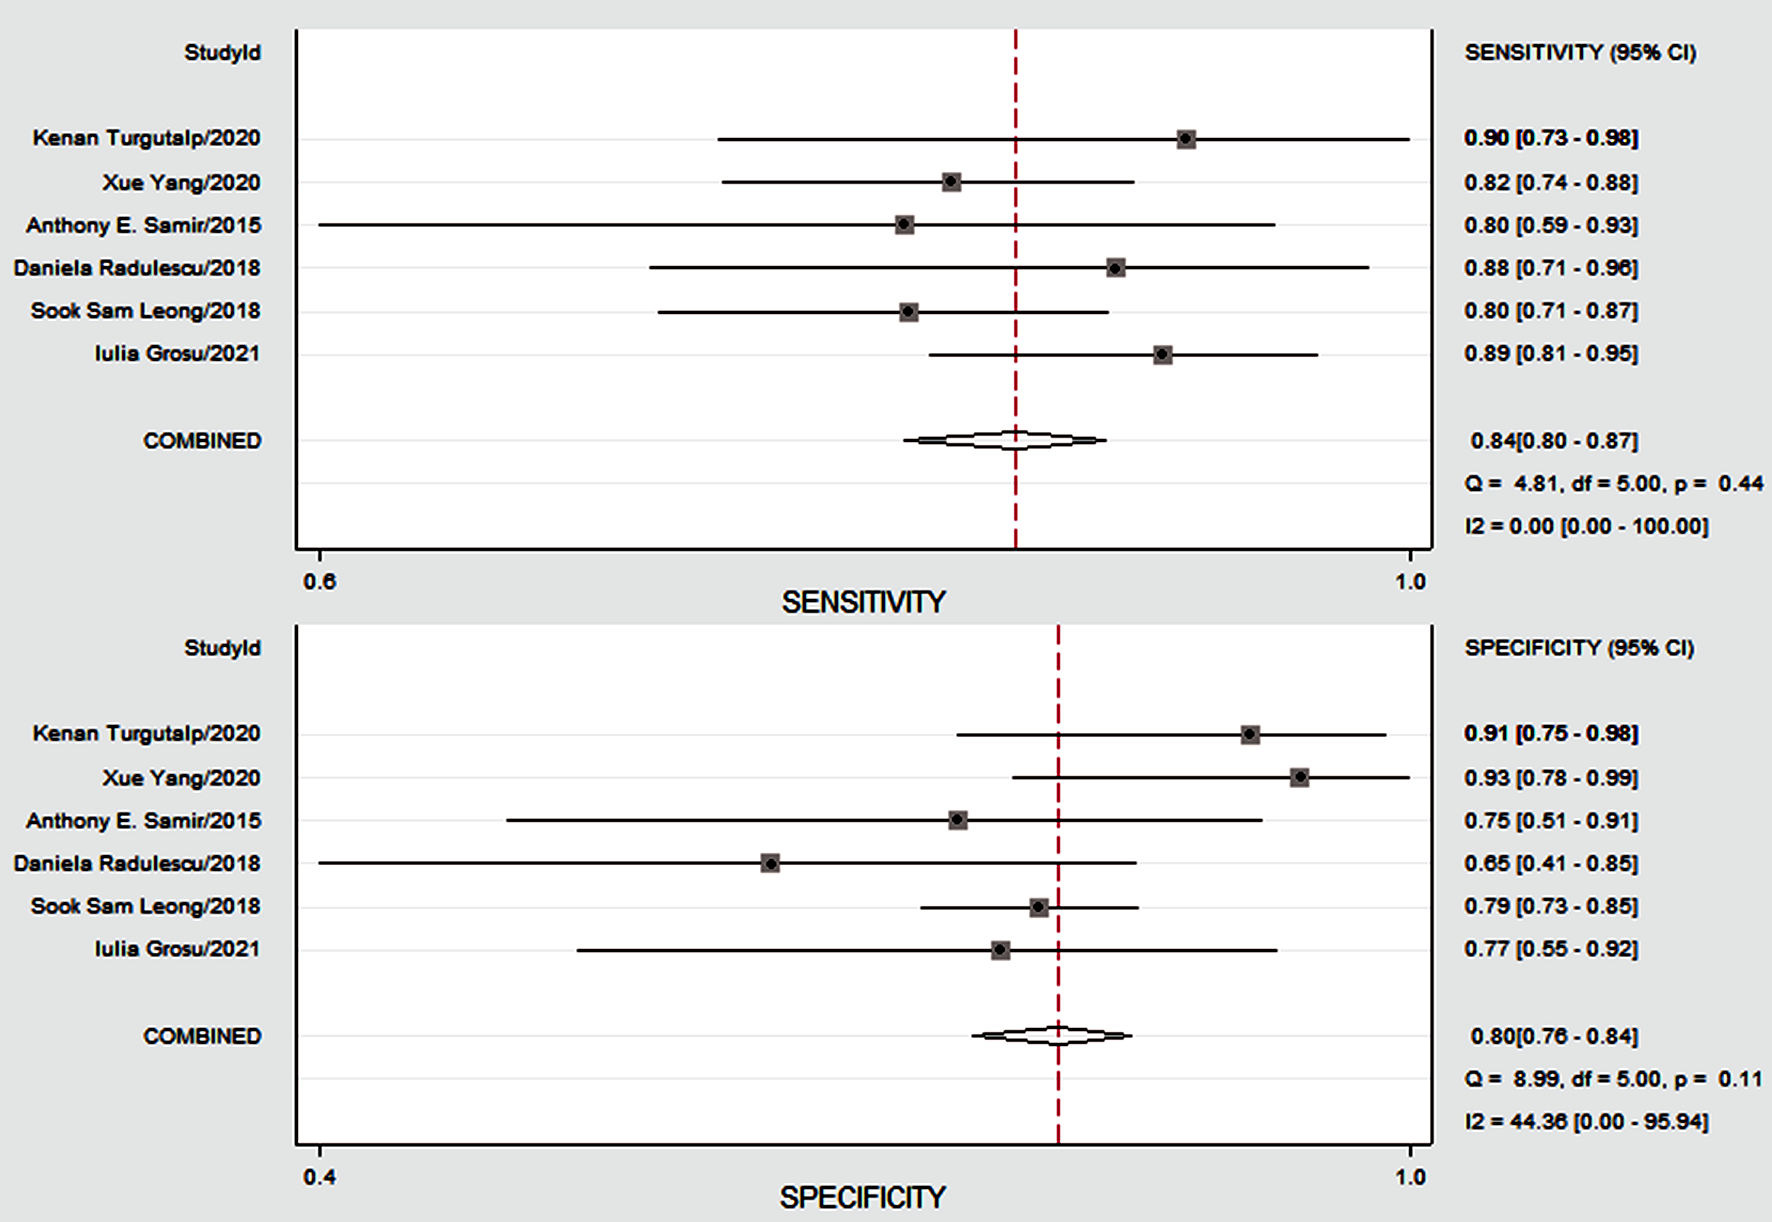
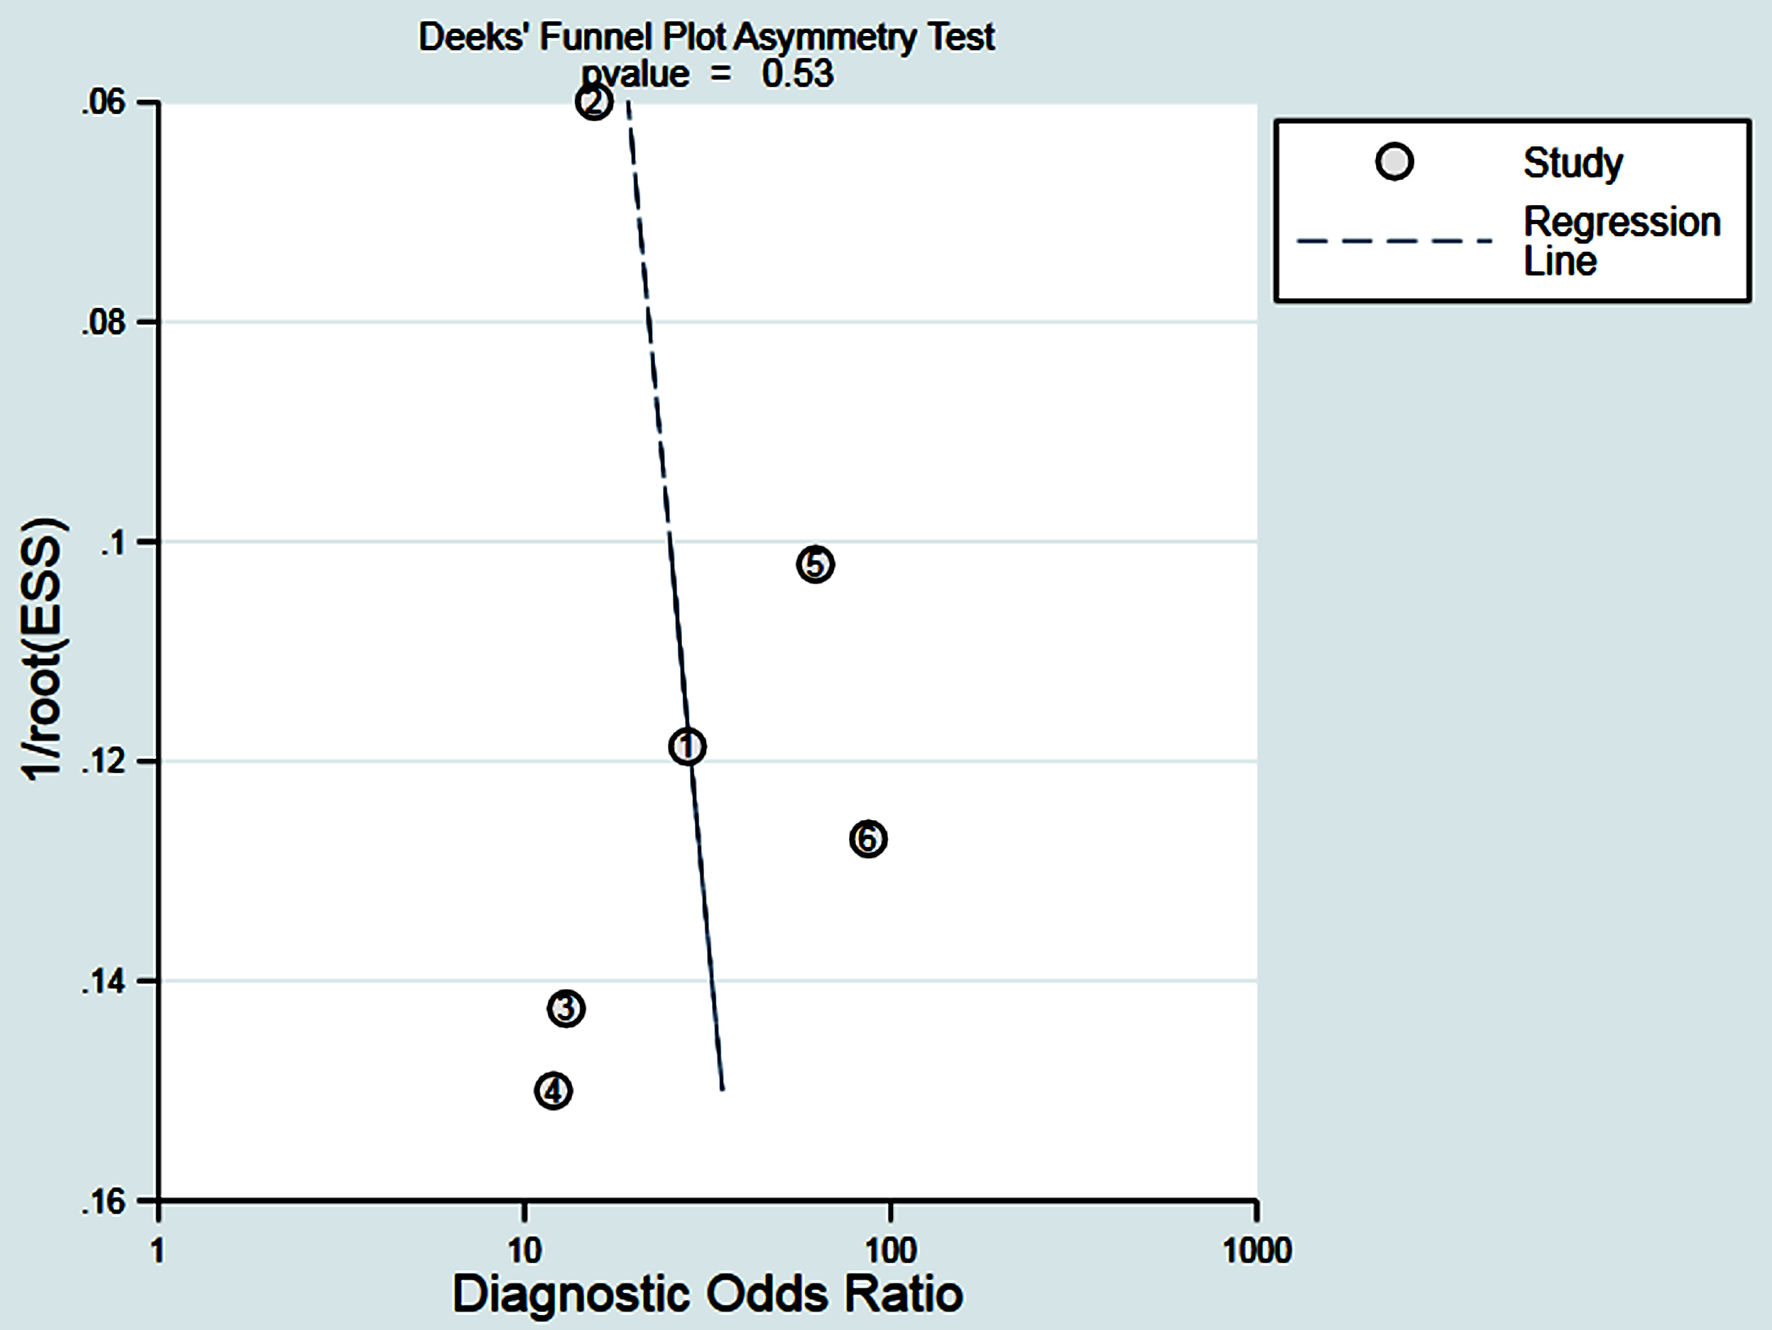
Figures
Tables
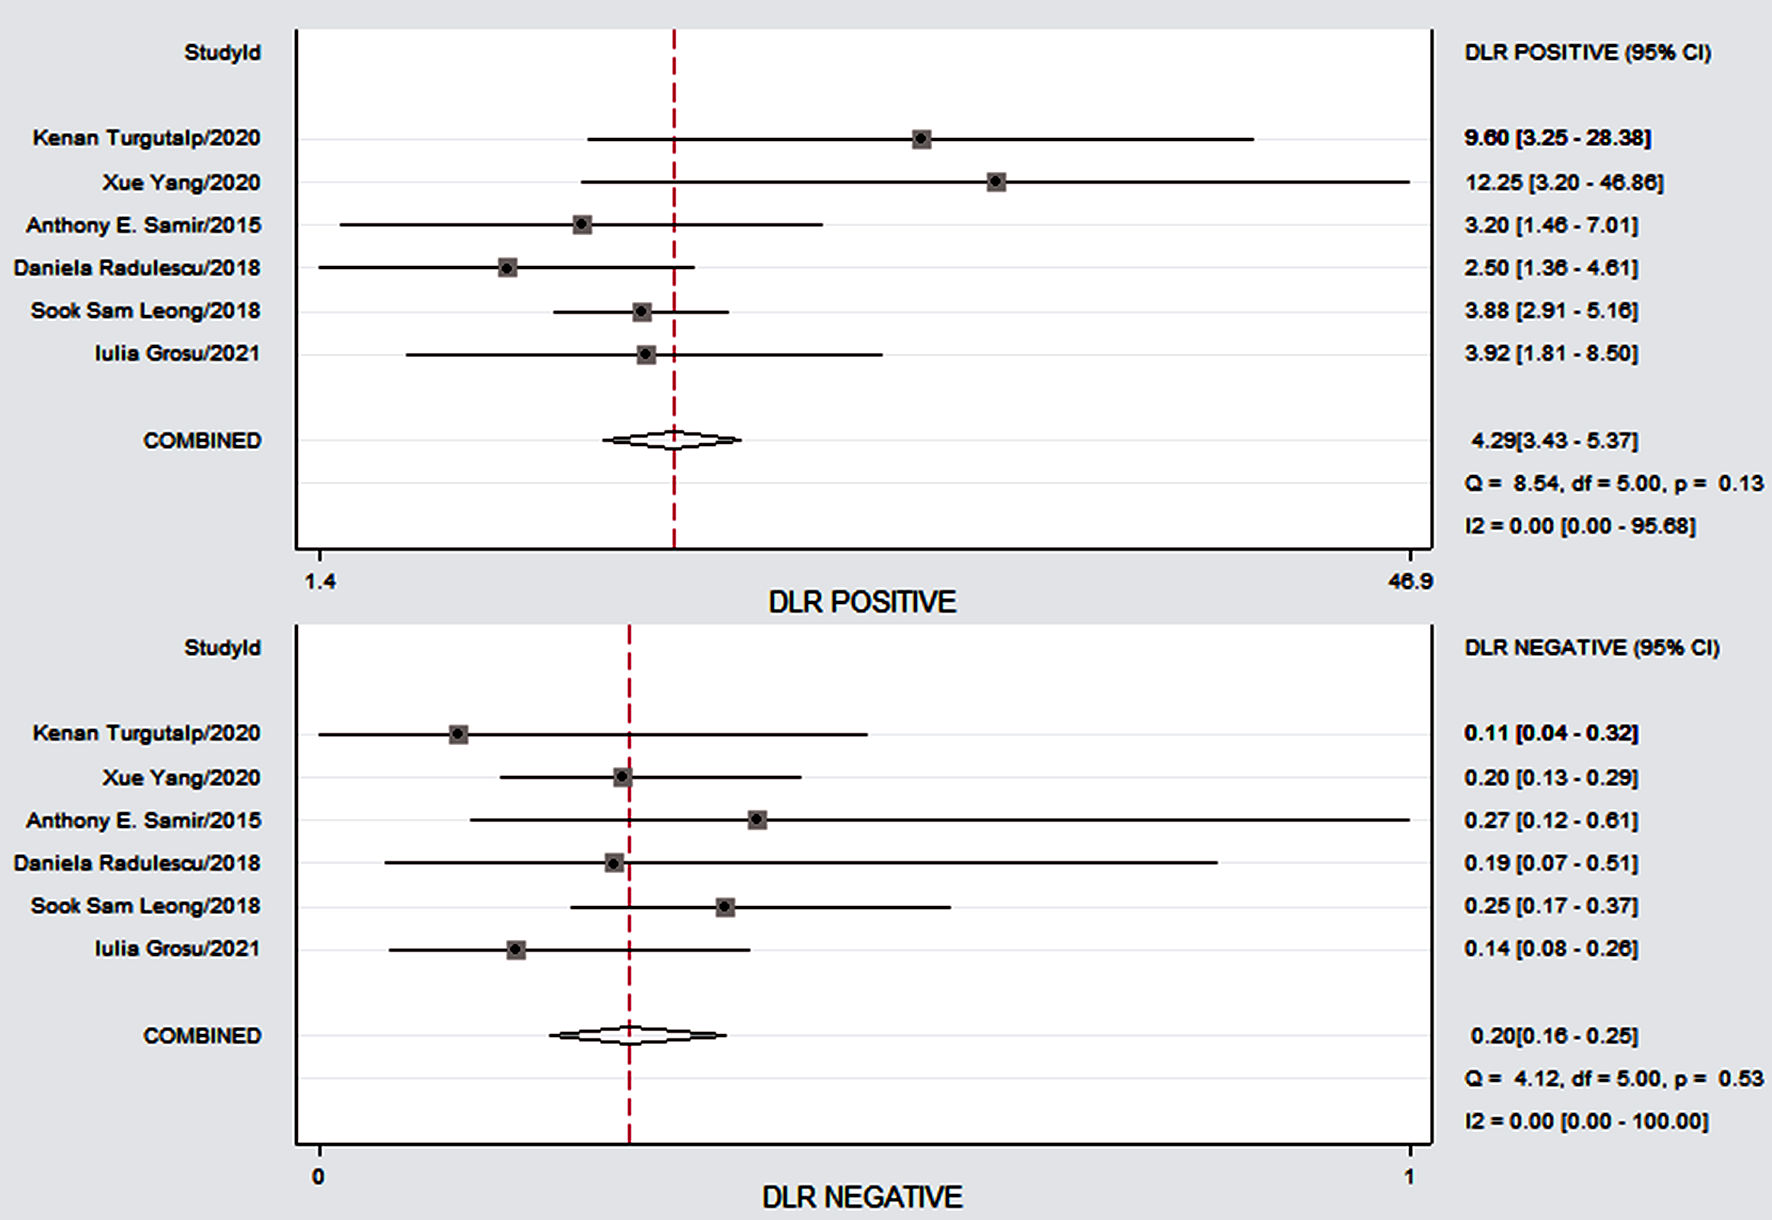
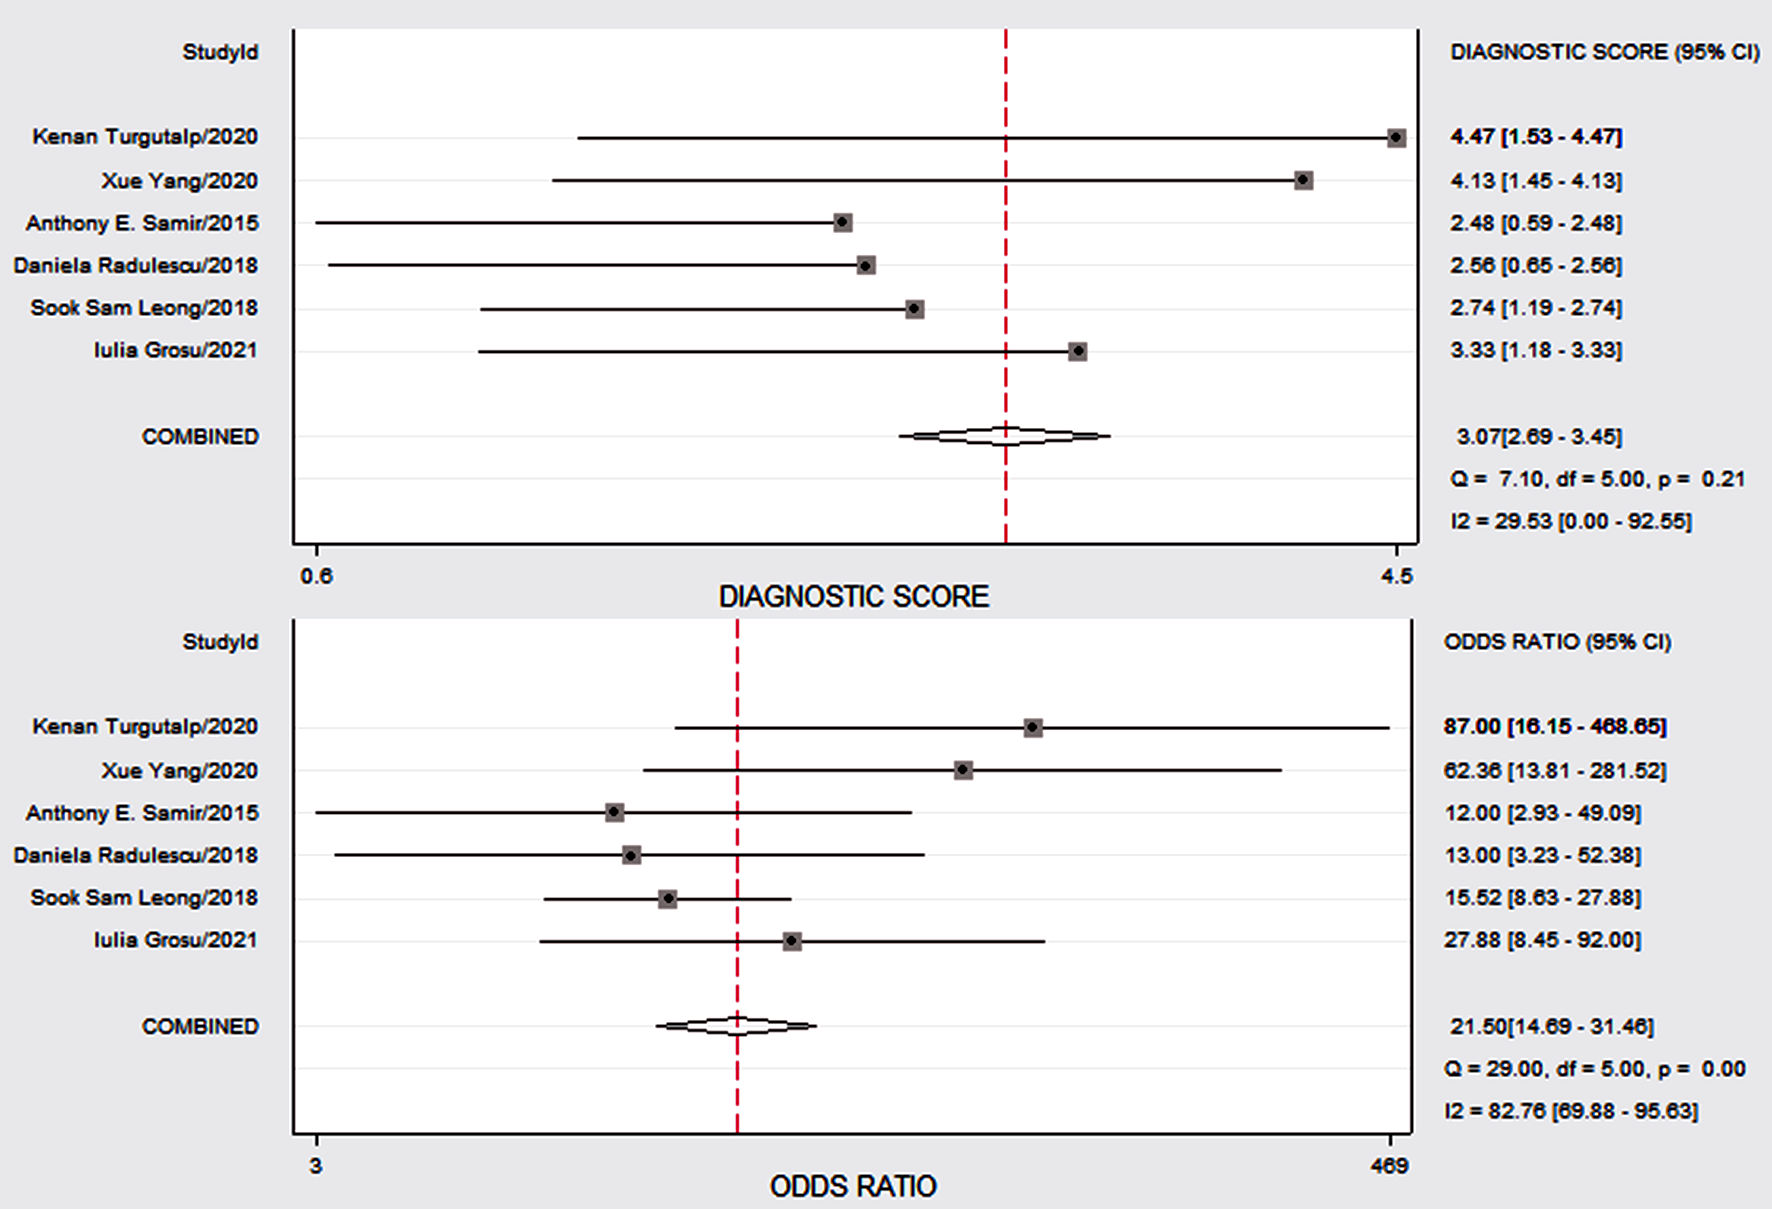
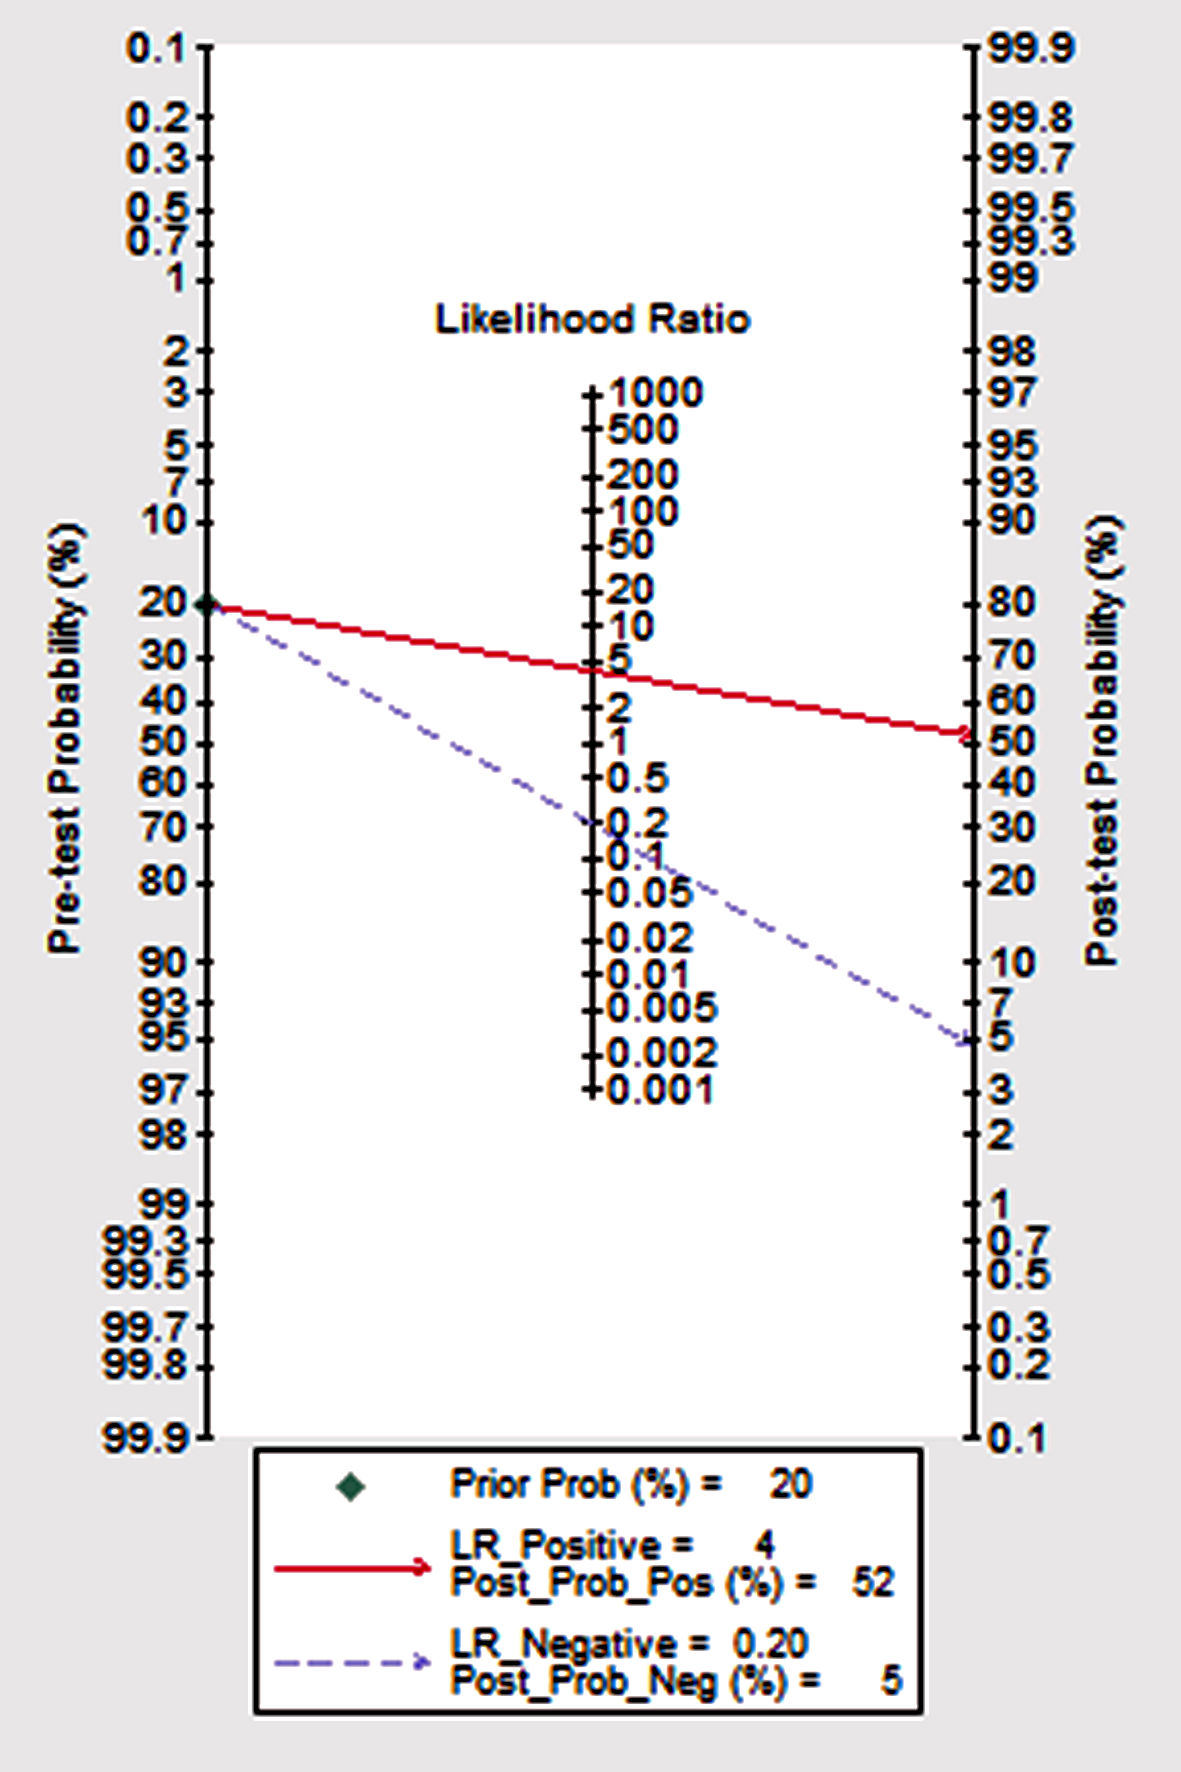
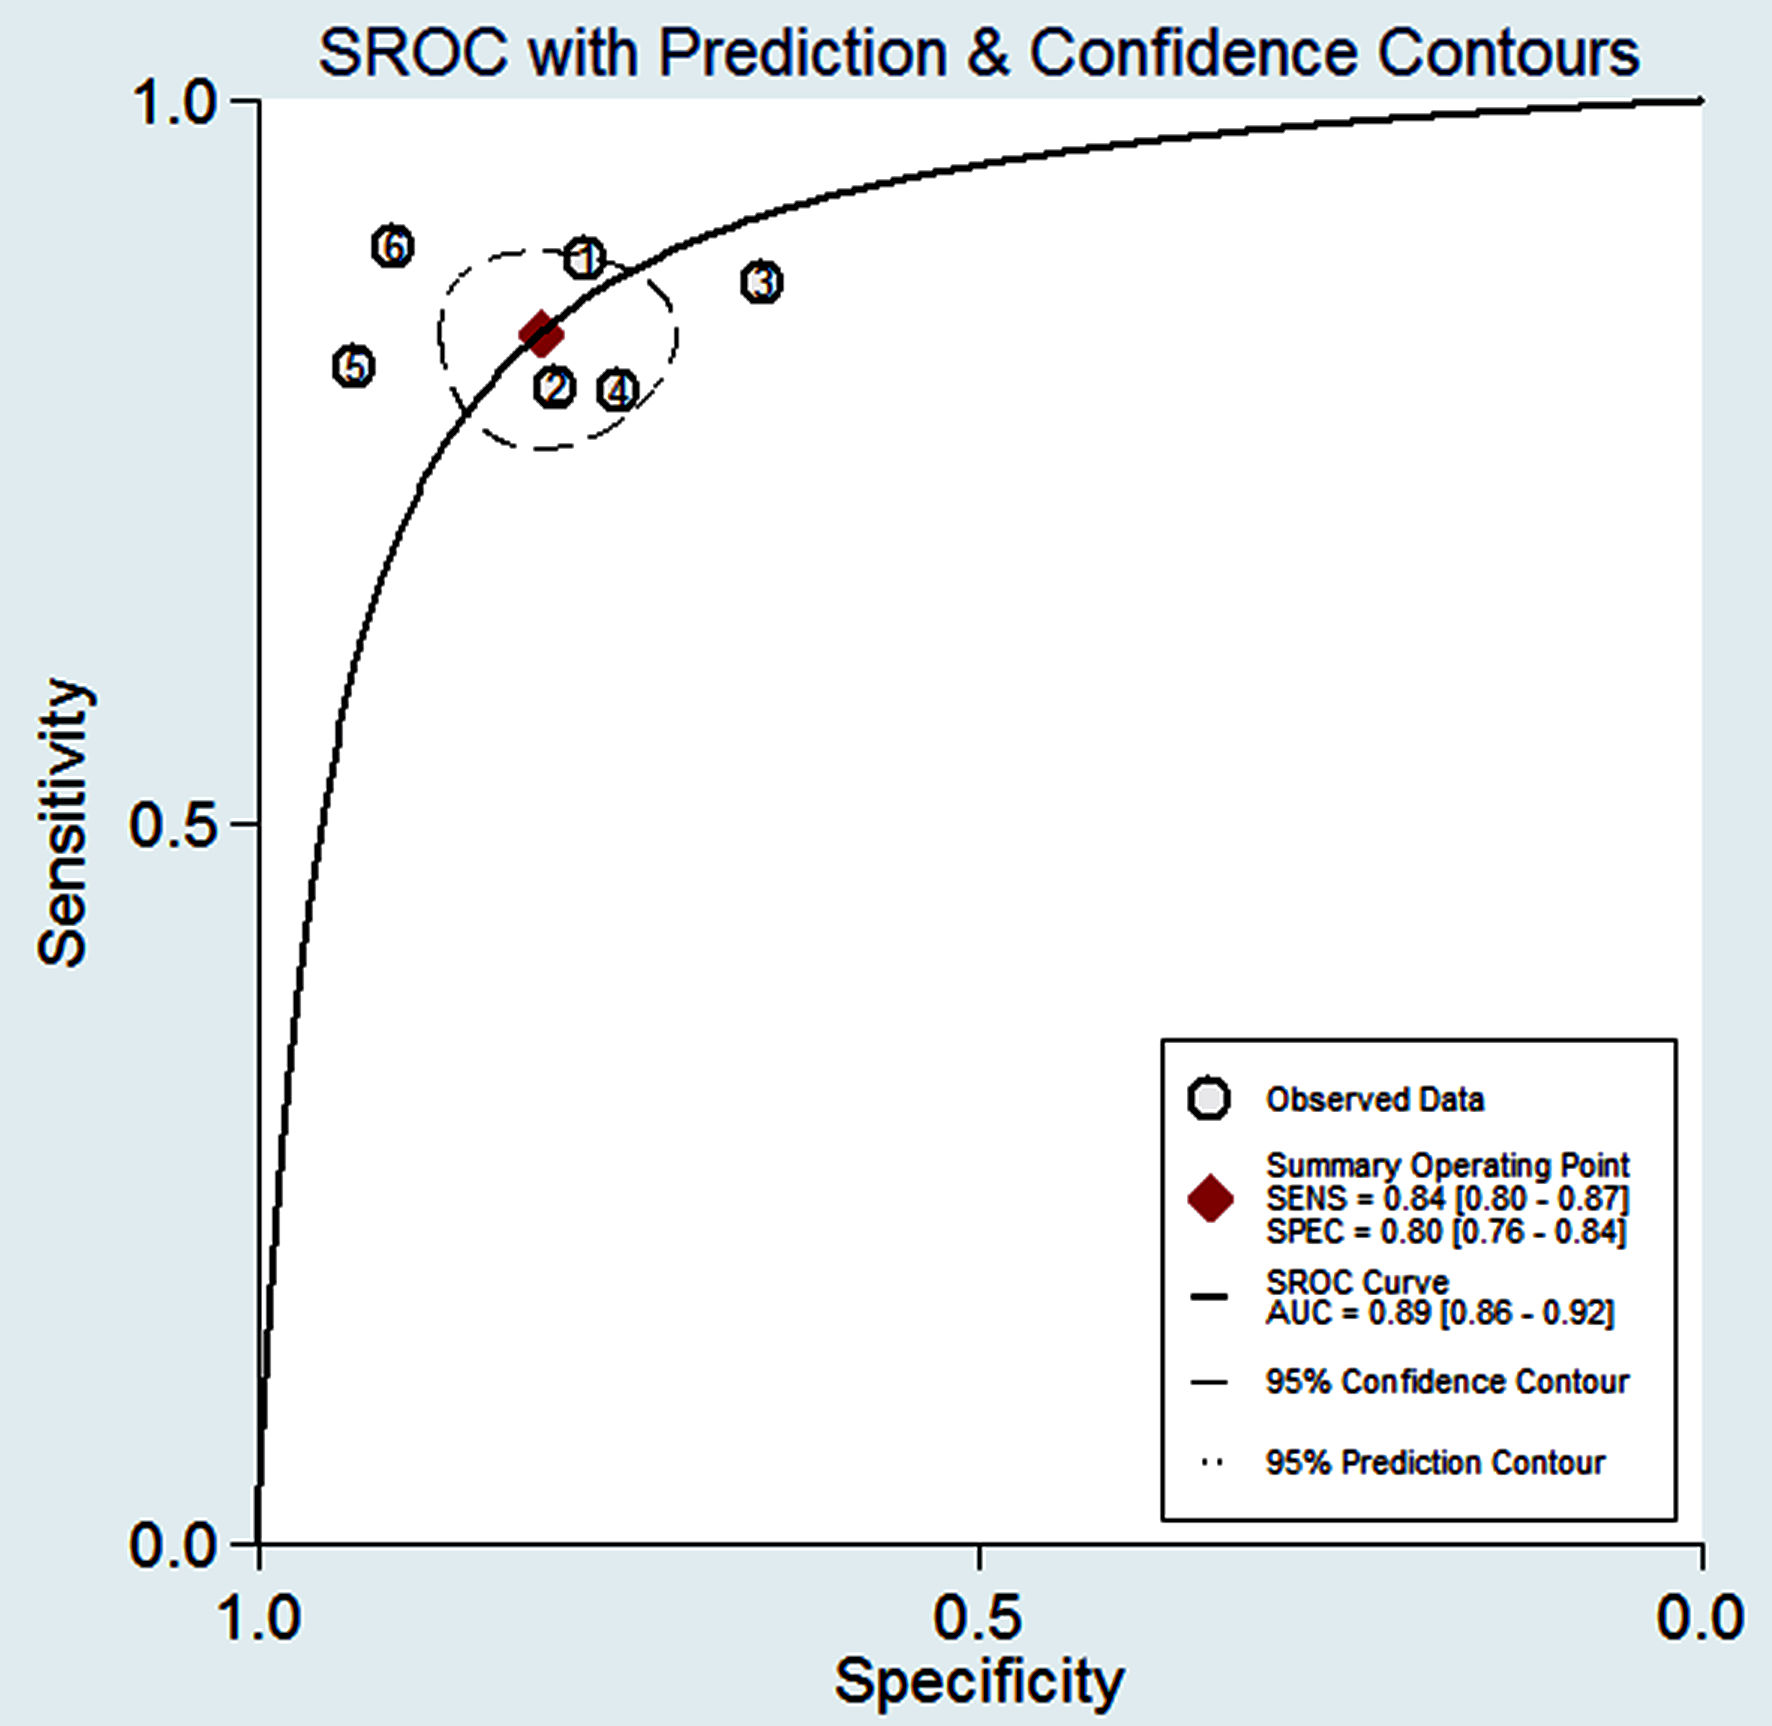
| Studies included | Country | Averaged age (range) | Sample size | Etiology | Sensitivity | Specificity |
|---|---|---|---|---|---|---|
| CKD: chronic kidney disease. | ||||||
| Leong et al, 2018 [18] | Malaysia | 55 | 106 | Chronic kidney disease | 0.803 | 0.795 |
| Radulescu et al, 2018 [19] | Romania | 62.875 (48 - 79) | 32 | Chronic kidney disease | 0.875 | 0.65 |
| Samir et al, 2015 [20] | America | 61 (56 - 70) | 25 | Chronic kidney disease | 0.80 | 0.75 |
| Yang et al, 2020 [21] | China | 46.9 (23.0 - 68.0) | 120 | INS disease | 0.817 | 0.933 |
| Turgutalp et al, 2020 [22] | Turkey | 40.2 ± 11.3 | 30 | IgAN disease | 0.890 | 0.900 |
| Grosu et al, 2021 [23] | Romania | 57.5 ± 13.4 | 92 | Chronic kidney disease | 0.892 | 0.769 |
| Etiology | SWE | Studies included |
|---|---|---|
| SWE: shear wave elastography; INS: idiopathic nephrotic syndrome; IgAN: immunoglobulin A nephropathy; SWV: shear wave velocity; kPa: kilopascals. | ||
| Chronic kidney disease | YM = 4.31 kPa | Leong et al, 2018 [18] |
| Chronic kidney disease | YM = 22.95 kPa | Radulescu et al, 2018 [19] |
| Chronic kidney disease | YM = 5.3 kPa | Samir et al, 2015 [20] |
| INS disease | YM = 7.96kPa | Yang et al, 2020 [21] |
| IgAN disease | YM > 15 kPa | Turgutalp et al, 2020 [22] |
| Chronic kidney disease | SWV < 1.47 m/s | Grosu et al, 2021 [23] |