

| Journal of Clinical Medicine Research, ISSN 1918-3003 print, 1918-3011 online, Open Access |
| Article copyright, the authors; Journal compilation copyright, J Clin Med Res and Elmer Press Inc |
| Journal website https://www.jocmr.org |
Original Article
Volume 13, Number 7, July 2021, pages 387-391

Body Muscle-to-Fat Ratio, Rather Than Fat-to-Muscle Ratio, Significantly Correlates With Measured Insulin Resistance in Patients With Type 2 Diabetes Mellitus
Noboru Kurinamia, b, e, Seigo Sugiyamaa, c, e, Akira Yoshidaa, Kunio Hieshimaa, Fumio Miyamotoa, Keizo Kajiwaraa, Katsunori Jinnoucha, Tomio Jinnouchia, Masatoshi Nomurab, Hideaki Jinnouchia, d, f
aDiabetes Care Center, Jinnouchi Hospital, Kumamoto, Japan
bDivision of Endocrinology and Metabolism, Department of Internal Medicine, Kurume University School of Medicine, Kurume, Japan
cDivision of Cardiovascular Medicine, Diabetes Care Center, Jinnouchi Hospital, Kumamoto, Japan
dDivision of Preventive Cardiology, Department of Cardiovascular Medicine, Kumamoto University Hospital, Kumamoto, Japan
eNoboru Kurinami and Seigo Sugiyama contributed equally to the present study.
fCorresponding Author: Hideaki Jinnouchi, Jinnouchi Hospital, 6-2-3 Kuhonji, Chuo-ku, Kumamoto 862-0976, Japan
Manuscript submitted December 1, 2020, accepted July 7, 2021, published online July 28, 2021
Short title: BMFR Is a Superior Insulin Resistance Index
doi: https://doi.org/10.14740/jocmr4401
| Abstract | ▴Top |
Background: Insulin resistance (IR) assessment is important in treating type 2 diabetes mellitus (T2DM). We thus compared body muscle-to-fat ratio (BMFR) and fat-to-muscle ratio (FMR) values against M/I values as clinical index of IR.
Methods: Subject included 118 untreated T2DM patients. Hyperinsulinemic-euglycemic clamp examination was performed to calculate the M/I as index of IR. Body composition was measured by impedance analysis using InBody770.
Results: Simple linear regression analyses confirmed correlations between M/I and BMFR (B: 0.756 (P < 0.01), coefficients of determination (R2): 0.572, mean absolute error (MAE): 3.19, and root mean squared error (RMSE): 4.14), and between M/I and FMR (B: -0.601 (P < 0.01), R2: 0.362, MAE: 3.97, and RMSE: 5.05). Against the M/I values, BMFR also showed better goodness-of-fit than did FMR. In comparing correlation coefficients, the BMFR absolute B value was significantly larger than that of FMR (P = 0.027).
Conclusions: BMFR is more useful than FMR in quantifying IR in patients with T2DM because the correlation between BMFR and the insulin sensitivity index M/I is significantly greater than that between FMR and M/I.
Keywords: Diabetes mellitus; Insulin resistance; Obesity; Body muscle-to-fat ratio; Fat-to-muscle ratio; Hyperinsulinemic-euglycemic clamp
| Introduction | ▴Top |
Insulin resistance (IR) is a critical factor in managing type 2 diabetes mellitus (T2DM), and should be individually assessed in each patient with T2DM. Hyperinsulinemic-euglycemic clamp examination, the gold standard for assessing IR, provides us an clinical index of IR as glucose infusion rate (M value) divided by steady-state serum insulin (I) value (M/I values). We previously reported a strong correlation between IR and body muscle-to-fat ratio (BMFR; muscle mass (kg)/fat mass (kg)) [1, 2]. Because skeletal muscle loss and body fat accumulation affect IR, the combination of muscle and fat is attracting wider attention as a clinical index. The fat-to-muscle ratio (FMR; fat mass (kg)/muscle mass (kg)), which is the reciprocal value of BMFR, is reportedly useful in diagnosing metabolic syndrome with IR in otherwise healthy people [3, 4]. In contrast, IR is known to improve after starting treatment for DM, including metformin [5], thiazolidine [6], and sodium-glucose cotransporter-2 (SGLT2) inhibitors [7]. We hypothesized that BMFR (rather than FMR) could more accurately indicate IR in patients with untreated T2DM. We thus compared BMFR and FMR values against M/I values.
| Materials and Methods | ▴Top |
Subjects and protocol
Patients with untreated T2DM who visited the Diabetes Care Center at Jinnouchi Hospital between June 2014 and August 2019 were enrolled. Those who had already been treated for diabetes, severe uncontrolled diabetes, diabetic ketoacidosis that needed immediate insulin treatment, or uncontrolled severe hypertension, and those who could not remain standing to have an elementary body composition tests, were excluded. The study was conducted in accordance with the Declaration of Helsinki. The study protocol was approved by the Human Ethics Review Committee of Jinnouchi Hospital (2020-2-1; UMIN protocol registration ID: UMIN000039857).
Hyperinsulinemic-euglycemic clamp
Insulin sensitivity was evaluated using a hyperinsulinemic-euglycemic clamp with an artificial pancreas (Nikkiso STG-55, Tokyo, Japan), as reported previously [1, 2]. Insulin was administered as an intravenous loading dose (starting from 4.77 mU/kg/min that was gradually decreased to 1.67 mU/kg/min; under these conditions, the estimated plasma insulin concentration was about 100 mU/L) over 10 min followed by a continuous infusion at 1.5 mU/kg/min for 120 min. Plasma glucose concentrations were maintained at 5.5 mmol/L using a variable infusion of 10% glucose. Blood insulin concentration at steady state was measured when the hyperinsulinemic-euglycemic clamp examination was terminated (I value). Because of variations in the insulin clearance rate for each patient, the actual blood insulin concentrations during the hyperinsulinemic-euglycemic clamp test were different from the calculated insulin levels [8]. To correct for the effect of the variability in insulin concentrations among individual patients, we used the M/I value as an index of insulin sensitivity, which was a value calculated by dividing the M value by the steady-state serum insulin value (I) in this study. This value indicates glucose use per 1 unit of blood insulin and is a good index that represents tissue insulin sensitivity, which reflects whole-body insulin resistance [9].
Measurement of body fat and muscle composition
We measured body composition including body fat mass and body fat percentage using the same method as we described previously [10-13]. Elementary body composition was measured using a direct segmental multi-frequency bioelectrical impedance analyzer (InBody770; Biospace, Seoul, Korea), and we assessed total fat mass and body fat percentage. This analyzer processes 30 impedance measurements using six different frequencies (1, 5, 50, 250, 500, and 1,000 kHz) at each of five body segments (right arm, left arm, trunk, right leg, and left leg), and 15 reactance measurements using tetrapolar eight-point tactile electrodes using three different frequencies (5, 50, and 250 kHz), at each of the five above-mentioned body segments [14, 15]. We defined BMFR as body muscle mass divided by the fat mass, and FMR as body fat mass divided by muscle mass [3, 4].
Blood sampling and measurement of clinical parameters
Blood samples for HbA1c, fasting plasma glucose, fasting blood insulin, total cholesterol, low-density lipoprotein (LDL) cholesterol, high-density lipoprotein (HDL) cholesterol, triglycerides, and estimated glomerular filtration ratio (eGFR) were collected from the antecubital vein and analyzed at the Jinnouchi Hospital laboratory. Body weight (kg), height (cm), and waist circumference (cm) were measured in the standing position and body mass index (BMI; kg/m2) was calculated at the same time that body composition was measured.
Statistical analysis
The Shapiro-Wilk test was used to assess the normal distribution of continuous data. Data were expressed as the mean ± standard deviation (SD), whereas those with skewed distributions were expressed as the median value with the interquartile range (IQR). We performed simple linear regression analyses, and calculated and compared coefficients of correlation. We evaluated goodness-of-fit using coefficients of determination (R2), mean absolute error (MAE) and root mean squared error (RMSE). P < 0.05 (two-tailed) was considered significant. Statistical analyses were performed with SPSS ver. 23.0 (IBM Japan, Ltd, Tokyo, Japan).
| Results | ▴Top |
Subjects
We initially enrolled 122 patients with untreated T2DM, but excluded four patients (ketoacidosis: n = 2, uncontrolled hypertension: n = 1, unable to undergo InBody770 measurements: n = 1), for a final cohort of 118 patients. Table 1 shows the participants’ characteristics. All subjects had untreated T2DM and 66 patients (55.9%) demonstrated high levels of HbA1c > 8.4% (68 mmol/mol), and included 63 patients (53.3%) with obesity (BMI ≥ 25 kg2).
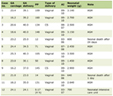 Click to view | Table 1. Background Clinical Characteristics of the Study Subjects (N = 118) |
Results of body composition analysis
Analysis of elementary body composition using InBody770 showed that the total muscle quantity was 45.9 ± 9.9 kg, total fat quantity was 19.1 kg (range, 13.2 - 25.9 kg), body fat percentage was 29.0±9.6%, skeletal muscle mass index (SMI) was 7.47 ± 1.23 kg/m2, BMFR was 2.62 (range, 1.75 - 3.26), and FMR was 0.38 (range, 0.30 - 0.54). Seventeen males (22.7%) and six females (14.0%) were diagnosed with sarcopenia by the Asian Working Group for Sarcopenia (AWGS) criteria [16].
Hyperinsulinemic-euglycemic clamp examination results
In the total population (n = 118), we measured M and M/I values by hyperinsulinemic-euglycemic clamp examination (M-value: 7.11 ± 2.89 mg/m2/min, M/I value: 8.14 mg/m2/min2/µIU·mL (range, 5.02 - 10.4 mg/m2/min2/µIU·mL)). Number of patients in the insulin resistance (M/I value < 9.0) was 58 (49.2%).
Simple linear regression analysis
Body muscle percentage (B = 0.71, P < 0.01) was significantly related to M/I (Fig. 1a); whereas fat percentage (B = -0.72, P < 0.01) was significantly negatively related to M/I (Fig. 1b). However, the linear fit of body fat percentage to M/I ratio was not good. The reciprocal approximation curve of body fat percentage (red, R2 = 0.61) fits was better than the approximate linear line of body fat percentage (black, R2 = 0.43).
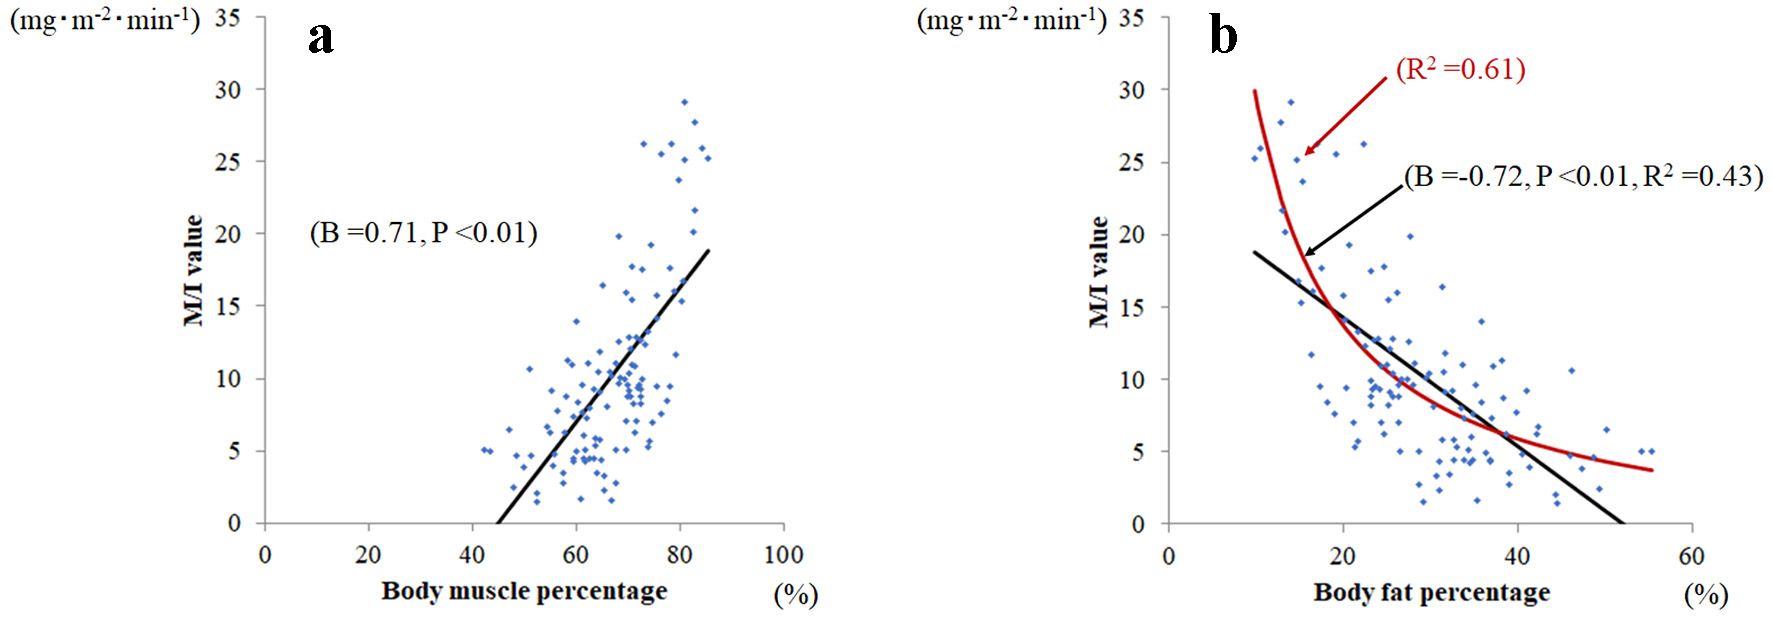 Click for large image | Figure 1. Relationship between body muscle percentage and body fat percentage and M/I. (a) Body muscle percentage was significantly related to M/I value (B = 0.71, P < 0.001), whereas (b) body fat percentage was significantly and negatively related to M/I (B = -0.72, P < 0.001). Among body fat percentages, the reciprocal approximation curve (red line; R2 = 0.61) fits better than the approximate line (black line; R2 = 0.43) against M/I values. |
Simple linear regression analyses confirmed correlations between M/I and BMFR (B: 0.756 (P < 0.01), R2: 0.572, MAE: 3.19, and RMSE: 4.14), and between M/I and FMR (B: -0.601 (P < 0.01), R2: 0.362, MAE: 3.97, and RMSE: 5.05; Fig. 2). Against the M/I values, BMFR also showed better goodness-of-fit than did FMR. In comparing correlation coefficients, the BMFR absolute B value was significantly larger than that of FMR (P = 0.027).
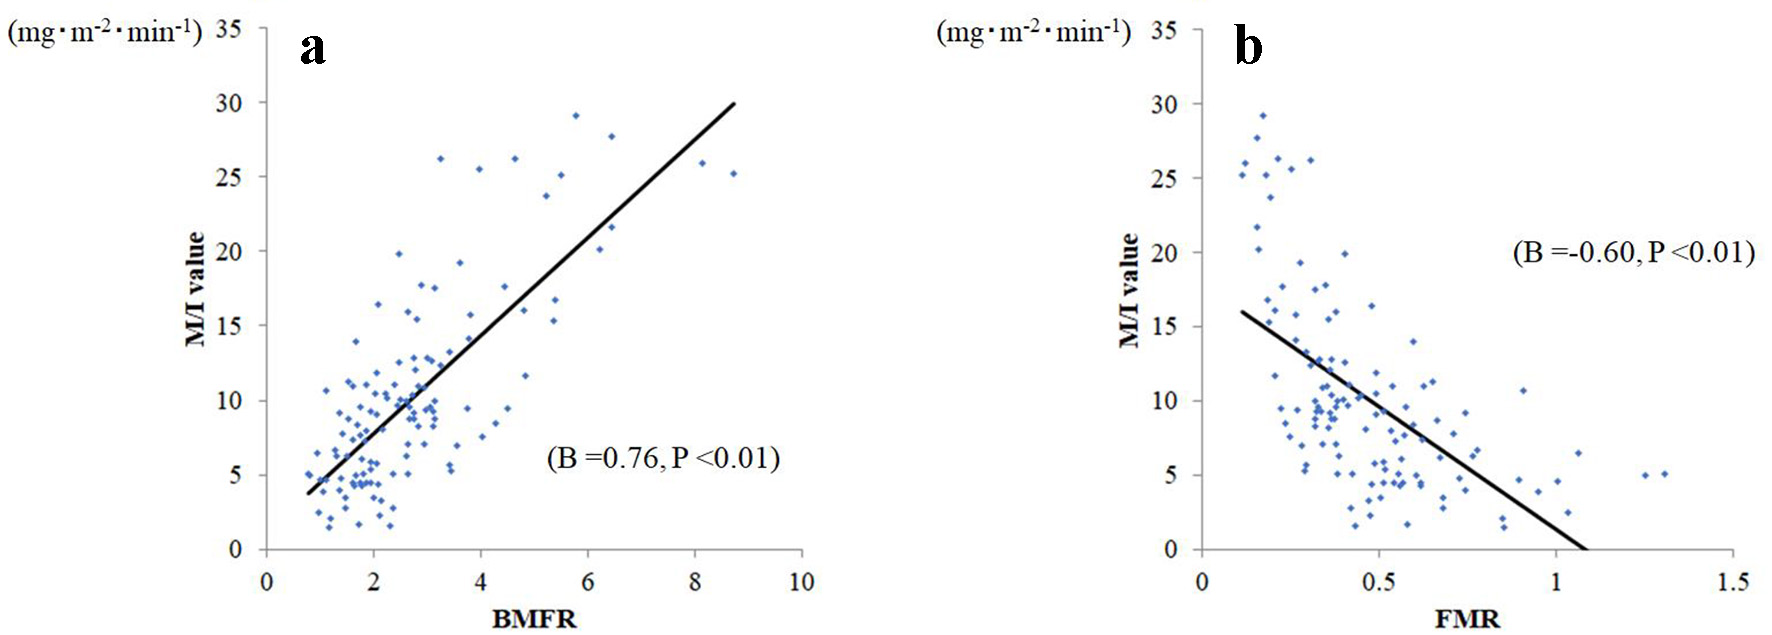 Click for large image | Figure 2. Relationship between body muscle-to-fat ratio (BMFR) and fat-to-muscle ratio (FMR) and M/I. (a) BMFR was significantly related to M/I (B = 0.76, P < 0.001), whereas (b) FMR was significantly and negatively related to M/I (B = -0.60, P < 0.001). |
To correct BMFR and FMR by weight to avoid the effects of dehydration, a simple regression sub-analysis of BMFR per body weight and FMR per body weight M/I values was performed. The correlation with M/I values was stronger for BMFR per weight (B = 0.78, P < 0.01) than for FMR per weight (B = 0.42, P < 0.01).
| Discussion | ▴Top |
The present study shows that the correlation between BMFR (as a combined body composition measurement index) and M/I (which is a definitive index of IR) is significantly stronger and closer than that between FMR and M/I.
Recent studies have suggested the potential usefulness in managing metabolic diseases of an index that combines muscle mass and fat mass [17, 18]. Previously, we reported that BMFR has a strong linear correlation with M/I [1, 2]. It is reported that T2DM is associated with increased risks of sarcopenia and pre-sarcopenia [19], and this study also included 23 patients (19.5 %) with sarcopenia. Further, 53.3% of the participants in this study were obese (BMI ≥ 25 kg/m2), and body muscle percentage is biased towards a lower range compared to healthy subjects. Therefore, BMFR, which has a wide range of numerical values, may be more suitable for quantitative evaluation of IR than FMR in T2DM patients. Other, in the relationship between the fat percentage and M/I, we first found that goodness-of-fit for the reciprocal approximation curve of fat percentage was better than the approximate line of fat percentage. The reciprocal values of fat percentage and muscle per body weight were positively correlated with M/I. Using these two positively correlated parameters, BMFR, which was obtained by multiplying the reciprocal values of fat percentage by muscle percentage (BMFR = (body muscle percentage: muscle mass × 100/body weight) × (reciprocal values of body fat percentage: body weight/fat mass × 100)) had a stronger linear regression correlation with M/I than did FMR.
This study has limitations. Subjects were relatively few, and were confined to Japanese patients with untreated T2DM. Nonetheless, simple assessment of IR using BMFR in healthy individuals may be a good indicator of early intervention in T2DM prevention. Consequently, further studies are warranted to verify our results in a population that includes healthy people.
In conclusion, BMFR is more useful than FMR in quantifying IR in patients with T2DM because the correlation between BMFR and the insulin sensitivity index M/I is significantly greater than that between FMR and M/I.
Acknowledgments
None to declare.
Financial Disclosure
None to declare.
Conflict of Interest
HJ has received honoraria from Novo Nordisk, Sanofi, AstraZeneca Pharmaceuticals, Astellas Pharma, Boehringer Ingelheim, Daiichi-Sankyo, Eli Lilly, Takeda, and Novartis Pharmaceuticals. SS has received honoraria from MSD, AstraZeneca Pharmaceuticals, Ono Pharmaceutical, Bayer Yakuhin, Ltd, and Novo Nordisk. There is no other potential conflict of interest relevant to this article.
Informed Consent
Signed informed consent was obtained from each patient.
Author Contributions
NK, SS, MN and HJ contributed to the analysis design, acquisition and interpretation of data and reviewed/edited the manuscript. AY, KH, FM, KK, KJ and TJ contributed to the interpretation of data and reviewed/edited the manuscript. All authors read and approved the final manuscript.
Data Availability
The authors declare that data supporting the findings of this study are available within the article.
| References | ▴Top |
- Kurinami N, Sugiyama S, Yoshida A, Hieshima K, Miyamoto F, Kajiwara K, Jinnouchi T, et al. Correlation of body muscle/fat ratio with insulin sensitivity using hyperinsulinemic-euglycemic clamp in treatment-naive type 2 diabetes mellitus. Diabetes Res Clin Pract. 2016;120:65-72.
doi pubmed - Kurinami N, Sugiyama S, Yoshida A, Hieshima K, Miyamoto F, Kajiwara K, Jinnouch K, et al. Body muscle-to-fat ratio gender-specific cut-off values for impaired insulin sensitivity in patients with treatment-naive type 2 diabetes mellitus. Endocrine. 2019;66(3):503-508.
doi pubmed - Xu K, Zhu HJ, Chen S, Chen L, Wang X, Zhang LY, Pan L, et al. Fat-to-muscle ratio: a new anthropometric indicator for predicting metabolic syndrome in the Han and Bouyei populations from Guizhou province, China. Biomed Environ Sci. 2018;31(4):261-271.
- Ramirez-Velez R, Carrillo HA, Correa-Bautista JE, Schmidt-RioValle J, Gonzalez-Jimenez E, Correa-Rodriguez M, Gonzalez-Ruiz K, et al. Fat-to-Muscle Ratio: A New Anthropometric Indicator as a Screening Tool for Metabolic Syndrome in Young Colombian People. Nutrients. 2018;10(8):1027.
doi pubmed - Giannarelli R, Aragona M, Coppelli A, Del Prato S. Reducing insulin resistance with metformin: the evidence today. Diabetes Metab. 2003;29(4 Pt 2):6S28-35.
doi - Miyazaki Y, Mahankali A, Wajcberg E, Bajaj M, Mandarino LJ, DeFronzo RA. Effect of pioglitazone on circulating adipocytokine levels and insulin sensitivity in type 2 diabetic patients. J Clin Endocrinol Metab. 2004;89(9):4312-4319.
doi pubmed - Merovci A, Solis-Herrera C, Daniele G, Eldor R, Fiorentino TV, Tripathy D, Xiong J, et al. Dapagliflozin improves muscle insulin sensitivity but enhances endogenous glucose production. J Clin Invest. 2014;124(2):509-514.
doi pubmed - Yki-Jarvinen H, Koivisto VA. Insulin sensitivity in newly diagnosed type 1 diabetics after ketoacidosis and after three months of insulin therapy. J Clin Endocrinol Metab. 1984;59(3):371-378.
doi pubmed - DeFronzo RA, Tobin JD, Andres R. Glucose clamp technique: a method for quantifying insulin secretion and resistance. Am J Physiol. 1979;237(3):E214-223.
doi pubmed - Kurinami N, Sugiyama S, Morita A, Yoshida A, Hieshima K, Miyamoto F, Kajiwara K, et al. Ratio of muscle mass to fat mass assessed by bioelectrical impedance analysis is significantly correlated with liver fat accumulation in patients with type 2 diabetes mellitus. Diabetes Res Clin Pract. 2018;139:122-130.
doi pubmed - Kurinami N, Sugiyama S, Ijima H, Yoshida A, Hieshima K, Miyamoto F, Kajiwara K, et al. Clinical usefulness of the body muscle-to-fat ratio for screening obstructive sleep apnea syndrome in patients with inadequately controlled type 2 diabetes mellitus. Diabetes Res Clin Pract. 2018;143:134-139.
doi pubmed - Kurinami N, Sugiyama S, Nishimura H, Morita A, Yoshida A, Hieshima K, Miyamoto F, et al. Clinical factors associated with initial decrease in body-fat percentage induced by add-on sodium-glucose co-transporter 2 inhibitors in patient with type 2 diabetes mellitus. Clin Drug Investig. 2018;38(1):19-27.
doi pubmed - Kurinami N, Sugiyama S, Yoshida A, Hieshima K, Miyamoto F, Kajiwara K, Jinnouch K, et al. Dapagliflozin significantly reduced liver fat accumulation associated with a decrease in abdominal subcutaneous fat in patients with inadequately controlled type 2 diabetes mellitus. Diabetes Res Clin Pract. 2018;142:254-263.
doi pubmed - Cha K, Chertow GM, Gonzalez J, Lazarus JM, Wilmore DW. Multifrequency bioelectrical impedance estimates the distribution of body water. J Appl Physiol (1985). 1995;79(4):1316-1319.
doi pubmed - Cha K, Shin S, Shon C, Choi S, Wilmore DW. Evaluation of segmental bioelectrical impedance analysis (SIBA) for measuring muscle distribution. J ICHPER SD-ASIA. 1997:11-14.
- Chen LK, Liu LK, Woo J, Assantachai P, Auyeung TW, Bahyah KS, Chou MY, et al. Sarcopenia in Asia: consensus report of the Asian Working Group for Sarcopenia. J Am Med Dir Assoc. 2014;15(2):95-101.
doi pubmed - Seo YG, Song HJ, Song YR. Fat-to-muscle ratio as a predictor of insulin resistance and metabolic syndrome in Korean adults. J Cachexia Sarcopenia Muscle. 2020;11(3):710-725.
doi pubmed - Chen YY, Fang WH, Wang CC, Kao TW, Yang HF, Wu CJ, Sun YS, et al. Fat-to-muscle ratio is a useful index for cardiometabolic risks: A population-based observational study. PLoS One. 2019;14(4):e0214994.
doi pubmed - Wang T, Feng X, Zhou J, Gong H, Xia S, Wei Q, Hu X, et al. Type 2 diabetes mellitus is associated with increased risks of sarcopenia and pre-sarcopenia in Chinese elderly. Sci Rep. 2016;6:38937.
doi pubmed
This article is distributed under the terms of the Creative Commons Attribution Non-Commercial 4.0 International License, which permits unrestricted non-commercial use, distribution, and reproduction in any medium, provided the original work is properly cited.
Journal of Clinical Medicine Research is published by Elmer Press Inc.