

| Journal of Clinical Medicine Research, ISSN 1918-3003 print, 1918-3011 online, Open Access |
| Article copyright, the authors; Journal compilation copyright, J Clin Med Res and Elmer Press Inc |
| Journal website https://www.jocmr.org |
Original Article
Volume 12, Number 9, September 2020, pages 568-578
Chronic Pancreatitis Is Characterized by Elevated Circulating Periostin Levels Related to Intra-Pancreatic Fat Deposition
Juyeon Koa, Charlotte E. Stuarta, Andre E. Modestoa, Jaelim Choa, Sakina H. Bharmala, Maxim S. Petrova, b, c
aSchool of Medicine, University of Auckland, Auckland, New Zealand
bAuckland City Hospital, Auckland, New Zealand
cCorresponding Author: Maxim S. Petrov, Auckland City Hospital, Room 12.085A, Level 12, Auckland 1023, New Zealand
Manuscript submitted July 10, 2020, accepted July 22, 2020, published online August 15, 2020
Short title: Periostin and Intra-Pancreatic Fat in Pancreatitis
doi: https://doi.org/10.14740/jocmr4279
| Abstract | ▴Top |
Background: Periostin is a matricellular protein that induces fibrillogenesis and activates cell migration. It is overexpressed in common fibrotic diseases and is also associated with abdominal adiposity/ectopic fat phenotypes. The study aimed to investigate circulating levels of periostin in health and after an attack of pancreatitis, as well as their associations with abdominal adiposity/ectopic fat phenotypes.
Methods: Blood samples were obtained from healthy controls, as well as definite chronic pancreatitis (CP) and acute pancreatitis (AP) individuals during follow-up visits. Fat depositions in the pancreas, liver, skeletal muscle, as well as visceral and subcutaneous fat volumes, were quantified with the use of magnetic resonance imaging. A series of multivariable analyses were conducted, accounting for possible confounders.
Results: A total of 121 individuals were included. Periostin levels were significantly higher in the CP group compared with the other groups in both unadjusted (F = 3.211, P = 0.044) and all adjusted models (F = 4.165, P = 0.019 in the most adjusted model). Intra-pancreatic fat deposition (but not the other fat phenotypes) was significantly associated with periostin concentration in the CP group (β = 49.63, P = 0.034) and explained most of its variance (32.0%).
Conclusions: Individuals with CP, but not healthy individuals or those after clinical resolution of AP, are characterized by elevated circulating levels of periostin that are positively associated with intra-pancreatic fat deposition.
Keywords: Biomarkers; Pancreatitis; Liver fat; Intra-pancreatic fat; Skeletal muscle fat; Visceral fat; Subcutaneous fat; Magnetic resonance imaging
| Introduction | ▴Top |
Pancreatitis poses a substantial healthcare burden. The global incidence of chronic pancreatitis (CP) is 10 cases per 100,000 person-years whereas that of acute pancreatitis (AP) is 34 cases per 100,000 person-years [1]. The annual healthcare cost is estimated to be over $150 million for CP and $2 billion for AP in the USA alone [2, 3]. Furthermore, both CP and AP are important risk factors for pancreatic cancer and are common causes of post-pancreatitis diabetes mellitus [4-6]. The “holistic prevention of pancreatitis” framework has the potential to reduce the burden of pancreatitis and its sequelae by advancing primary, secondary, and tertiary prevention [7]. Timely diagnosing of pancreatitis is a cornerstone of secondary prevention. However, while diagnosing of AP is typically quite straightforward, CP largely gets diagnosed at the advanced stage only. At least in part, this is because relatively inexpensive quantitative blood biomarkers are available for AP (e.g. pancreatic lipase), but not CP.
The extracellular matrix protein periostin (encoded by the POSTN gene) was first isolated in 1993 from an osteoblast cell line but its functions remained unknown until after periostin-deficient mice were generated [8]. Periostin is a member of the vitamin K-dependent c-carboxylated protein family that is expressed in collagen-rich connective tissues and involved in cell recruitment as well as adhesion [9]. It has been shown to be a biomarker of several fibrotic diseases (e.g. idiopathic pulmonary fibrosis, chronic cardiac fibrosis, scleroderma) and tumors [10, 11]. The identification of POSTN gene in pancreatic stellate cells by transcriptome analysis spurred studies into its role in pancreatic cancer [12]. In particular, a 2018 clinical study of 287 participants [13] found that circulating levels of periostin were significantly higher in patients with pancreatic cancer than in healthy controls, and the advanced stage patients tended to have higher levels of periostin than the early-stage patients. Also, a 2017 clinical study of 80 patients with pancreatic cancer showed that those with high (vs. low) periostin expression had nearly two-times larger tumor volumes and suggested that periostin underlies the aberrant upregulation of pancreatic cancer cells [14]. Further, the median 2-year survival rate was higher in patients with low periostin expression than in patients with high periostin expression (36% vs. 11%) [14]. However, to date, there have been no clinical studies on periostin in the setting of pancreatitis - one of the most prominent risk factors for pancreatic cancer [15]. In wild-type mice, a 2016 study showed a strong POSTN expression in the acute inflammatory phase of AP, gradual reduction in the regeneration phase, and minimal expression in fully regenerated pancreatic tissue [16]. Further, a significant association between periostin expression and fatty replacement of the pancreas was observed in the gene knockout mice [16].
The primary aim was to compare plasma periostin levels between individuals with definite CP, individuals after AP, and healthy individuals. The secondary aim was to investigate the associations between plasma periostin levels and abdominal adiposity/ectopic fat phenotypes in the study groups.
| Patients and Methods | ▴Top |
Eligibility criteria
This study was a cross-sectional study nested into prospective cohort study as part of the Analytic moRphomics In pancrEatic diSeases (ARIES) project. Eighteen-year-old or older individuals with a primary diagnosis of AP or CP were recruited at hospital admission. The diagnosis of AP was established based on the presence of two of the following three criteria: serum lipase and/or amylase at least three times the upper limit of normal ranges; abdominal pain suggestive of AP; and characteristics of AP on imaging studies. The diagnosis of definite CP was established based on the presence of ductal or parenchymal calcifications on modern cross-sectional imaging and/or Cambridge grade ≥ 3. The exclusion criteria were as follows: pancreatic cancer or premalignant lesions, any other malignancy, congenital anomalies of the pancreas, hereditary pancreatitis, cystic fibrosis, pancreatic lipomatosis or lipomatous pseudohypertrophy, post-endoscopic retrograde cholangiopancreatography pancreatitis, pancreatic trauma, interventions involving the pancreas (including surgical, endoscopic or radiologic), autoimmune pancreatitis, use of steroid therapy, pregnancy (at the time of pancreatitis or after), having metallic foreign body implantations, heart pacemakers, or other implanted electronic devices. Individuals with a confirmed attack of pancreatitis within 3 months prior to the study date were also excluded. In addition, healthy individuals aged ≥ 18 years were recruited. Individuals who had a personal or family history of diseases of the exocrine pancreas, diabetes, malignancy, celiac disease, cystic fibrosis, or symptoms of upper abdominal pain and nausea were excluded. The recruited individuals were confirmed not to have a history of acute infectious or inflammatory conditions requiring medical evaluation or treatment in the 6 months prior to recruitment. All participants provided written informed consent.
Measurement of periostin
Venous blood samples were obtained from each participant after at least 8 h of fasting to assess plasma periostin. These blood samples were centrifuged 4,000 g for 7.5 min at 4 °C; plasma was separated into aliquots and stored at 80 °C until further use. Periostin concentration was measured in plasma using an enzyme-linked immunosorbent assay (Biomedica Gruppe, Vienna, Austria). The assay was well validated and used in previously published studies [17, 18]. The intra-assay coefficient of variation was 3%, and the inter-assay coefficient of variation was 6%. Results were expressed in pmol/L.
Quantification of fat phenotypes
Imaging protocol
Abdominal magnetic resonance imaging (MRI) for all participants was performed using 3.0 Tesla (T) MAGNETOM Skyra scanner (Siemens, Erlangen, Germany). During the MRI, participants lied down in supine position and were asked to hold their breath at end-expiration. Axial T1-weighted volumetric interpolated breath-hold examination Dixon sequence was applied with the following parameters: true form abdomen shim mode; field of view (FOV), 420 mm; base resolution, 320; time of echo (TE), 1.27 ms, 2.5 ms; time of repetition (TR), 3.85 ms; flip angle, 9°; pixel bandwidth, 920 Hz; and slice thickness, 5 mm. Intra-pancreatic fat, skeletal muscle fat, subcutaneous and visceral fat were quantified independently by two raters and average values of two independent MRI measurements were used for statistical analyses. Intra-class correlation coefficient (ICC) was used to evaluate the inter-rater reliability of measurements. ICC of < 0.5, 0.5 - 0.75, 0.75 - 0.9, and > 0.9 was indicative of poor, moderate, good, and excellent inter-rater reliability, respectively [19]. Liver fat was quantified by one rater.
Intra-pancreatic fat
Intra-pancreatic fat deposition was measured using the “MR-opsy” technique, as described in detail elsewhere [20]. In brief, two candidate slices with clear visualisation of the pancreas were selected from a series of abdominal scans. Three regions of interest were placed in the head, body, and tail region of the pancreas. In order to eliminate the potential inclusion of non-parenchymal tissues within the regions of interest, a thresholding range of 1-20% was applied [21]. Intra-pancreatic fat percentage was calculated as the average pancreatic fat fraction of both slices.
Liver fat
Single-voxel spectroscopy was used and the voxel (20 × 20 × 20 mm) was positioned in the right lobe of the liver (away from the blood vessels and bile ducts and ≥ 1 cm away from the edge) [22]. Fifty acquisitions were recorded in a measuring time of 5 min, and automated abdominal shimming was performed with TR = 3,000 ms and TE = 33 ms. Both water-suppressed and non-water-suppressed spectra were taken in the same voxel, where the non-water-suppressed spectra served as the reference for fat quantification. The protocol was described in detail elsewhere [23].
Skeletal muscle fat
Total muscle area and intra-muscular fat area of erector spinae muscles were measured using a single axial slice at the lower endplate of L3 vertebra [24]. Care was taken not to include extra-muscular fat (i.e. beyond the fascial layer of the erector spinae muscles). The protocol was described in detail elsewhere [25].
Subcutaneous and visceral fat
Identical fat-phase images (L2 - L5) were used for segmentation of visceral and subcutaneous fat compartments [26]. Visceral fat volume and subcutaneous fat volume were quantified. The non-adipose tissue, soft organs, and blood vessels were excluded from the measurement of visceral fat. The protocol was described in detail elsewhere [27].
Covariates
Tertiary referral medical laboratory located at Auckland City Hospital measured lipid profile, which included triglycerides, total cholesterol, high-density lipoprotein (HDL)-cholesterol, and low-density lipoprotein (LDL)-cholesterol. The same laboratory measured glycated hemoglobin (HbA1c), using the boronate affinity chromatography assay (Trinity Biotech, Wicklow, Ireland) that is certified by the National Glycohaemoglobin Standardisation Program (NGSP) and standardized to the Diabetes Control and Complications Trial reference assay. Fasting plasma glucose was measured using an enzymatic colorimetric assay (F. Hoffmann-La Roche Ltd, Basel, Switzerland) and fasting insulin using chemiluminescence sandwich immunoassay (Roche Diagnostics NZ Ltd, Auckland, New Zealand). To derive homeostatic model assessment of insulin resistance (HOMA-IR) and ß-cell function (HOMA-β), fasting plasma glucose (mmol/L) and fasting insulin (pmol/L) measures were entered into the validated HOMA2 calculator (HOMA2 v2.2.3; Diabetes Trials Unit, University of Oxford, Oxford, UK) [28]. The active form of pancreatic amylase was measured in plasma using the Reflotron® Plus reflectance photometer (Roche®, Basel, Switzerland). Results were expressed in U/L.
A standardized questionnaire was administered at the time of MRI [23]. Participants were asked: “Have you ever smoked cigarettes?” If the answer was “yes”, they were classified as ever-smokers; otherwise they were classified as never-smokers. For information on alcohol consumption, participants were asked: “At the heaviest level, how many drinks would you have on a typical drinking day?” The response to this question was used to determine alcohol consumption in the study group.
Statistical analyses
All analyses were performed using SPSS for Windows Version 25 (SPSS Inc., Chicago, IL, USA). A two-sided P < 0.05 was deemed to be statistically significant. To examine the differences in periostin levels between the three groups (CP, AP, and healthy individuals), one-way analysis of variance (ANOVA) and one-way analysis of covariance (ANCOVA) were conducted. ANCOVA enabled to reduce within-group variance while adjusting for covariates. The following five models were constructed: 1) Unadjusted; 2) Adjusted for age and sex; 3) Adjusted for age, sex, body mass index, and triglycerides; 4) Adjusted for age, sex, body mass index, triglycerides, and HbA1c; and 5) Adjusted for age, sex, body mass index, and triglycerides, HbA1c, alcohol consumption, and smoking status. The Fisher’s least significant difference method was used for post hoc pairwise comparisons. The same approach was used to investigate the differences in fat phenotypes between the three groups.
To investigate the associations between periostin levels and the five fat phenotypes in each study group, linear regression analysis was conducted. In this analysis, each abdominal fat phenotype was treated as an independent variable and periostin levels were treated as the dependent variable. In addition, the relative importance of each fat phenotype in explaining the variance of periostin levels was assessed in each study group. Using the “relaimpo” package (Gromping, 2006) in R Studio (version 3.6.1), a multivariable linear regression model was constructed in each study group, including the five fat phenotypes as independent variables and periostin levels as the dependent variable [29]. The resulting individual R2 values of all the independent variables were obtained and plotted.
This study was approved by the Health and Disability Ethics Committee (13/STH/182) and was conducted in compliance with the ethical standards of the responsible institution on human subjects as well as with the Helsinki Declaration.
| Results | ▴Top |
Periostin in the study groups
A total of 121 individuals were included. Their characteristics are presented in Table 1. The levels of periostin were 491.2 ± 142.6 pmol/L, 363.4 ± 149.7 pmol/L, and 359.0 ± 143.7 pmol/L in the CP group, AP group, and healthy control group, respectively (Fig. 1). The difference between the groups was statistically significant in the unadjusted analysis (F = 3.211, P = 0.044). Further, it remained significant in all the adjusted models (F = 3.486, P = 0.034 in model 2; F = 3.693, P = 0.028 in model 3; F = 3.556, P = 0.032 in model 4; F = 4.165, P = 0.019 in model 5).
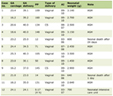 Click to view | Table 1. Characteristics of the Study Groups |
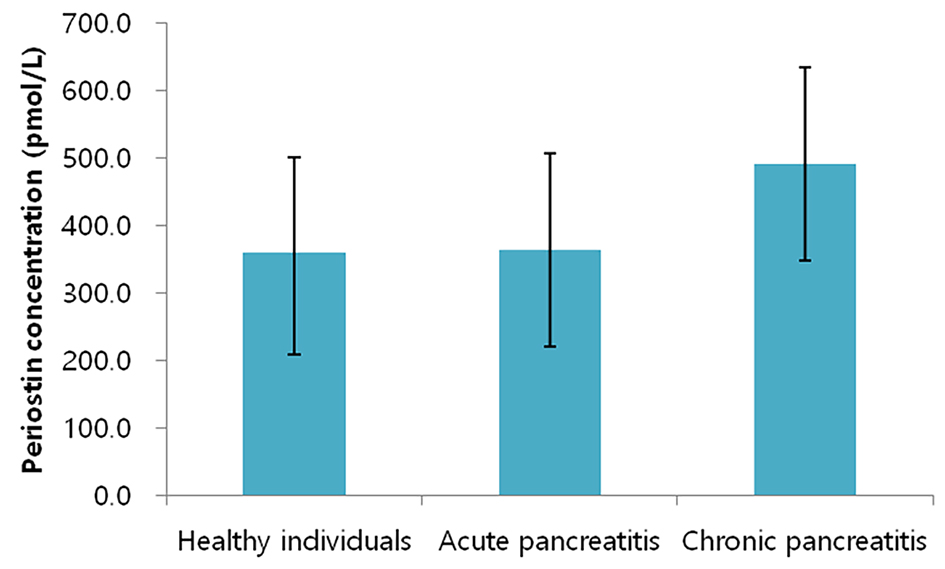 Click for large image | Figure 1. Periostin levels in the study groups. Bars represent mean values whereas whiskers represent two standard deviations. |
The levels of periostin were significantly higher by 127.8 pmol/L in the CP group compared with the AP group. The difference between the groups was statistically significant in both the unadjusted (P = 0.015) and all the adjusted models (P = 0.012 in model 2; P = 0.014 in model 3; P = 0.02 in model 4; P = 0.019 in model 5).
The levels of periostin were significantly higher by 132.2 pmol/L in the CP group compared with the healthy control group. The difference between the groups was statistically significant in both the unadjusted (P = 0.017) and all the adjusted models (P = 0.014 in model 2; P = 0.028 in model 3; P = 0.01 in model 4; P = 0.005 in model 5).
The levels of periostin were higher by 4.4 pmol/L in the AP group compared with healthy control group. There was no statistically significant difference between the groups.
Fat phenotypes in the study groups
The ICC (95% confidence interval (CI)) for the measurements of intra-pancreatic fat was 0.966 (0.952 - 0.975), skeletal muscle fat 0.985 (0.979 - 0.989), visceral fat 0.997 (0.995 - 0.998), and subcutaneous fat 0.997 (0.996 - 0.998).
The intra-pancreatic fat percentage was 10.8 ± 1.9%, 9.4 ± 1.74%, and 7.9 ± 2.1% in the CP group, AP group, and healthy control group, respectively. The difference between the three groups was statistically significant in both the unadjusted (P < 0.001) and all the adjusted models (P = 0.001 in model 2; P = 0.008 in model 3; P = 0.010 in model 4; P = 0.037 in model 5).
The liver fat percentage was 9.4 ± 7.6%, 10.0 ± 10.2%, and 8.5 ± 7.0% in the CP group, AP group, and healthy control group, respectively. The difference between the three groups was not statistically significant in all the models.
The skeletal muscle fat percentage was 17.0 ± 5.5%, 15.7 ± 6.9%, and 14.1 ± 6.4% in the CP group, AP group, and healthy control group, respectively. The difference between the three groups was not statistically significant in all the models.
The visceral fat volume was 2,682.3 ± 1,199.9 cm3, 2,110.0 ± 1,128.4 cm3, and 1,118.4 ± 755.9 cm3 in the CP group, AP group, and healthy control group, respectively. The difference between the three groups was statistically significant in both the unadjusted (P < 0.001) and all the adjusted models (P < 0.001 in model 2; P = 0.011 in model 3; P = 0.009 in model 4; P = 0.020 in model 5).
The subcutaneous fat volume was 2,815.6 ± 1,545.9 cm3, 3,114.7 ± 1,426.2 cm3, and 2,551.9 ± 1,363.5 cm3 in the CP group, AP group, and healthy control group, respectively. The difference between the three groups was statistically significant in the sex- and age-adjusted model (i.e. model 2) only (P = 0.011).
Results of all the pairwise comparisons between the study groups are presented in Table 2.
Click to view | Table 2. Significance of the Differences in Abdominal Fat Phenotypes Between the Study Groups |
Associations between periostin and fat phenotypes in the study groups
In the CP group, intra-pancreatic fat percentage was positively associated with periostin levels (β = 49.627, P = 0.034) (Table 3). The other abdominal fat phenotypes were not significantly associated with periostin levels. Out of the fat phenotypes studied, the variance in periostin levels was most explained by intra-pancreatic fat percentage (R2 = 32.0%), followed by skeletal muscle fat percentage (R2 = 15.1%), subcutaneous fat volume (R2 = 13.0%), visceral fat volume (R2 = 7.3%), and liver fat percentage (R2 = 6.6%) (Fig. 2a).
Click to view | Table 3. Associations Between Abdominal Fat Phenotypes and Periostin Levels |
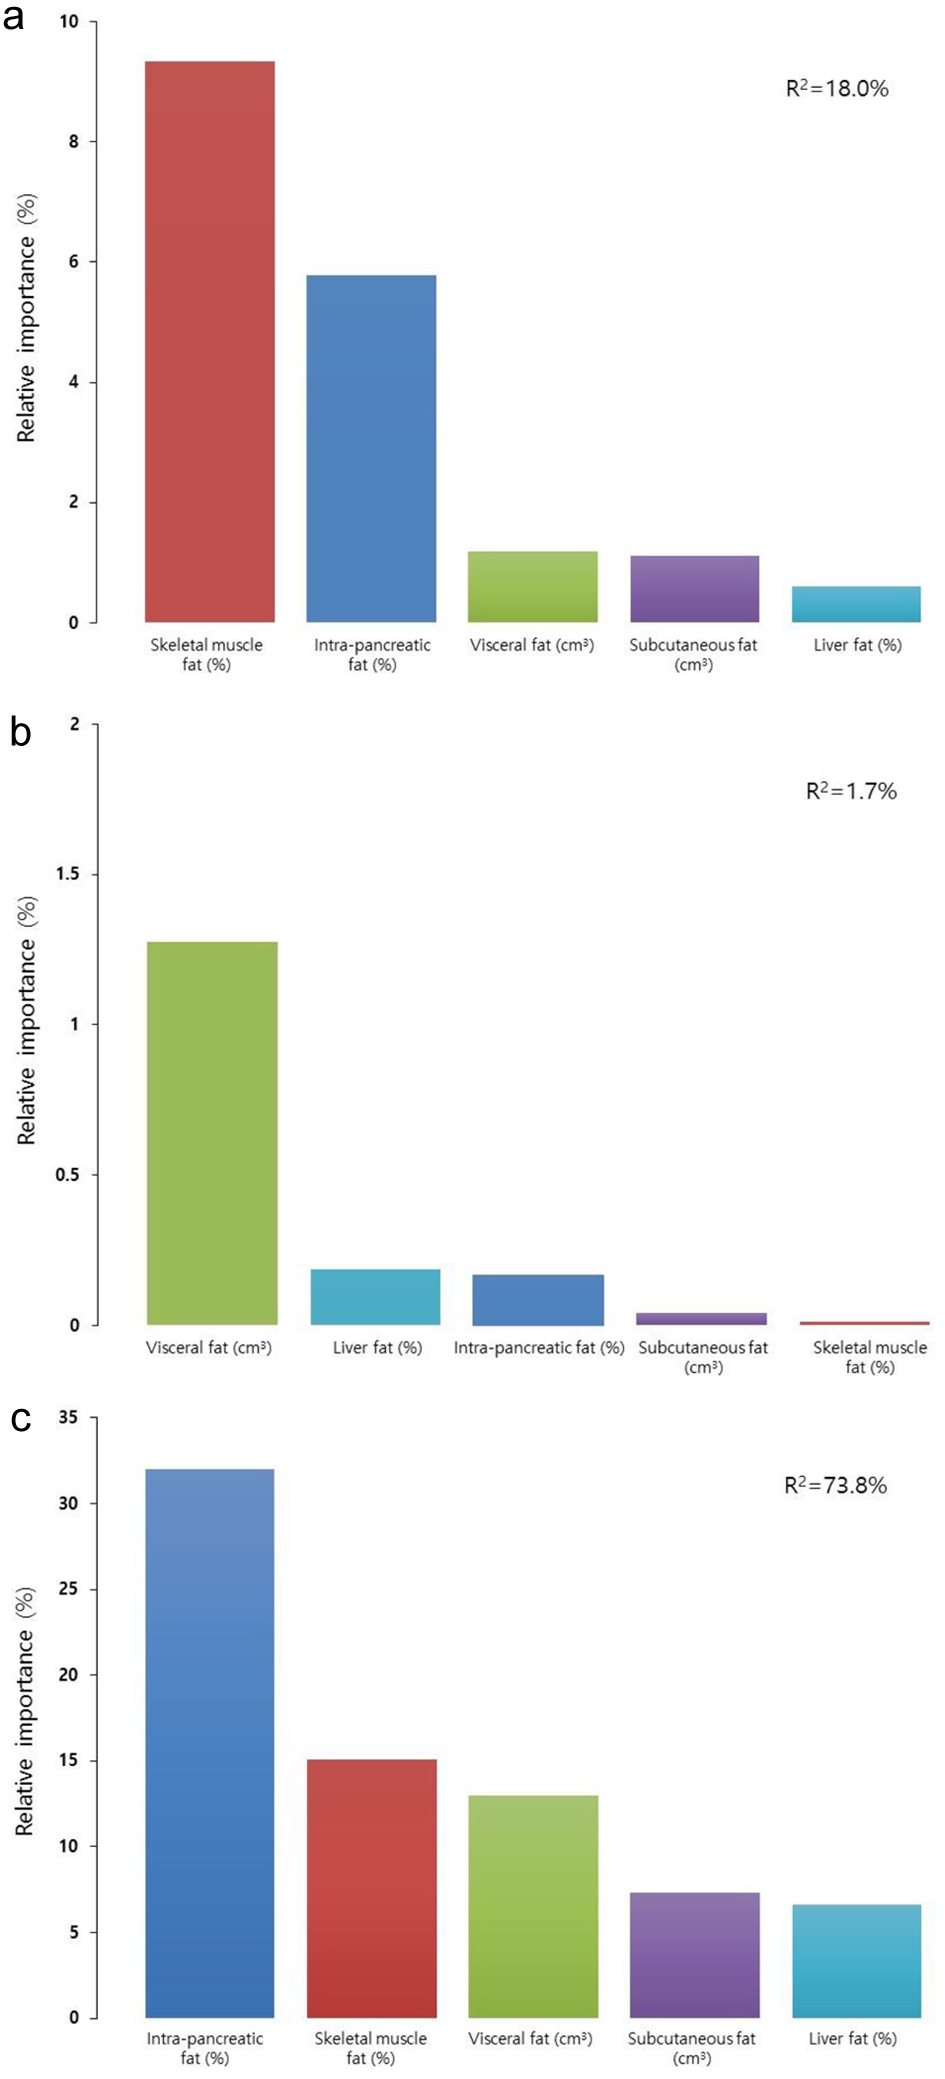 Click for large image | Figure 2. Relative contributions of the studied fat phenotypes to circulating periostin levels in individuals with chronic pancreatitis (a), individuals after acute pancreatitis (b), and healthy individuals (c). Data are presented as percentages of corresponding fat phenotypes that explain the variance of periostin. |
In the AP group, none of the associations between fat phenotypes and periostin levels were significant (Table 3). Out of the fat phenotypes studied, the variance in periostin levels was most explained by visceral fat volume (R2 = 1.2%), followed by liver fat percentage (R2 = 0.2%), intra-pancreatic fat percentage (R2 = 0.2%). Subcutaneous fat volume and skeletal muscle fat percentage did not explain the variance in periostin levels (Fig. 2b).
In the healthy control group, none of the associations between abdominal fat phenotypes and periostin levels were significant (Table 3). Out of the abdominal fat phenotypes studied, the variance in periostin levels was best explained by skeletal muscle fat percentage (R2 = 9.3%), followed by intra-pancreatic fat percentage (R2 = 5.7%), visceral fat volume (R2 = 1.2%), subcutaneous fat volume (R2 = 1.1%), and liver fat percentage (R2 = 0.1%) (Fig. 2c).
| Discussion | ▴Top |
This was the first study to comprehensively investigate five abdominal adiposity/ectopic fat phenotypes (derived from MRI) in relation to periostin levels and to examine the relative importance of fat depositions in the pancreas, liver, skeletal muscle, visceral and subcutaneous fat in health and pancreatitis. The main finding was that individuals in the CP group have significantly higher plasma periostin levels than individuals in the AP group and the healthy control group. Further, in the CP group (but not in the other study groups), intra-pancreatic fat deposition (IPFD) was significantly positively associated with periostin levels. The relative importance analyses revealed that the five abdominal adiposity/ectopic fat phenotypes altogether explained 74% of the variance in plasma periostin levels of individuals with CP, whereas only 18% of the variance was explained in healthy individuals.
Periostin is one of the most specific products of activated myofibroblasts. Its expression is low in healthy tissues but it is over-expressed in damaged tissues (e.g. heart valves, lungs, tendons, ligaments, and the cornea) [30]. It is also associated with fat phenotypes, though this aspect is just beginning to be investigated. Recent studies in both animal and human models have shown that elevated circulating levels of periostin are positively correlated with excess adiposity (defined based on body mass index (BMI)), dyslipidemia, and chronic inflammation [31-34]. Macrophages in visceral adipose tissue are responsible for periostin production in obesity, possibly due to hypoxia [31]. In an obese mouse model, Lu et al [32] found that the overexpression of periostin in the liver induced hepatic steatosis and hyperglycemia through c-Jun N-terminal kinase (JNK)-mediated suppression of fatty acid oxidation in the liver. This finding was in line with a genetic knockout of periostin mice study showing lower levels of structural formation and fibrosis in adipose tissues and protection from liver steatosis [31]. Moreover, mice deficient of periostin in their hematopoietic cells had lower inflammation in adipose tissue, in parallel with a reduction in ectopic lipid accumulation, compared with wild-type mice controls [31]. A study of 161 obese (as defined by BMI ≥ 25 kg/m2) and type 2 diabetes mellitus individuals showed that individuals with obesity had significantly higher levels of periostin compared with normal-weight individuals [33]. Several studies have suggested the association of increased periostin levels with excess adiposity [31-34]. However, the existing literature is mainly limited to an investigation of either general adiposity (based on BMI [33]) or a particular fat depot (e.g. liver fat [32, 35]), and the role of periostin in abdominal adiposity/ectopic fat phenotypes of individuals with pancreatitis has never been studied holistically.
For the first time, the present study investigated the associations of abdominal adiposity/ectopic fat phenotypes with circulating levels of periostin in the setting of pancreatitis. Intra-pancreatic fat and visceral fat (but not subcutaneous fat or liver fat or skeletal muscle fat) were significantly higher in individuals with CP in comparison with healthy individuals, in both unadjusted and adjusted models. However, only intra-pancreatic fat (but not visceral fat) showed a significant positive association with periostin levels in the CP group. In this group, of the studied abdominal adiposity/ectopic fat phenotypes, intra-pancreatic fat contributed most to the variance in plasma periostin (R2 = 32.0%). By contrast, there was a relatively small contribution of intra-pancreatic fat (R2 = 5.7%) to the variance in plasma periostin in the healthy control group. It is therefore likely that the underlying overexpression of periostin is involved in the pathophysiology of IPFD in individuals with CP. Although the pathophysiology of IPFD in individuals with pancreatitis has been poorly investigated, it is likely that adipocytes in the pancreas affect the functions of acinar and islet cells [36, 37]. One possible mechanism of IPFD in individuals with CP is related to changes in cellular identity within the pancreas [38, 39]. A 2019 clinical study investigating the possible involvement of inflammation in pancreatic β-cell dedifferentiation in individuals with CP (independent of diabetes mellitus) showed that 10% of β-cells lose their identity and mature/differentiated phenotype and regress to a precursor-like dedifferentiated state due to chronic inflammation [40]. Importantly, both human and animal studies found that IPFD may contribute to β-cell lipotoxicity and lipoapoptosis, with consequent loss of function [41]. Another emerging evidence indicates that acinar-to-adipocyte transdifferentiation (another type of cellular identity changes) can be a major contributor to fatty replacement of the pancreas. Given that CP is characterized by recurrent insults to the pancreas, the resulting inflammation may predispose to changes in cellular identity within the pancreas [42-46]. Another possible mechanism of IPFD in individuals with CP is related to upregulation of peroxisome proliferator-activated receptor gamma (PPAR-γ), which is a promotor of the key adipogenesis regulator [31]. Binding of PPAR-γ with Gata6 (a transcription factor) represses adipogenesis in the normal pancreas. A 2013 study showed that Gata6 inactivation leads to massive acinar loss and replacement by fat, including acinar-to-adipocyte transdifferentiation (the epithelial origin of which was confirmed by lineage tracing) [47]. Further, in Gata6-deficient mice, increased expression of PPAR-γ and the lipid droplet perilipin were observed, indicating that some adipocytes have an epithelial origin [47]. In vivo, PPAR-γ overexpression was found together with macrophages in adipose tissue that were responsible for the periostin secretion in excessive fat accumulation [31]. Based on the above arguments, it appears that elevated levels of periostin in individuals with CP reflect acinar cell atrophy and subsequent fatty replacement of the pancreas (possibly arising from dysfunction of the insulo-acinar axis characterized by β-cell dysfunction, death, and dedifferentiation and/or PPAR overexpression). Carefully designed mechanistic studies are now warranted to further elucidate the intricate relationship between periostin, IPFD, and CP.
Several limitations of the study need to be acknowledged. First, the cross-sectional design did not allow inference as to whether the elevation of periostin levels is a consequence of IPFD or one of the factors causing it. However, all published studies investigating the relationship between IPFD and its biomarkers had a cross-sectional design. A prospective longitudinal study focusing on changes in IPFD and periostin over time is now warranted to provide novel insights into the interplay between inflammation of the pancreas and IPFD. Second, our single-center study included a rather limited number of CP individuals during the prespecified time-frame, in line with the relatively low incidence of CP [1, 7]. The study also had the strict eligibility criteria: only individuals with definite CP were included. The results of the present study should be viewed as hypothesis-generating. Future multi-center investigations will benefit from the pilot data presented here. Third, detailed data on some lifestyle factors (e.g. physical activity, energy intake) that might have affected the studied abdominal adiposity/ectopic fat phenotypes were not studied. However, all individuals included in the study were non-athletic and did not report any sudden weight gain or weight loss. Fourth, given that CP itself is a risk factor for the development of pancreatic cancer and taken into account that it is already known that periostin is elevated in pancreatic cancer, there is a possibility that the elevated plasma levels of periostin in the CP group (compared with the AP and healthy control groups) might have been related to pancreatic cancer that was masked as CP [38, 48, 49]. However, all participants underwent MRI and pancreatic cancer was excluded a priori. Last, the present study did not investigate the genetic make-up of participants; therefore, inherent differences in abdominal adiposity/ectopic fat phenotypes cannot be ruled out [50]. Future studies are warranted to determine if the studied associations are affected by genetic variations.
In conclusion, IPFD was significantly associated with circulating levels of periostin in individuals with CP (but not the other study participants) and explained nearly one-third of the variation in plasma periostin levels. The interplay between periostin and IPFD could be harnessed with a view to secondary preventing of CP. In the future, molecular biomarkers such as periostin may enable the application of “precision medicine” by aiding in the selection of a suitable anti-fibrotic drug for each individual with CP.
Acknowledgments
This study was part of the COSMOS program.
Financial Disclosure
COSMOS is supported in part by the Royal Society of New Zealand (Rutherford Discovery Fellowship to M. S. Petrov), which played no role in the study design, collection, analysis, or interpretation of data, or writing of the manuscript.
Conflict of Interest
None to declare.
Informed Consent
It was given by all study participants.
Author Contributions
MSP contributed to study concept and design; JK, CES, AEM, JC, and SHB were involved in patient recruitment; JK contributed to acquisition of data; JK and JC contributed to analysis and interpretation of data; JK and JC contributed to statistical analysis; JK drafted the manuscript; JC, CES, AEM, SHB, and MSP participated in critical revision of the manuscript; MSP supervised the study.
Data Availability
Any inquiries regarding supporting data availability of this study should be directed to the corresponding author.
| References | ▴Top |
- Xiao AY, Tan ML, Wu LM, Asrani VM, Windsor JA, Yadav D, Petrov MS. Global incidence and mortality of pancreatic diseases: a systematic review, meta-analysis, and meta-regression of population-based cohort studies. Lancet Gastroenterol Hepatol. 2016;1(1):45-55.
doi - Lew D, Afghani E, Pandol S. Chronic pancreatitis: current status and challenges for prevention and treatment. Dig Dis Sci. 2017;62(7):1702-1712.
doi pubmed - Rashid N, Sharma PP, Scott RD, Lin KJ, Toth PP. All-cause and acute pancreatitis health care costs in patients with severe hypertriglyceridemia. Pancreas. 2017;46(1):57-63.
doi pubmed - Cho J, Scragg R, Pandol SJ, Goodarzi MO, Petrov MS. Antidiabetic medications and mortality risk in individuals with pancreatic cancer-related diabetes and postpancreatitis diabetes: a nationwide cohort study. Diabetes Care. 2019;42(9):1675-1683.
doi pubmed - Cho J, Scragg R, Petrov MS. Risk of mortality and hospitalization after post-pancreatitis diabetes mellitus vs type 2 diabetes mellitus: a population-based matched cohort study. Am J Gastroenterol. 2019;114(5):804-812.
doi pubmed - Petrov MS. Diabetes of the exocrine pancreas: American Diabetes Association-compliant lexicon. Pancreatology. 2017;17(4):523-526.
doi pubmed - Petrov MS, Yadav D. Global epidemiology and holistic prevention of pancreatitis. Nat Rev Gastroenterol Hepatol. 2019;16(3):175-184.
doi pubmed - Takeshita S, Kikuno R, Tezuka K, Amann E. Osteoblast-specific factor 2: cloning of a putative bone adhesion protein with homology with the insect protein fasciclin I. Biochem J. 1993;294(Pt 1):271-278.
doi pubmed - Liu AY, Zheng H, Ouyang G. Periostin, a multifunctional matricellular protein in inflammatory and tumor microenvironments. Matrix Biol. 2014;37:150-156.
doi pubmed - Izuhara K. Practical application of periostin as a biomarker for pathological conditions. Adv Exp Med Biol. 2019;1132:195-204.
doi pubmed - Idolazzi L, Ridolo E, Fassio A, Gatti D, Montagni M, Caminati M, Martignago I, et al. Periostin: the bone and beyond. Eur J Intern Med. 2017;38:12-16.
doi pubmed - Buchholz M, Kestler HA, Holzmann K, Ellenrieder V, Schneiderhan W, Siech M, Adler G, et al. Transcriptome analysis of human hepatic and pancreatic stellate cells: organ-specific variations of a common transcriptional phenotype. J Mol Med (Berl). 2005;83(10):795-805.
doi pubmed - Dong D, Jia L, Zhang L, Ma N, Zhang A, Zhou Y, Ren L. Periostin and CA242 as potential diagnostic serum biomarkers complementing CA19.9 in detecting pancreatic cancer. Cancer Sci. 2018;109(9):2841-2851.
doi pubmed - Liu Y, Li F, Gao F, Xing L, Qin P, Liang X, Zhang J, et al. Role of microenvironmental periostin in pancreatic cancer progression. Oncotarget. 2017;8(52):89552-89565.
doi pubmed - Sadr-Azodi O, Oskarsson V, Discacciati A, Videhult P, Askling J, Ekbom A. Pancreatic cancer following acute pancreatitis: a population-based matched cohort study. Am J Gastroenterol. 2018;113(11):1711-1719.
doi pubmed - Hausmann S, Regel I, Steiger K, Wagner N, Thorwirth M, Schlitter AM, Esposito I, et al. Loss of periostin results in impaired regeneration and pancreatic atrophy after cerulein-induced pancreatitis. Am J Pathol. 2016;186(1):24-31.
doi pubmed - Gossiel F, Scott JR, Paggiosi MA, Naylor KE, McCloskey EV, Peel NFA, Walsh JS, et al. Effect of teriparatide treatment on circulating periostin and its relationship to regulators of bone formation and BMD in postmenopausal women with osteoporosis. J Clin Endocrinol Metab. 2018;103(4):1302-1309.
doi pubmed - Mantovani A, Sani E, Fassio A, Colecchia A, Viapiana O, Gatti D, Idolazzi L, et al. Association between non-alcoholic fatty liver disease and bone turnover biomarkers in post-menopausal women with type 2 diabetes. Diabetes Metab. 2019;45(4):347-355.
doi pubmed - Singh RG, Nguyen NN, Cervantes A, Cho J, Petrov MS. Serum lipid profile as a biomarker of intra-pancreatic fat deposition: a nested cross-sectional study. Nutr Metab Cardiovasc Dis. 2019;29(9):956-964.
doi pubmed - Singh RG, Cervantes A, Kim JU, Nguyen NN, DeSouza SV, Dokpuang D, Lu J, et al. Intrapancreatic fat deposition and visceral fat volume are associated with the presence of diabetes after acute pancreatitis. Am J Physiol Gastrointest Liver Physiol. 2019;316(6):G806-G815.
doi pubmed - Singh RG, Nguyen NN, Cervantes A, Alarcon Ramos GC, Cho J, Petrov MS. Associations between intra-pancreatic fat deposition and circulating levels of cytokines. Cytokine. 2019;120:107-114.
doi pubmed - Singh RG, Nguyen NN, Cervantes A, Kim JU, Stuart CE, Petrov MS. Circulating levels of lipocalin-2 are associated with fatty pancreas but not fatty liver. Peptides. 2019;119:170117.
doi pubmed - Stuart CE, Ko J, Modesto AE, Alarcon Ramos GC, Bharmal SH, Cho J, Singh RG, et al. Implications of tobacco smoking and alcohol consumption on ectopic fat deposition in individuals after pancreatitis. Pancreas. 2020;49(7):924-934.
doi pubmed - Modesto AE, Ko J, Stuart CE, Bharmal SH, Cho J, Petrov MS. Reduced skeletal muscle volume and increased skeletal muscle fat deposition characterize diabetes in individuals after pancreatitis: a magnetic resonance imaging study. Diseases. 2020;8(3).
doi pubmed - Modesto AE, Stuart CE, Cho J, Ko J, Singh RG, Petrov MS. Psoas muscle size as a magnetic resonance imaging biomarker of progression of pancreatitis. Eur Radiol. 2020;30(5):2902-2911.
doi pubmed - Cervantes A, Singh RG, Kim JU, DeSouza SV, Petrov MS. Relationship of anthropometric indices to abdominal body composition: a multi-ethnic New Zealand magnetic resonance imaging study. J Clin Med Res. 2019;11(6):435-446.
doi pubmed - Stuart CE, Ko J, Alarcon Ramos GC, Modesto AE, Cho J, Petrov MS. Associations between cannabis use, abdominal fat phenotypes and insulin traits. J Clin Med Res. 2020;12(6):377-388.
doi pubmed - Singh RG, Nguyen NN, DeSouza SV, Pendharkar SA, Petrov MS. Comprehensive analysis of body composition and insulin traits associated with intra-pancreatic fat deposition in healthy individuals and people with new-onset prediabetes/diabetes after acute pancreatitis. Diabetes Obes Metab. 2019;21(2):417-423.
doi pubmed - Gromping U. Relative importance for linear regression in R: the package relaimpo. Journal Stat Softw. 2006;17:1-27.
doi - Merle B, Garnero P. The multiple facets of periostin in bone metabolism. Osteoporos Int. 2012;23(4):1199-1212.
doi pubmed - Nakazeki F, Nishiga M, Horie T, Nishi H, Nakashima Y, Baba O, Kuwabara Y, et al. Loss of periostin ameliorates adipose tissue inflammation and fibrosis in vivo. Sci Rep. 2018;8(1):8553.
doi pubmed - Lu Y, Liu X, Jiao Y, Xiong X, Wang E, Wang X, Zhang Z, et al. Periostin promotes liver steatosis and hypertriglyceridemia through downregulation of PPARalpha. J Clin Invest. 2014;124(8):3501-3513.
doi pubmed - Luo Y, Qu H, Wang H, Wei H, Wu J, Duan Y, Liu D, et al. Plasma periostin levels are increased in Chinese subjects with obesity and type 2 diabetes and are positively correlated with glucose and lipid parameters. Mediators Inflamm. 2016;2016:6423637.
doi pubmed - Bolton K, Segal D, McMillan J, Sanigorski A, Collier G, Walder K. Identification of secreted proteins associated with obesity and type 2 diabetes in Psammomys obesus. Int J Obes (Lond). 2009;33(10):1153-1165.
doi pubmed - Yang Z, Zhang H, Niu Y, Zhang W, Zhu L, Li X, Lu S, et al. Circulating periostin in relation to insulin resistance and nonalcoholic fatty liver disease among overweight and obese subjects. Sci Rep. 2016;6:37886.
doi pubmed - Singh RG, Yoon HD, Poppitt SD, Plank LD, Petrov MS. Ectopic fat accumulation in the pancreas and its biomarkers: a systematic review and meta-analysis. Diabetes Metab Res Rev. 2017;33(8).
doi pubmed - Singh RG, Yoon HD, Wu LM, Lu J, Plank LD, Petrov MS. Ectopic fat accumulation in the pancreas and its clinical relevance: a systematic review, meta-analysis, and meta-regression. Metabolism. 2017;69:1-13.
doi pubmed - Petrov MS. Harnessing analytic morphomics for early detection of pancreatic cancer. Pancreas. 2018;47(9):1051-1054.
doi pubmed - Sreedhar UL, DeSouza SV, Park B, Petrov MS. A systematic review of intra-pancreatic fat deposition and pancreatic carcinogenesis. J Gastrointest Surg. 2019.
doi pubmed - Sun J, Ni Q, Xie J, Xu M, Zhang J, Kuang J, Wang Y, et al. Beta cell dedifferentiation in T2D patients with adequate glucose control and non-diabetic chronic pancreatitis. J Clin Endocrinol Metab. 2019;104:83-94.
doi pubmed - van Raalte DH, van der Zijl NJ, Diamant M. Pancreatic steatosis in humans: cause or marker of lipotoxicity? Curr Opin Clin Nutr Metab Care. 2010;13(4):478-485.
doi pubmed - Sankaran SJ, Xiao AY, Wu LM, Windsor JA, Forsmark CE, Petrov MS. Frequency of progression from acute to chronic pancreatitis and risk factors: a meta-analysis. Gastroenterology. 2015;149(6):1490-1500 e1491.
doi pubmed - DeSouza SV, Priya S, Cho J, Singh RG, Petrov MS. Pancreas shrinkage following recurrent acute pancreatitis: an MRI study. Eur Radiol. 2019;29(7):3746-3756.
doi pubmed - Petrov MS. Panorama of mediators in postpancreatitis diabetes mellitus. Curr Opin Gastroenterol. 2020;36(9):443-451.
doi pubmed - Petrov MS. Metabolic trifecta after pancreatitis: exocrine pancreatic dysfunction, altered gut microbiota, and new-onset diabetes. Clin Transl Gastroenterol. 2019;10(10):e00086.
doi pubmed - Cho J, Scragg R, Pandol SJ, Petrov MS. Exocrine pancreatic dysfunction increases the risk of new-onset diabetes mellitus: results of a nationwide cohort study. Clin Transl Sci. 2020.
doi pubmed - Martinelli P, Canamero M, del Pozo N, Madriles F, Zapata A, Real FX. Gata6 is required for complete acinar differentiation and maintenance of the exocrine pancreas in adult mice. Gut. 2013;62(10):1481-1488.
doi pubmed - Cho J, Scragg R, Petrov MS. Postpancreatitis diabetes confers higher risk for pancreatic cancer than type 2 diabetes: results from a nationwide cancer registry. Diabetes Care. 2020.
doi pubmed - Cho J, Scragg R, Petrov MS. Use of insulin and the risk of progression of pancreatitis: a population-based cohort study. Clin Pharmacol Ther. 2020;107(3):580-587.
doi pubmed - Blackett PR, Sanghera DK. Genetic determinants of cardiometabolic risk: a proposed model for phenotype association and interaction. J Clin Lipidol. 2013;7(1):65-81.
doi pubmed
This article is distributed under the terms of the Creative Commons Attribution Non-Commercial 4.0 International License, which permits unrestricted non-commercial use, distribution, and reproduction in any medium, provided the original work is properly cited.
Journal of Clinical Medicine Research is published by Elmer Press Inc.