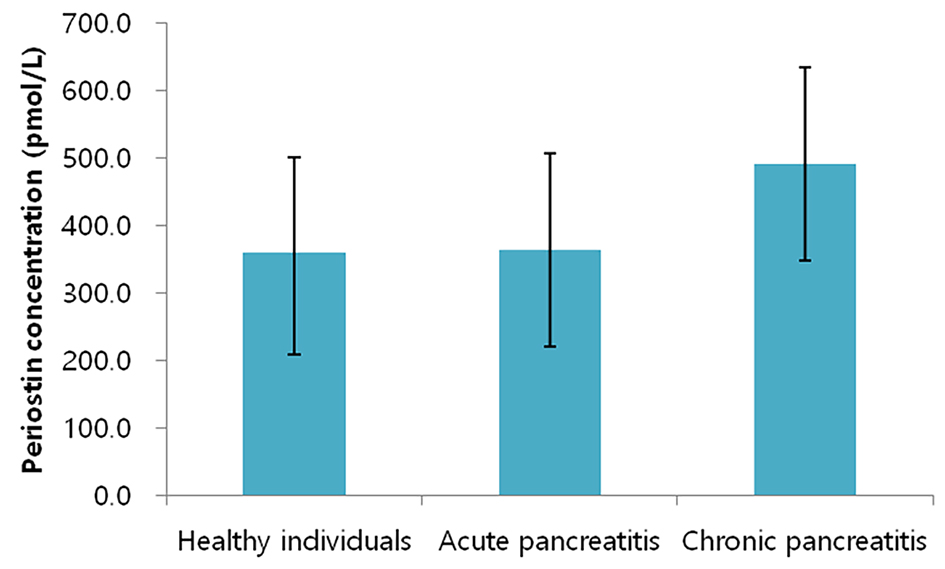
Figure 1. Periostin levels in the study groups. Bars represent mean values whereas whiskers represent two standard deviations.
| Journal of Clinical Medicine Research, ISSN 1918-3003 print, 1918-3011 online, Open Access |
| Article copyright, the authors; Journal compilation copyright, J Clin Med Res and Elmer Press Inc |
| Journal website https://www.jocmr.org |
Original Article
Volume 12, Number 9, September 2020, pages 568-578
Chronic Pancreatitis Is Characterized by Elevated Circulating Periostin Levels Related to Intra-Pancreatic Fat Deposition
Figures
Tables
| Healthy controls (n = 37) | Acute pancreatitis (n = 75) | Chronic pancreatitis (n = 9) | Pa | |
|---|---|---|---|---|
| Data are presented as mean ± standard deviation or percentage. Triglycerides, total cholesterol, HDL cholesterol, LDL cholesterol, insulin, HOMA-IR, HOMA-ß, and pancreatic amylase data were log-transformed. aP values were from one-way ANOVA. *Statistically significant values (P less than 0.05). HDL: high-density lipoprotein; LDL: low-density lipoprotein; HbA1c: hemoglobin A1c; HOMA-ß: homeostatic model assessment of ß-cell function; HOMA-IR: homeostatic model assessment of insulin resistance; ANOVA: analysis of variance. | ||||
| Age (years) | 48.6 ± 17.4 | 53.7 ± 14.8 | 54.3 ± 9.9 | 0.229 |
| Men, n (%) | 18 (28.6) | 51 (68.0) | 7 (77.8) | 0.086 |
| Body mass index (kg/m2) | 25.6 ± 5.4 | 29.5 ± 6.4 | 27.6 ± 5.5 | 0.006* |
| Triglycerides (mmol/L) | 1.2 ± 0.8 | 2.3 ± 3.1 | 2.2 ± 1.5 | 0.001* |
| Total cholesterol (mmol/L) | 4.6 ± 1.2 | 4.8 ± 1.3 | 5.1 ± 1.1 | 0.459 |
| HDL cholesterol (mmol/L) | 1.3 ± 0.5 | 1.3 ± 0.4 | 1.5 ± 0.6 | 0.353 |
| LDL cholesterol (mmol/L) | 2.8 ± 0.9 | 2.6 ± 1.0 | 2.5 ± 1.0 | 0.611 |
| HbA1c (mmol/mol) | 33.1 ± 3.2 | 40.5 ± 11.2 | 45.7 ± 12.9 | < 0.001* |
| Insulin (mIU/L) | 11.8 ± 8.0 | 16.8 ± 35.6 | 15.8 ± 14.1 | 0.707 |
| HOMA-IR (mIU/L·mmol/L) | 2.6 ± 2.0 | 4.4 ± 8.2 | 5.7 ± 4.9 | 0.132 |
| HOMA-β (mIU/L·mmol/L) | 50.1 ± 30.4 | 55.3 ± 143.6 | 37.4 ± 35.9 | 0.353 |
| Pancreatic amylase (U/L) | 29.0 ± 16.0 | 26.8 ± 17.3 | 23.4 ± 8.5 | 0.517 |
| Ever-smokers, n (%) | 18 (48.6) | 66 (88.0) | 7 (77.8) | 0.109 |
| Alcohol consumption (g/week) | 54.8 ± 69.4 | 112.1 ± 195.7 | 312.1 ± 298.6 | 0.002* |
| Fat phenotype | Overalla | Chronic pancreatitis vs. acute pancreatitisb | Chronic pancreatitis vs. healthy controlsb | Acute pancreatitis vs. healthy controlsb |
|---|---|---|---|---|
| Data are presented as P values. Model 2: adjusted for age and sex; Model 3: adjusted for age, sex, body mass index, and triglycerides; Model 4: adjusted for age, sex, body mass index, triglycerides, and HbA1c; Model 5: adjusted for age, sex, body mass index, triglycerides, HbA1c, alcohol consumption, and smoking status. aOverall P values were from one-way ANOVA in model 1 (unadjusted) and one-way ANCOVA in models 2 - 5 (adjusted as described above). bFisher’s least significant difference method was used. *Statistically significant values (P less than 0.05). HbA1c: hemoglobin A1c; ANOVA: analysis of variance; ANCOVA: analysis of covariance. | ||||
| Intra-pancreatic fat (%) | ||||
| Model 1 | < 0.001* | 0.050 | < 0.001* | 0.001* |
| Model 2 | 0.001* | 0.053 | 0.001* | 0.004* |
| Model 3 | 0.008* | 0.021* | 0.002* | 0.104 |
| Model 4 | 0.010* | 0.021* | 0.002* | 0.102 |
| Model 5 | 0.037* | 0.034* | 0.011* | 0.248 |
| Liver fat (%) | ||||
| Model 1 | 0.687 | 0.858 | 0.795 | 0.388 |
| Model 2 | 0.756 | 0.822 | 0.872 | 0.462 |
| Model 3 | 0.759 | 0.133 | 0.036 | 0.166 |
| Model 4 | 0.708 | 0.759 | 0.883 | 0.421 |
| Model 5 | 0.553 | 0.931 | 0.504 | 0.287 |
| Skeletal muscle fat (%) | ||||
| Model 1 | 0.314 | 0.572 | 0.228 | 0.190 |
| Model 2 | 0.381 | 0.396 | 0.196 | 0.327 |
| Model 3 | 0.081 | 0.169 | 0.034 | 0.117 |
| Model 4 | 0.058 | 0.182 | 0.028 | 0.069 |
| Model 5 | 0.107 | 0.262 | 0.052 | 0.097 |
| Visceral fat (cm3) | ||||
| Model 1 | < 0.001* | 0.101 | < 0.001* | < 0.001* |
| Model 2 | < 0.001* | 0.163 | 0.001* | < 0.001* |
| Model 3 | 0.011* | 0.027 | 0.003* | 0.083 |
| Model 4 | 0.009* | 0.001* | < 0.001* | 0.035* |
| Model 5 | 0.020* | 0.033* | 0.005* | 0.107 |
| Subcutaneous fat (cm3) | ||||
| Model 1 | 0.090 | 0.524 | 0.598 | 0.030* |
| Model 2 | 0.011* | 0.695 | 0.220 | 0.003* |
| Model 3 | 0.447 | 0.680 | 0.213 | 0.759 |
| Model 4 | 0.272 | 0.909 | 0.108 | 0.432 |
| Model 5 | 0.118 | 0.105 | 0.041* | 0.072 |
| Fat phenotype | Healthy controls | Acute pancreatitis | Chronic pancreatitis | ||||||
|---|---|---|---|---|---|---|---|---|---|
| β | SE | P | β | SE | P | β | SE | P | |
| Data are presented as β coefficients, standard errors, and P values (from linear regression). *Statistically significant values (P less than 0.05). SE: standard errors. | |||||||||
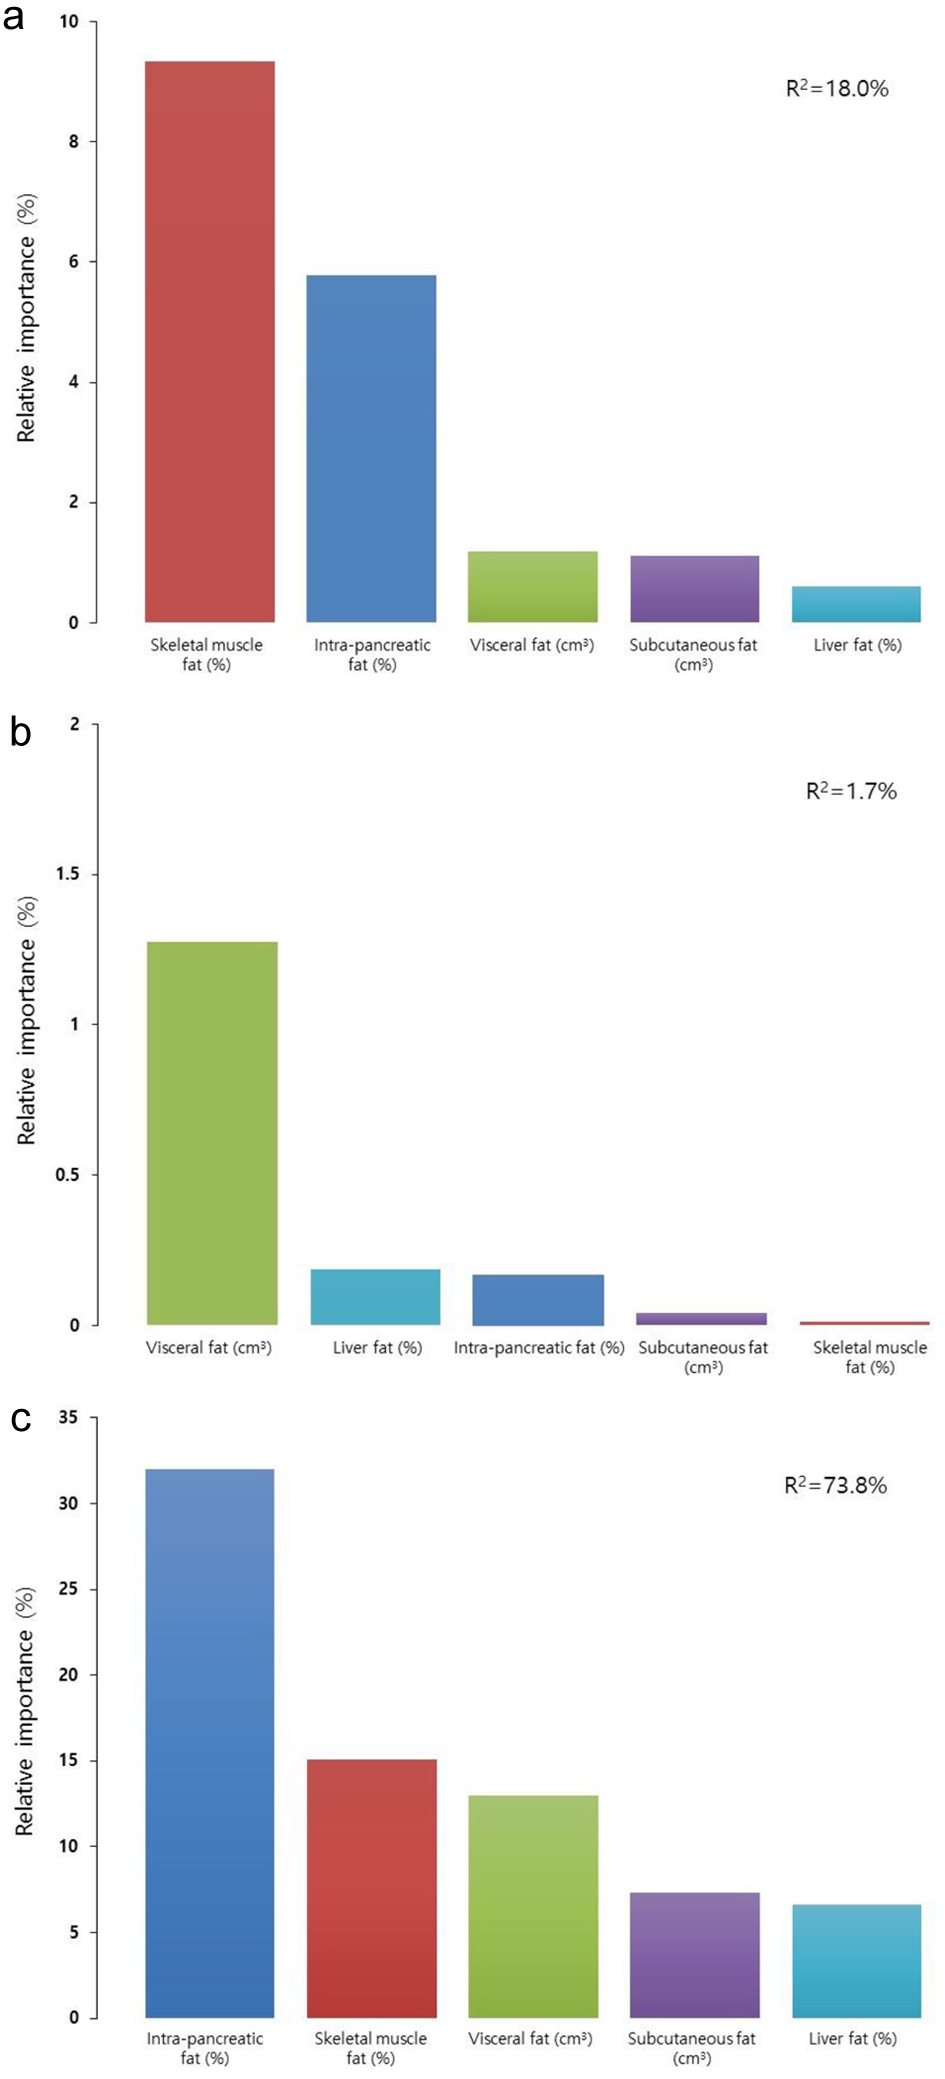
| Intra-pancreatic fat (%) | -14.491 | 12.205 | 0.244 | -0.012 | 9.549 | 0.999 | 49.627 | 18.875 | 0.034* |
| Liver fat (%) | -0.195 | 3.523 | 0.956 | -0.417 | 1.698 | 0.807 | -6.517 | 7.564 | 0.422 |
| Skeletal muscle fat (%) | 5.924 | 3.582 | 0.107 | -0.046 | 2.816 | 0.987 | 12.328 | 8.619 | 1.430 |
| Visceral fat (cm3) | -0.020 | 0.018 | 0.522 | 0.001 | 0.012 | 0.342 | 0.050 | 0.029 | 0.308 |
| Subcutaneous fat (cm3) | -0.004 | 0.030 | 0.840 | 0.015 | 0.016 | 0.923 | 0.044 | 0.030 | 0.123 |