

| Journal of Clinical Medicine Research, ISSN 1918-3003 print, 1918-3011 online, Open Access |
| Article copyright, the authors; Journal compilation copyright, J Clin Med Res and Elmer Press Inc |
| Journal website http://www.jocmr.org |
Original Article
Volume 7, Number 2, February 2015, pages 83-90
Variations in Respiratory Excretion of Carbon Dioxide Can Be Used to Calculate Pulmonary Blood Flow
David A. Preissa, Takafumi Azamib, Richard D. Urmanc, d
aDepartment of Anesthesia, Critical Care, and Pain Medicine, Harvard Medical School/Massachusetts General Hospital, Boston, MA, USA
bDepartment of Pathophysiology and Anesthesia, Nagoya City University School of Nursing, Nagoya City, Japan
cDepartment of Anesthesia, Perioperative and Pain Medicine, Harvard Medical School/Brigham and Women’s Hospital, Boston, MA, USA
dCorresponding Author: Richard D. Urman, Department of Anesthesiology, Critical Care and Pain Medicine, Brigham and Women’s Hospital/Harvard Medical School, Boston, MA 02115, USA
Manuscript accepted for publication October 01, 2014
Short title: Respiratory Excretion of CO2
doi: http://dx.doi.org/10.14740/jocmr1979w
| Abstract | ▴Top |
Background: A non-invasive means of measuring pulmonary blood flow (PBF) would have numerous benefits in medicine. Traditionally, respiratory-based methods require breathing maneuvers, partial rebreathing, or foreign gas mixing because exhaled CO2 volume on a per-breath basis does not accurately represent alveolar exchange of CO2. We hypothesized that if the dilutional effect of the functional residual capacity was accounted for, the relationship between the calculated volume of CO2 removed per breath and the alveolar partial pressure of CO2 would be reversely linear.
Methods: A computer model was developed that uses variable tidal breathing to calculate CO2 removal per breath at the level of the alveoli. We iterated estimates for functional residual capacity to create the best linear fit of alveolar CO2 pressure and CO2 elimination for 10 minutes of breathing and incorporated the volume of CO2 elimination into the Fick equation to calculate PBF.
Results: The relationship between alveolar pressure of CO2 and CO2 elimination produced an R2 = 0.83. The optimal functional residual capacity differed from the “actual” capacity by 0.25 L (8.3%). The repeatability coefficient leveled at 0.09 at 10 breaths and the difference between the PBF calculated by the model and the preset blood flow was 0.62 ± 0.53 L/minute.
Conclusions: With variations in tidal breathing, a linear relationship exists between alveolar CO2 pressure and CO2 elimination. Existing technology may be used to calculate CO2 elimination during quiet breathing and might therefore be used to accurately calculate PBF in humans with healthy lungs.
Keywords: Pulmonary blood flow; Cardiac output; Carbon dioxide elimination; End-tidal carbon dioxide
| Introduction | ▴Top |
A clinician’s ability to determine a patient’s cardiac output is critical in the assessment of cardiopulmonary health. Clinically, this measurement can be required intermittently during surgery, as well as post-operatively. Cardiac output may also be measured in research settings, but doing so with invasive methods requires expensive critical care equipment, trained personnel, a sterile environment and readily available resuscitative equipment.
Cardiac output is arguably one of the most important parameters reflecting cardiovascular health and yet its measurement is currently limited to patients with Swan-Ganz catheters in the operating room, critical and intensive care units. To date, no non-invasive method has proven itself comparable to thermodilution in accuracy, repeatability, and in physiological soundness [1, 2]. Nevertheless, the thermodilution method is plagued with limitations in clinical practice, the most important ones being associated with its invasiveness [3].
Methods for measuring cardiac output non-invasively can be classified as respiratory-based or non-respiratory-based. The latter, which includes Doppler (external, transtracheal and transesophageal), bioimpedance, and pulse contour analysis, has not yet been accepted into clinical practice because of either theoretical or practical limitations [4]. Additionally, there are some respiratory-based methods that utilize foreign gas breathing, including argon and acetylene, but these methods require a source of external gas, are impractical in many settings, and will not be dealt with in detail here [5].
The respiratory-based methods are the oldest, the most physiologically sound, and traditionally the most accepted method of cardiac output measurement. Their principles and assumptions are well understood as are their limitations, the most important of which is that they more accurately measure pulmonary blood flow (PBF) rather than cardiac output. Originally described for oxygen, Fick equation, developed in the late 1800s, is based on the measurement of elements of the mass balance across the lungs [6]. The following is the equivalent equation describing the movement of carbon dioxide (CO2):
Eq. 1: PBF = VCO2/(CvCO2 - CaCO2)
where PBF is the pulmonary blood flow, VCO2 is the metabolic CO2 production, and CvCO2 and CaCO2 are the concentrations of CO2 in the blood entering (mixed venous, v) and leaving (arterial, a) the lungs respectively. To keep the method purely non-invasive, alveolar pressure is conventionally used as a surrogate for content. The relationship between PaCO2 and CaCO2 is usually assumed to be linear in the physiologic range, and through previous in-vitro, CO2 content of oxygenated blood can be estimated using the following equation [7, 8]:
Eq. 2: Content = 4 × Pressure + 260
Generally, PaCO2 is approximated from alveolar CO2 pressure (PACO2), which in turn is approximated from end-tidal CO2 pressure (PETCO2). Mixed venous pressure of CO2 (PvCO2) however, is difficult to obtain non-invasively, and has classically posed the biggest challenge to measurement of PBF. Respiratory maneuvers such as breathholding and rapid equilibration with external reservoirs have been employed to estimate PvCO2, but these have the disadvantage of requiring an external supply of CO2, and may pose a challenge to patients with respiratory compromise [9]. Single-breath methods have been presented, but none has proven itself repeatable and accurate.
In 1980, a novel method of calculating PBF without the need for measuring CvCO2 was described by Gedeon et al [9]. That method demonstrated that if a subject’s alveolar ventilation (VA) were acutely and transiently reduced, a step change in PACO2 and VCO2 would result (once steady state is reached, after a few breaths). At this point, assuming PBF and PvCO2 had not changed in this short time (< 30 - 45 s), two Fick equations could be applied to the model:
Eq. 3a: PBF = VCO2/(S × PvCO2 - S × PACO2)
Eq. 3b: PBF = VCO2’/(S × PvCO2 - S × PACO2’)
where VCO2’ and PACO2’ are the exhaled CO2 volumes and alveolar CO2 pressures after a new steady state has occurred, respectively, and S is a conversion constant to content. Since PvCO2 and PBF remain unchanged with this maneuver, these equations together yield a single equation:
Eq. 4: PBF = (VCO2 - VCO2’)/(S × PACO2’ - S × PACO2)
This way, a small, temporary change in VA can be used to calculate PBF without the need for invasive monitors. This method has been proven reliable in intubated patients by multiple studies [10-12].
Creative as this method is; however, there are several limitations to it. First, the time to reach the new steady state is a function of the subject’s VA and functional residual capacity (FRC). On average, this time is approximately 30 - 45 s, or about five breaths, which means that only two data points are used to calculate PBF before recirculation of arterial blood occurs, limiting the method’s accuracy. Second, because VA is required to be transiently reduced, and because the normal variability of breathing creates noise in the measurement signal, this method is limited only to intubated patients. Finally, PACO2 must be allowed to re-equilibrate to steady state levels before a subsequent test can be performed, which may require an additional 60 - 120 s.
| Materials and Methods | ▴Top |
Flux of CO2 at the alveoli
The method proposed here redefines the term VCO2 as described in Fick’s equation. According to conventional understanding, VCO2 is defined as the excretion of CO2 past the lips, measured with a pneumotachometer and CO2 monitor. However, exhaled CO2 on a breath-by-breath basis seldom reflects actual metabolic CO2 production or pulmonary capillary excretion into the lungs [13]. Instead, an average over several breaths is required for this estimation, as the FRC acts as a reservoir for CO2. For example, a large breath that expunges a large volume of CO2 past the lips would incorrectly reflect a large “production” of CO2. The Fick equation, therefore, would be more physiologically accurate if the term VCO2 represented the continuous flux of CO2 from the blood into the alveoli (VCO2A), rather than the discrete, tidal excretion of CO2 past the lips (VCO2M). Averaged over many breaths, VCO2M will accurately reflect VCO2A.
Relationship between VCO2A and PACO2
After redefining VCO2 in this manner, it becomes clear that there exists a linear relationship between the flux of CO2 out of the blood (VCO2A) and PACO2 (Fig. 1).
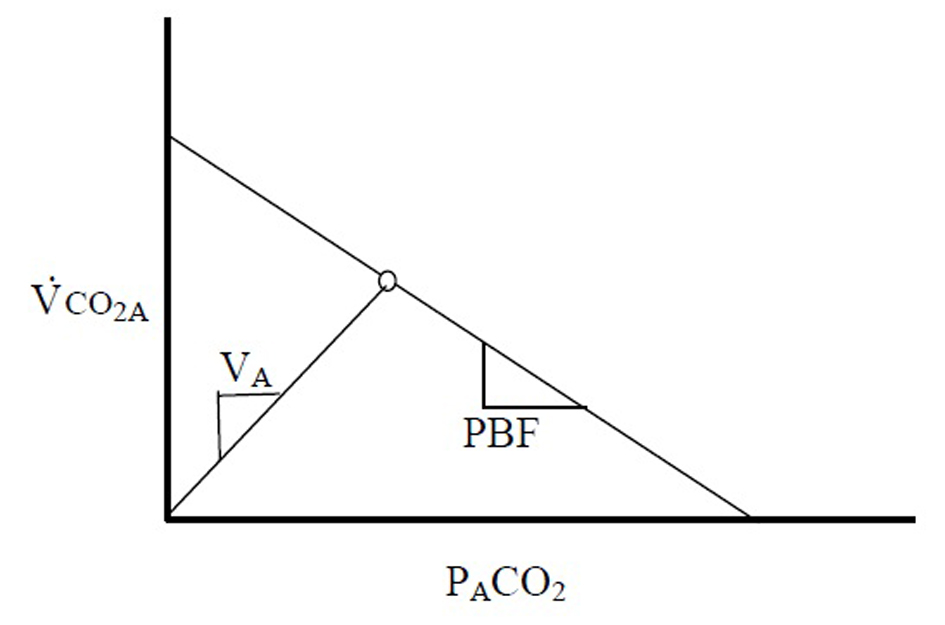 Figure 1. The relationship between VCO2A and PACO2 is linear. The slope of this line is proportional to the pulmonary blood flow. An intersecting line can be drawn from the origin following the relationship VA = VCO2 × PACO2/713. The steady state point (A) for PACO2 and VCO2A is produced by the balance of CO2 diffusion into the alveoli and the flow of blood into the pulmonary capillaries. Figure 1. The relationship between VCO2A and PACO2 is linear. The slope of this line is proportional to the pulmonary blood flow. An intersecting line can be drawn from the origin following the relationship VA = VCO2 × PACO2/713. The steady state point (A) for PACO2 and VCO2A is produced by the balance of CO2 diffusion into the alveoli and the flow of blood into the pulmonary capillaries. |
At steady state VCO2A and PACO2 produce a single point on this line. The slope of this line, PBF, is proportional to the PBF. A second theoretical line exists on this diagram, connecting the origin with the steady state point. This second line is described by the basic physiologic equation:
Eq. 5: VCO2A = VA × PACO2/713
where VA is the alveolar ventilation - the slope of the line. It becomes clear that VCO2A - not VCO2M - must be applied when describing these relationships, as washout of the FRC can confound the changes that relate these variables.
Gedeon’s method aims to use two steady state VCO2M points to determine the slope of the PBF line: one attained from the subject breathing at rest (where VCO2M only equals VCO2A if averaged over many breaths), and the second after a small change in VA (measured after 4 - 5 breaths, when, after a transient period, VCO2M is assumed to be equal to VCO2A). In an extreme case, if the breath were held for 30 s and a new steady state were reached, PACO2 would be equal to PvCO2, or the x-intercept (Fig. 2). This method can only measure two points because after 4 - 5 breaths of breathing at a second VA, recirculation would alter PvCO2. However, if VCO2A can be measured with each breath, one data point along this line could be produced with each exhalation, and the slope, PBF could be calculated with sequential breaths. Variations in VCO2A are needed to explore this line, and the slope of the second line, VA, would vary with each breath due to normal variations in tidal volume and respiratory frequency. Since VCO2A likely fluctuates little during quiet breathing (as opposed to VCO2M), variability of breathing, which was once the system “noise”, therefore becomes important for measurement of PBF.
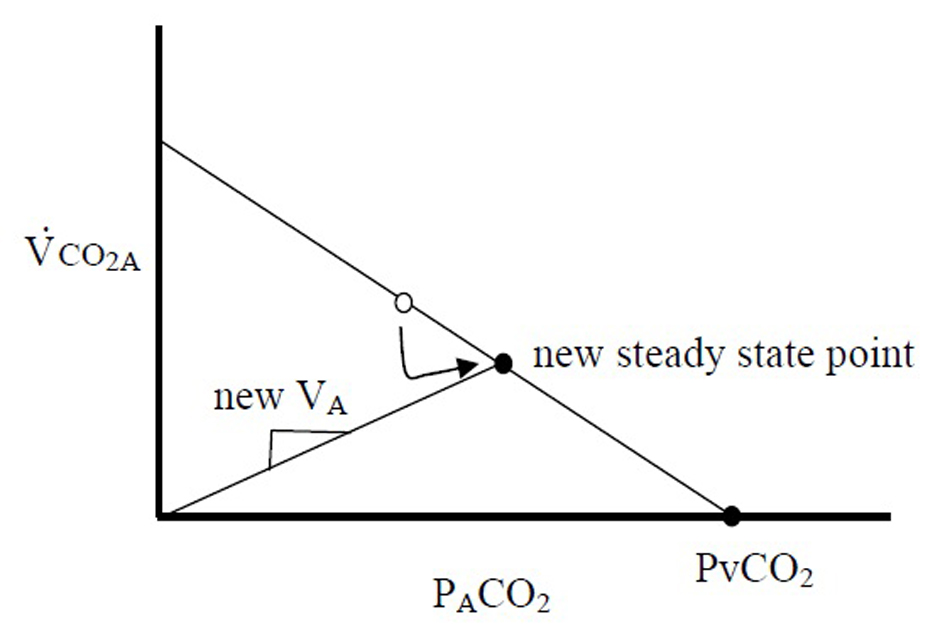 Figure 2. Gedeon’s method of reducing VA for several breaths acutely increases PACO2 and reduces VCO2A creating a new steady state point on the same line. Point A and point B can be used together to calculate the slope of the line, which is the pulmonary blood flow. Figure 2. Gedeon’s method of reducing VA for several breaths acutely increases PACO2 and reduces VCO2A creating a new steady state point on the same line. Point A and point B can be used together to calculate the slope of the line, which is the pulmonary blood flow. |
Once this line is observed over multiple breaths, PBF can be calculated by extrapolating to the x-intercept, PvCO2, and calculating PBF using equation 1.
Method for calculating VCO2A
The method described above requires calculation of the VCO2A, the flux of CO2 across the alveolar membrane. Calculation for VCO2A has been described thoroughly elsewhere [13]. Briefly, a simple mass balance dictates that the flux of CO2 into the alveoli from the blood is related to the flux of CO2 at the mouth and the change of CO2 stores in the lung:
Eq. 6: VCO2A = VCO2M - ΔVCO2S
where VCO2A is the alveolar flux of CO2, VCO2M is the flux of CO2 at the mouth, and ΔVCO2S is the change in lung stores of CO2. VCO2M is easily measured using a metabolic cart, which integrates exhaled CO2 concentration and expiratory flow.
The change in lung stores of CO2 from breath 1 to breath 2, ΔVCO2S, can be described as the sum of two terms describing the change in CO2 concentration at a constant VA, and the change in VA at a constant CO2 concentration:
Eq. 7: ΔVCO2S = VA(PACO2’ - PACO2)/713 + PACO2’ΔVA
where ΔVCO2S is the change in alveolar stores of CO2, VA,1 is the alveolar volume at the end of breath 1, PACO2 and PACO2’ are the fractions of CO2 in the alveoli at the end of breaths 1 and 2, respectively and ΔVA is the change in alveolar volume from breath 1 to breath 2.
Computer simulation
For this study, a computer simulation of tidal breathing was designed to test the theory under ideal conditions using Microsoft Excel 2003 (Redmond, Washington, USA). Incremental calculations of lung CO2 volume were made for each 0.001 min. Tidal breathing was simulated using variable inhaled and exhaled tidal volumes (±30%), allowing lung volume to return to a different FRC with each breath. Complete alveolar mixing was assumed, inspiratory and expiratory times were equal, inhalation and exhalation flows were linear, and alveolar dead-space and shunt were assumed to be minimal. PACO2 was recorded once per breath (the final PACO2 value at the end of exhalation) and VCO2M was calculated at the mouth during exhalation. The model was run over a period of 10 min (100 breaths), and PACO2, VCO2M, Vt-in and Vt-out were recorded with each breath. VA for sequential breaths was calculated as VA’ = VA + Vt-in - Vt-out, where Vt-in and Vt-out are inhaled tidal volume and exhaled tidal volume, respectively. Detailed parameters are outlined in Table 1.
| Table 1. The Parameters Used in the Mathematical Model |
PACO2-ave versus PETCO2
As stated above, the diffusion of CO2 across the alveolar membrane should form a linear relationship with the pressure of CO2 in the alveoli. Therefore, measurements of PETCO2, a single sample taken at the end of exhalation, would be inappropriate to use in equation 3 since it reflects an end-expiration value rather than an average (PACO2-ave). In the computer model, an average PACO2 is easy to calculate, but this is not the case clinically, when PETCO2 samples are the only measurements readily available non-invasively. To estimate PACO2-ave for a single breath using only non-invasive data, we back-calculated to the PACO2 that might exist at peak inhalation and averaged this with PETCO2. The PACO2 at peak inhalation might be estimated as:
Eq. 8: (Volume of CO2 in Lung at End-Exhalation - Volume of CO2 Diffused during Exhalation + Exhaled Volume of CO2) × 713/Peak Alveolar Volume
Averaging this value with PETCO2 may produce a reasonable estimate of PACO2-ave which can be applied in equation 1.
Calculation of VCO2A
VCO2S was calculated using equation 6 using sequential breaths, ΔVA was assumed to be measurable without the need for nitrogen monitors (Vt-in and Vt-out were measurable), and VA was initially assumed to be 3 L. VCO2A was then calculated using equation 5. Using 10 min of breathing data, when PBF and PvCO2 were assumed to be in steady state, a plot of VCO2A versus PACO2 was created and R2 was calculated for the line of best fit. FRC was then iterated in increments of 0.25 L from 2 L to 4 L to achieve the most optimal linear relationship between VCO2A and PACO2.
Real-world adjustments
To simulate real-world measurements, error was introduced into each measurement (PACO2, Vt-in, Vt-out, VCO2M, Table 1), consistent with manufacturer specifications [14] and calculation of PBF was repeated.
PBF comparisons
PBF was calculated from equation 3 using two techniques: first, using known VCO2A measurements directly from the model (PBF-preset), calculated using actual diffusion of CO2 across the alveolar membrane, and second, using VCO2M to calculate VCO2A using equation 5 (PBF-calc), which represents the strategy that might be used practically in subjects. In the either case, PBF would be calculated using equation 1 where PvCO2 was attained by extrapolating to the x-intercept of a plot relating VCO2A and PACO2-ave. We determined the appropriate number of breaths required for accurate measurement of PBF-calc, by increasing the number of breaths used to calculate the average PBF-calc until the repeatability was similar to that of thermodilution [15].
PBF-calc was assessed and evaluated using Bland-Altman analysis where the acceptable error was taken from prior established theory [16].
| Results | ▴Top |
The model for tidal ventilation produces reasonable values for PACO2 over 10 min of breathing. Sample oscillations in PACO2 and lung volume can be seen in Figure 3.
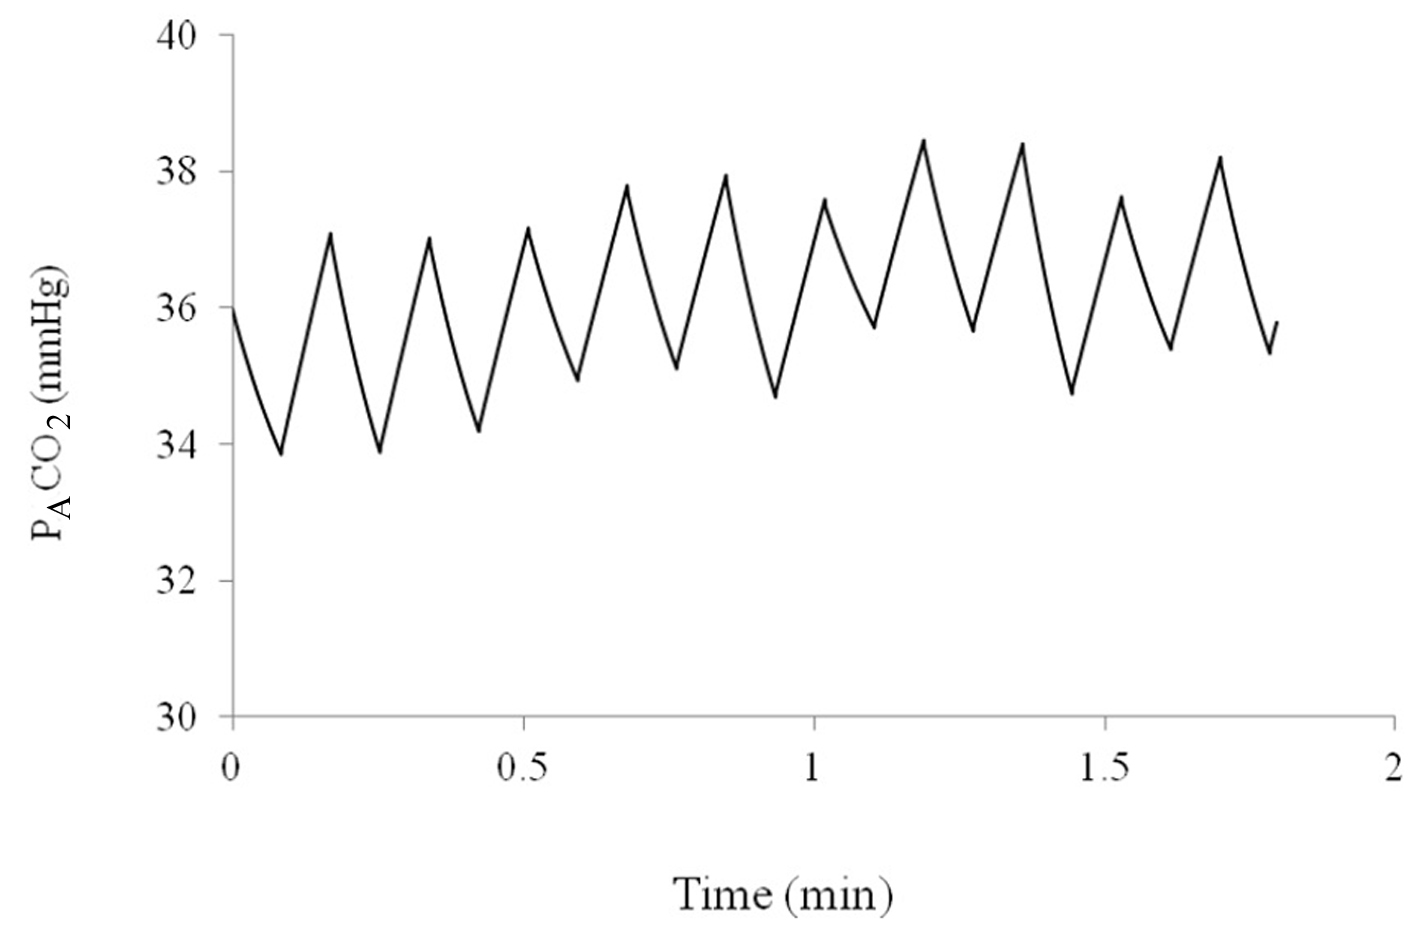 Figure 3. Alveolar partial pressure of CO2 over a period of 2 min as predicted by the computer model. Figure 3. Alveolar partial pressure of CO2 over a period of 2 min as predicted by the computer model. |
VCO2A tended to vary less over the course of 10 min of breathing than VCO2M, as can be seen in Figure 4. When VCO2A was plotted against PACO2-ave a linear relationship was revealed which was stronger than with PETCO2 (R = 0.83 versus 0.74, Fig. 5).
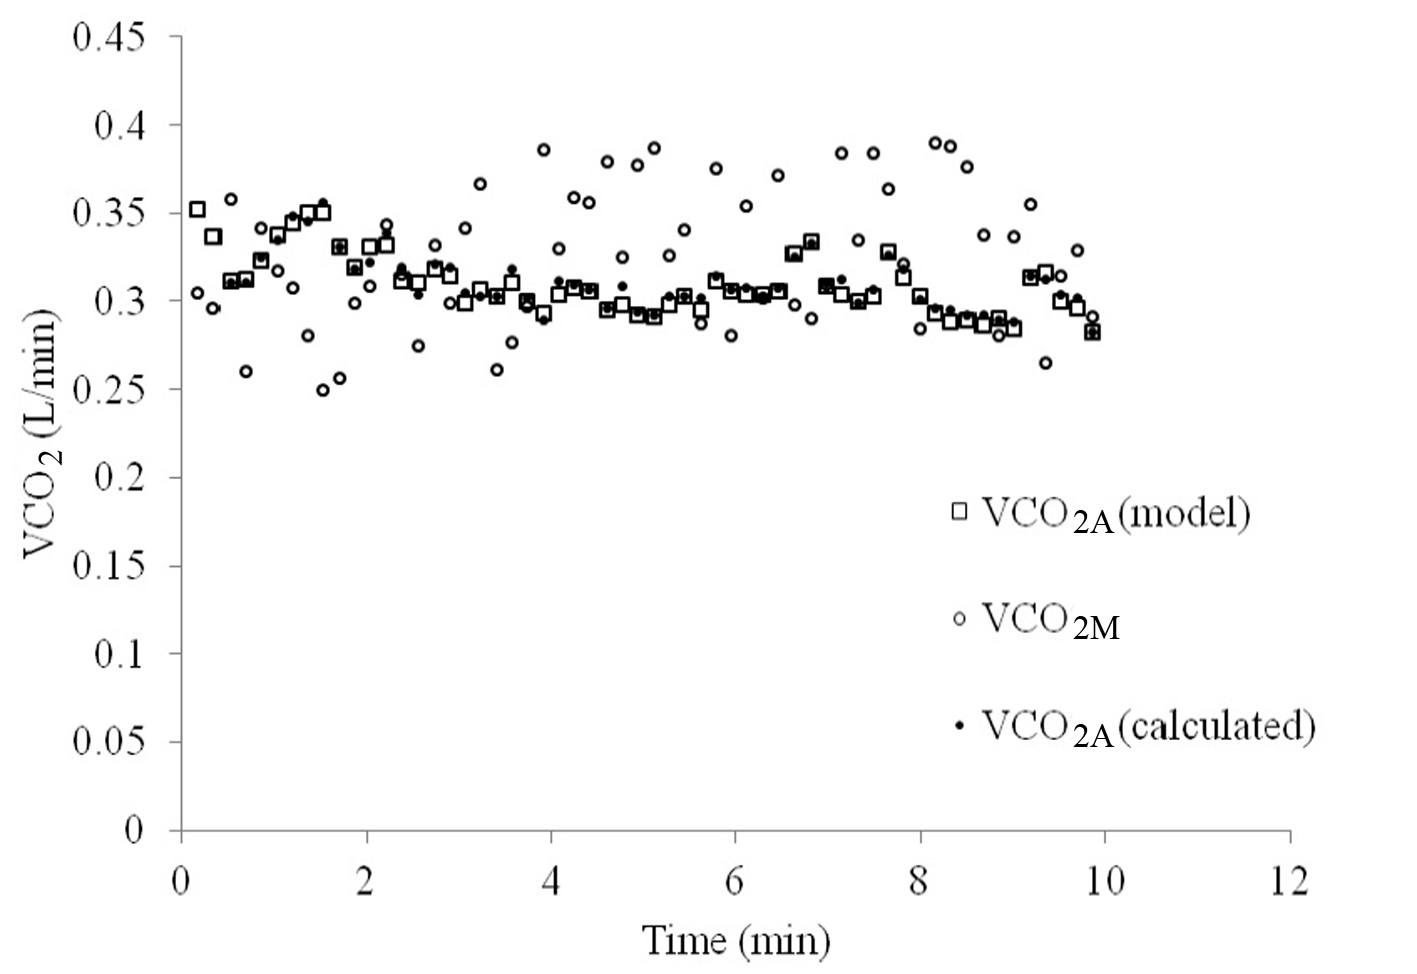 Figure 4. VCO2 over time as measured at the mouth (VCO2M, open circles), as pre-set by the model (VCO2A-model, open squares) and as calculated using the proposed method (VCO2A-calculated, closed circles). Figure 4. VCO2 over time as measured at the mouth (VCO2M, open circles), as pre-set by the model (VCO2A-model, open squares) and as calculated using the proposed method (VCO2A-calculated, closed circles). |
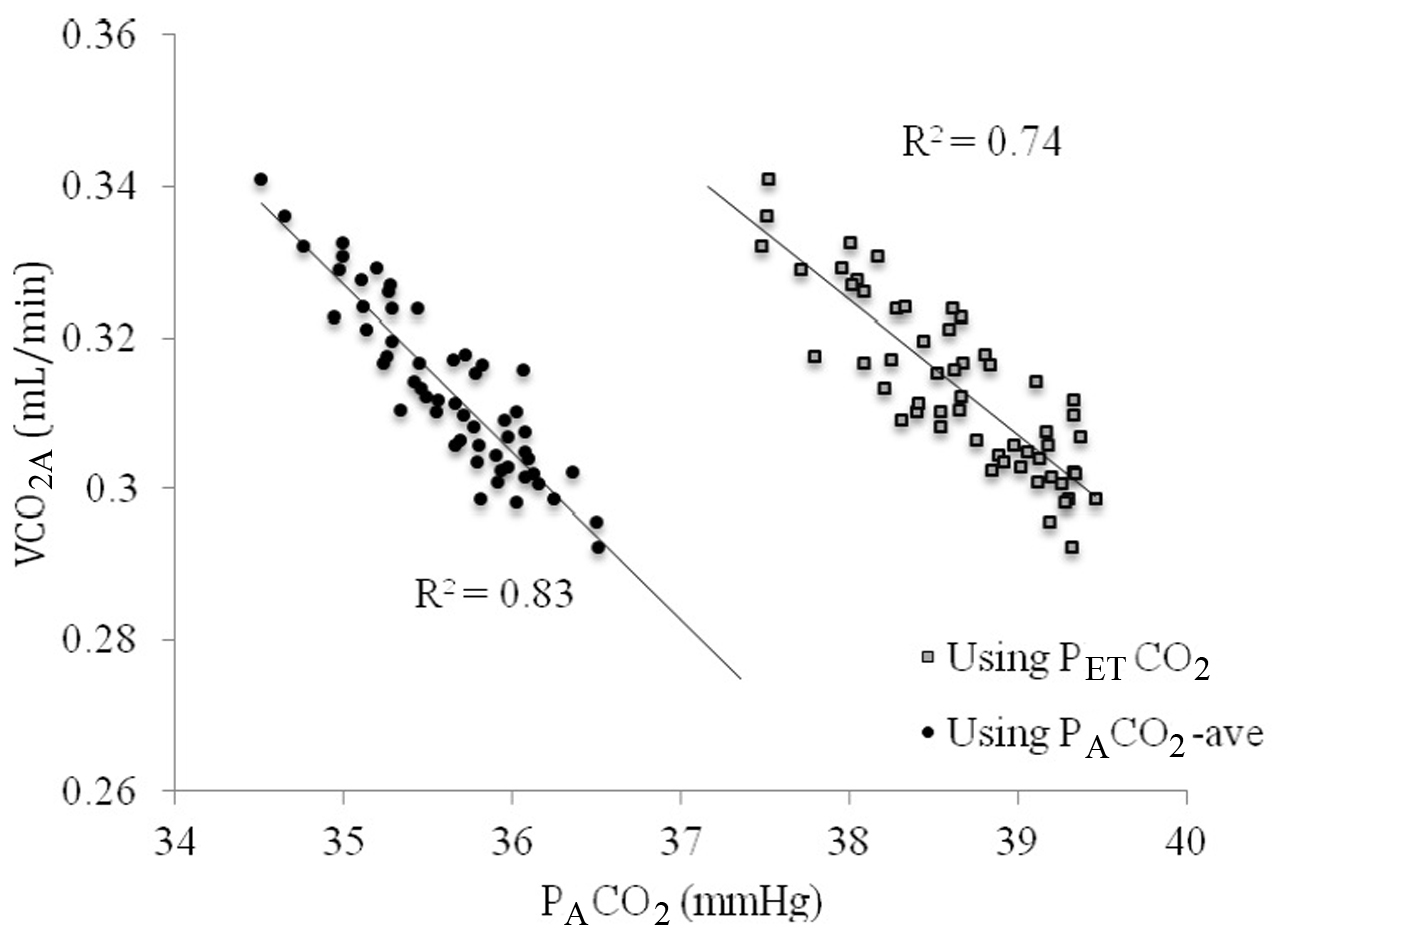 Figure 5. The relationship between VCO2A and PACO2 using end-tidal PCO2 (PETCO2, gray squares) versus time averaged CO2 across the breath (PACO2-ave, closed circles). Figure 5. The relationship between VCO2A and PACO2 using end-tidal PCO2 (PETCO2, gray squares) versus time averaged CO2 across the breath (PACO2-ave, closed circles). |
Iterating FRC demonstrated that small deviations from the model value produced poorer relationships between VCO2A and PACO2 (Fig. 6). However, the optimal FRC achieved after iterating FRC was 3.25 L, which was 0.25 L (8.3%) greater than the actual FRC used in the model. Non-optimal FRCs did not significantly reduce the accuracy of the calculated PBF, but did increase its variability.
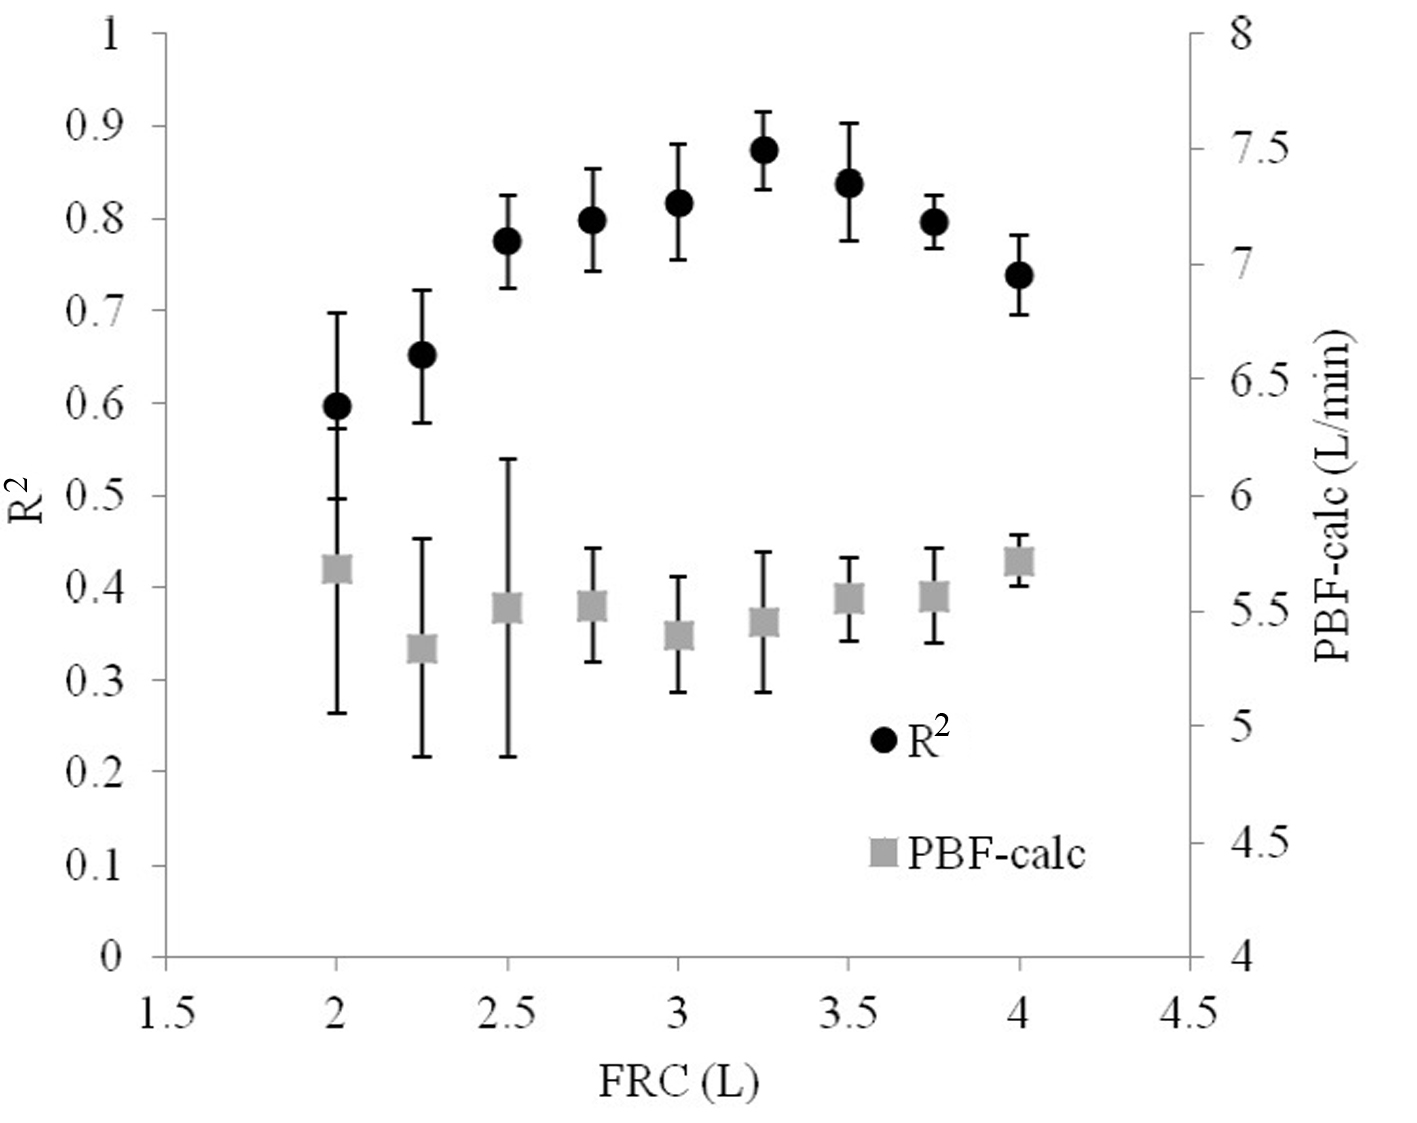 Figure 6. The R2 statistical parameter relating VCO2A to PACO2 varies depending on the original estimate of FRC. As the initial guess of FRC is increased, R2 reaches a peak, optimum point and then falls. Figure 6. The R2 statistical parameter relating VCO2A to PACO2 varies depending on the original estimate of FRC. As the initial guess of FRC is increased, R2 reaches a peak, optimum point and then falls. |
When PACO2-ave was used instead of PETCO2, the relationship was improved (R2 = 0.83 versus 0.74). PBF-calc was calculated using 10 breaths at a time (see repeatability below) by extrapolating the line in Figure 3 to the x-intercept (PvCO2) and applied into equation 1. Using this method, the difference between PBF-preset and PBF-calc was 0.62 ± 0.53 L/min.
Figure 7 shows that the repeatability coefficient fell from 1.13 to 0.09 L/min as the number of breaths used to calculate PBF-calc increased from 2 to 30. The repeatability coefficient decreased and leveled at 0.09 when approximately 10 breaths were used to average calculation for PBF-calc. The repeatability coefficient for thermodilution is likely between 0.4 and 0.6 L/min [4, 15]), which is the equivalent of using 5 - 6 breaths to average PBF-calc measurements in the proposed method.
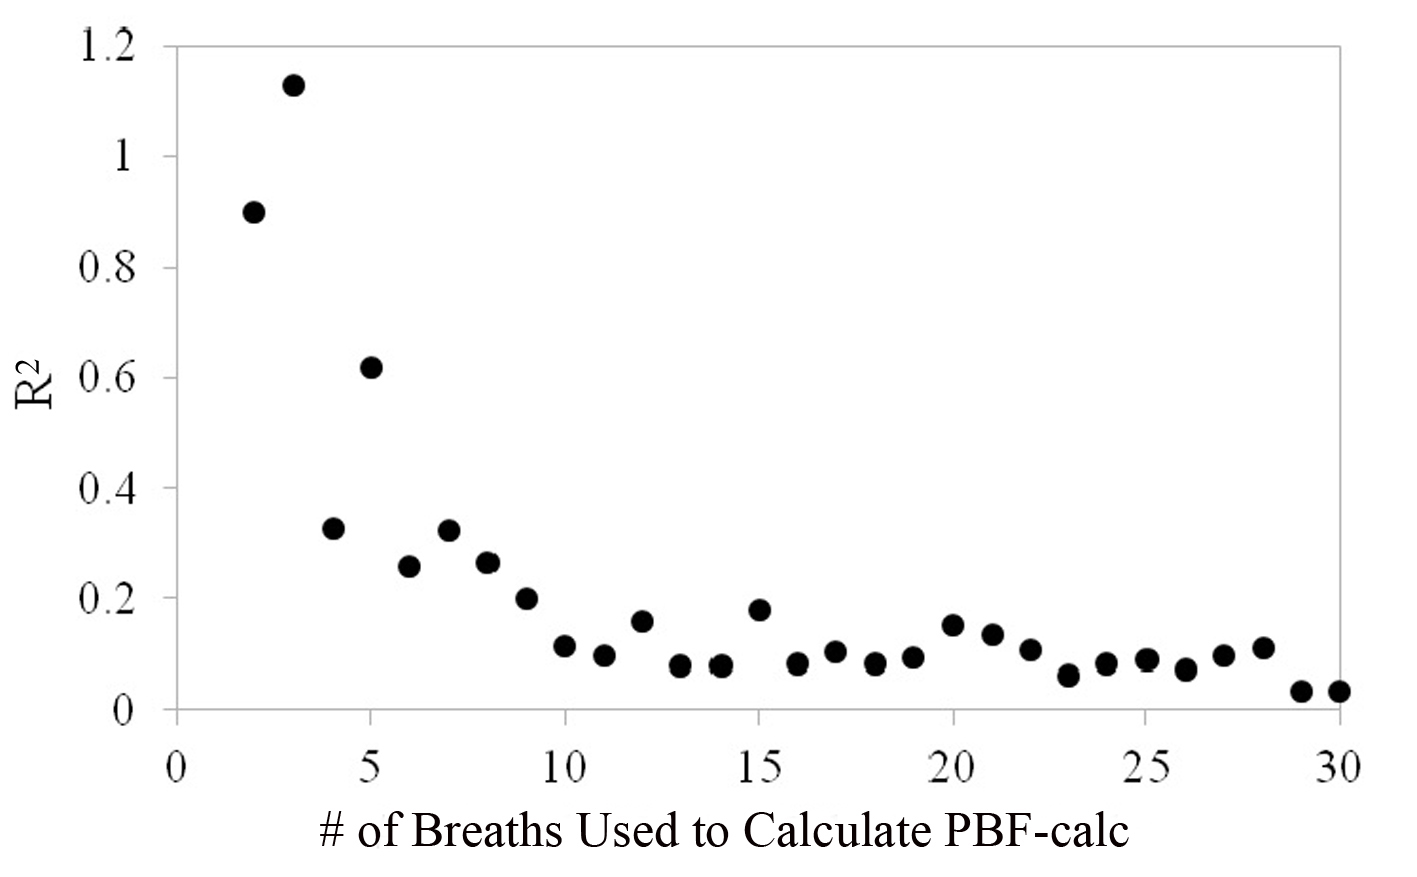 Figure 7. As few as two breaths can be used to calculate PBF but its reliability is increased as more breaths are incorporated into the calculation. Precision reaches a plateau at about 8 - 10 breaths. Figure 7. As few as two breaths can be used to calculate PBF but its reliability is increased as more breaths are incorporated into the calculation. Precision reaches a plateau at about 8 - 10 breaths. |
| Discussion | ▴Top |
The most common method for cardiac output measurement involves indicator dilution, normally dyes and temperature. A dye, or cold saline, is typically injected via an invasive catheter into the pulmonary artery and the temporal profile of the concentration of the dye or the temperature of the blood is measured downstream. The profile of the indicator change over time is used to calculate the cardiac output. Over the last three decades, there has been a steady improvement in the technology required to manufacture the catheters and thermistors, and to analyze the indicator curves and calculate the cardiac output [17]. In addition, the expertise to place the catheters and look after catheterized patients has become widespread.
Nevertheless, there are at least three drawbacks necessarily associated with these methods. First, pulmonary artery catheters are inherently invasive and have associated complications including damage to the carotid artery, subclavian artery and lung, air emboli, pneumothorax, malignant arrhythmias and heart block, rupture of right atrium, right ventricle and/or pulmonary capillary, local infection and septicaemia, and more [3]. Second, they have many associated costs as a result of the requirement for critical care areas, equipment and personnel. Third, their accuracy is questionable, and can be less reliable and helpful as required for management of critically ill patients [18]. Despite these drawbacks, thermodilution methods continue to be widely used as less invasive alternatives are not sufficiently accurate, not sufficiently robust, or too cumbersome to perform in a large variety of clinical settings [19].
In this study, a new non-invasive method of measuring PBF is introduced based on principles that are already accepted in medicine. The Fick method for measuring PBF is well established and is considered one of the most accurate techniques available. Until recently, however, the Fick technique could only be performed using blood samples despite numerous attempts to measure PvCO2 non-invasively. The method of creating a step-change in VA is the only validated non-invasive Fick method of cardiac output measurement without a special maneuver required by the patient, but can only be used on patients ventilated by a mechanical ventilator, uses only two breaths for measurement ETC. If a spontaneously breathing patient is made to rebreathe previously exhaled gas, the minute ventilation will tend to increase in order to increase the volume of air entering the lungs for gas exchange. The method presented here would require no maneuver on the part of the subject, and no foreign or compressed gases.
The method outlined here describes an original relationship between VCO2 and PACO2. Its principles are grounded in basic physiology, and its application may extend beyond that of PBF measurement. Since PACO2 relates directly to VCO2 given a specific set of conditions, other variables that may influence these parameters such as alveolar dead space, may be measureable as well.
There are several practical limitations of this method. First, this strategy for measuring PBF could not be achieved without a perfect, air-tight seal around the mouth, nose, or face. Any air lost would reduce the accuracy of Vt-in, Vt-out, or VCO2M. This may be inconvenient or impossible for some patients, depending on the presence of facial hair, anomalous anatomy, or trauma.
This model assumes that all exhaled gas had participated in exchange of CO2 with the blood. PACO2 may vary depending on differences in ventilation-to-perfusion matching throughout the lung [2, 20]. If some exhaled gas originated from alveolar dead space, PETCO2 would underestimate PACO2 and as a result, PBF-calc would overestimate PBF. The significance of this was not quantified in this study, but theoretically, it is possible that iterations of alveolar dead space estimates can be coupled with the estimates of FRC to provide an optimal relationship between PACO2 and VCO2A. Still, deviations of PETCO2 from PACO2 may also be due to incomplete breaths during exhalation and not alveolar deap space per se. This also impacts the calculation for PACO2-ave, which will also be affected by all of the above.
In this study, 10 min of breathing were permitted to achieve initial FRC estimate. At this point, it is unclear why the ideal FRC produced from the iterative process differed from that used in the model. Nevertheless, its impact on PBF-calc was marginal. Furthermore, the purpose of this extended period of breathing was to demonstrate the principle rather than practicality. Follow-up studies in humans will be required to further explore this strategy.
The real-world error in measuring Vt, PETCO2, VCO2 was based on products currently available for purchase. These will vary depending on the manufacturer and may improve in the future, making this method more practical.
The accuracy of this method for measuring PBF was similar to others that have been proposed [15]. The repeatability demonstrated that 10 breaths were needed for optimal accuracy, a time slightly greater than would be required for a complete test of thermodilution (about 30 s) depending on respiratory frequency. However, one advantage of the proposed method in this respect is that measurements for PBF are continuous, and no time is needed for “reset”, as may be needed to washout indicator from the pulmonary artery for thermodilution.
Finally, whereas the accuracy of other respiratory-based non-invasive methods may be diminished by respiratory fluctuations, the proposed method is enhanced by large changes in tidal volume and respiratory frequency. It may even be suggested that a subject ought to be encouraged to take deep breaths, or sigh to exaggerate the variability of quiet tidal breathing.
Conclusion
The study we describe here is safe, theoretically sound, and demonstrates acceptable accuracy and repeatability. It represents a potential advancement towards measurement of important cardiopulmonary parameters that may be clinically important in the management of both outpatients and those in-hospital. Further studies in humans are required to quantify and evaluate its strengths and limitations.
Acknowledgement
None.
Conflict of Interest
The authors report no conflicts of interest.
Source(s) of Support
Funding for this study was provided by internal department funds.
| References | ▴Top |
- Branthwaite MA, Bradley RD. Measurement of cardiac output by thermal dilution in man. J Appl Physiol. 1968;24(3):434-438.
pubmed - Kim TS, Rahn H, Farhi LE. Estimation of True Venous and Arterial Pco2 and Cardiac Output by Gas Analysis of a Single Breath. Techn Docum Rep Amrl-Tdr-63-103 (I). AMRL TR. 1963:58-73.
- Nadeau S, Noble WH. Limitations of cardiac output measurements by thermodilution. Can Anaesth Soc J. 1986;33(6):780-784.
doi - Wong LS, Yong BH, Young KK, Lau LS, Cheng KL, Man JS, Irwin MG. Comparison of the USCOM ultrasound cardiac output monitor with pulmonary artery catheter thermodilution in patients undergoing liver transplantation. Liver Transpl. 2008;14(7):1038-1043.
doi pubmed - Wendelboe Nielsen O, Hansen S, Christensen P, Gronlund J. Repeatability of the acetylene rebreathing method in measuring cardiac output: influence of acetylene concentration. Acta Anaesthesiol Scand. 1990;34(5):354-357.
doi pubmed - Fick A. Ueber die Messung des Blutquantums in den Herzventrikeln. Sitzungsberichte der Physiologisch Medizinosche Gesellschaft zu Wuerzburg.2.
- Levett JM, Replogle RL. Thermodilution cardiac output: a critical analysis and review of the literature. J Surg Res. 1979;27(6):392-404.
doi - Olszowka AJ, Farhi LE. A system of digital computer subroutines for blood gas calculations. Respir Physiol. 1968;4(2):270-280.
doi - Gedeon A, Forslund L, Hedenstierna G, Romano E. A new method for noninvasive bedside determination of pulmonary blood flow. Med Biol Eng Comput. 1980;18(4):411-418.
doi pubmed - Bosman RJ, Stoutenbeek CP, Zandstra DF. Non-invasive pulmonary blood flow measurement by means of CO2 analysis of expiratory gases. Intensive Care Med. 1991;17(2):98-102.
doi pubmed - Capek JM, Roy RJ. Noninvasive measurement of cardiac output using partial CO2 rebreathing. IEEE Trans Biomed Eng. 1988;35(9):653-661.
doi - Peyton PJ, Thompson D, Junor P. Non-invasive automated measurement of cardiac output during stable cardiac surgery using a fully integrated differential CO(2) Fick method. J Clin Monit Comput. 2008;22(4):285-292.
doi pubmed - Auchincloss JH, Jr., Gilbert R, Baule GH. Effect of ventilation on oxygen transfer during early exercise. J Appl Physiol. 1966;21(3):810-818.
pubmed - CareFusion I. Manufacturer Specifications. Vmax System Specifications. http://www.carefusion.com/pdf/Respiratory/Pulmonary_Function_Testing/RC1355-01_VmaxSpecsheet10.pdf. 2013.
- Critchley LA, Critchley JA. A meta-analysis of studies using bias and precision statistics to compare cardiac output measurement techniques. J Clin Monit Comput. 1999;15(2):85-91.
doi - Bland JM, Altman DG. Statistical methods for assessing agreement between two methods of clinical measurement. Lancet. 1986;1(8476):307-310.
doi - Lenfant C. Time-dependent variations of pulmonary gas exchange in normal man at rest. J Appl Physiol. 1967;22(4):675-684.
- Nishikawa T, Dohi S. Errors in the measurement of cardiac output by thermodilution. Can J Anaesth. 1993;40(2):142-153.
doi pubmed - Stetz CW, Miller RG, Kelly GE, Raffin TA. Reliability of the thermodilution method in the determination of cardiac output in clinical practice. Am Rev Respir Dis. 1982;126(6):1001-1004.
pubmed - Dubois AB. Alveolar CO2 and O2 during breath holding, expiration, and inspiration. J Appl Physiol. 1952;5(1):1-12.
pubmed
This is an open-access article distributed under the terms of the Creative Commons Attribution License, which permits unrestricted use, distribution, and reproduction in any medium, provided the original work is properly cited.
Journal of Clinical Medicine Research is published by Elmer Press Inc.