

| Journal of Clinical Medicine Research, ISSN 1918-3003 print, 1918-3011 online, Open Access |
| Article copyright, the authors; Journal compilation copyright, J Clin Med Res and Elmer Press Inc |
| Journal website http://www.jocmr.org |
Original Article
Volume 11, Number 12, December 2019, pages 825-833
Measuring Sleep Quality and Efficiency With an Activity Monitoring Device in Comparison to Polysomnography
Marc Spielmannsa, b, f, David Bostc, Wolfram Windischb, d, Peter Alterc, Tim Greulichc, Christoph Nellc, Jan Henrik Storred, Andreas Rembert Koczullac, e, Tobias Boeseltc
aPulmonary Rehabilitation, Zuercher RehaZentren Klinik Wald, Switzerland
bFaculty of Health, Department of Pneumology, University of Witten/Herdecke, Germany
cDepartment of Medicine, Pulmonary and Critical Care Medicine, University Marburg, Marburg, Germany
dDepartment of Pneumology, Cologne Merheim Hospital, Cologne, Germany
eSchoen Klinik Berchtesgadener Land, Schonau am Konigssee, Germany
fCorresponding Author: Marc Spielmanns, Department Pulmonary Medicine and Pulmonary Rehabilitation, Zuercher RehaZentrum Klinik Wald, Faltigbergstrasse 7, 8636 Wald-ZH, Switzerland
Manuscript submitted October 19, 2019, accepted November 5, 2019
Short title: Measuring Sleep With an Activity Tracker
doi: https://doi.org/10.14740/jocmr4026
| Abstract | ▴Top |
Background: Monitoring for physical activity becomes popular and actually many devices are available. Some physical activity monitors (PAMs) provide data about sleep quality for the user, but there are scarce data concerning validity and usability of these measurements. This study compared the data of sleep parameters generated by a PAM with the polysomnography (PSG).
Methods: In 2016, data of 26 patients in two consecutive PSGs as well as in two daytime and nighttime measurements with a PAM according to physical activity and sleep quality were collected. Furthermore, sleep quality, using the Pittsburgh sleep quality index (PSQI), daytime fatigue, using the multidimensional fatigue inventory (MFI-20) and additionally data of a sleep diary were collected.
Results: There were positive correlations of both methods with respect to total sleep time (TST) (r = 0.76, P < 0.01) and sleep efficiency (r = 0.71, P < 0.01). Data analysis over two nights showed that over 90% of the TST (95% confidence interval (CI) -1.59 to 0.82) and of the sleep efficiency (95% CI -8.28 to 15.51) were within the limits of agreement. The analysis of the PSQI and the sleep efficiency of the PAM showed no significant correlations. The daytime fatigue correlated negatively with the physical activity (r = -0.72, P < 0.01).
Conclusion: The sleep efficiency and TST measured with the PAM sufficiently reflect the PSG sleep parameters and the subjects’ subjective feelings. At the same time, PAM results are also correlated with the subjectively perceived quality of sleep. Further investigations to assess the long-term results are pending.
Keywords: Activity monitoring; Polysomnography; Sleep quality; Sleep efficiency
| Introduction | ▴Top |
The interest in sleep and sleep quality has grown strongly among the population in recent years. Sleep is not only essential for the optimal performance of physical, cognitive and emotional processes but also a vital biological determinant of everyday health and well-being [1]. For athletes in particular, the connections between memory consolidation, newly learned training techniques (training optimization) and increased competitive performance through restful sleep seem to be of importance and are making sleep quality increasingly the focus of new research questions [2].
Otherwise studies have shown that prolonged or shortened sleep is associated with an increased risk of morbidity and mortality [3-5]. For example, recent research suggests that a lack of restorative sleep can affect neurological processes. A study by Lim et al described that good sleep quality could also have a protective effect on cognitive functions in older people. In addition, the risk of developing Alzheimer’s dementia should be minimized [6].
Actigraphy is based on the assumption that people move most during wake states with a progressive reduction in motion as they approach the deepest stages of sleep, such that sleep/wake states may be discriminated by measuring and analyzing these movements [7]. Current devices for measuring physical activity (physical activity monitors (PAMs)) are worn like watches on the wrist or are attached to the belt and provide information not only about physical activity but also about the quality of sleep. The patient’s movement is recorded in fixed time intervals (epochs) over seconds to several minutes and processed and stored by an algorithm via a microchip processor. The evaluation of these data makes statements possible to the sleep-wake rhythm of the user, whereby the equipment evaluates an epoch without movement as “sleep” or with movement as “awake”. Previous comparative studies between polysomnographically and actigraphically measured sleep parameters showed that the actigraphic algorithm was susceptible to potential measurement errors. As a result, sleep duration was overestimated and wakefulness was underestimated [7-9]. In more recent studies, however, 85.6% of cases could now be correctly evaluated by the actigraph [10]. In recent years, the increasing availability of novel wearable health technology and in particular the explosion of fitness trackers (e.g. Fitbit Flex, Nike+ FuelBand, Jawbone UP band, Garmin vivofit, Misfit shine and flash) has made actigraphy available to the general population and it is now considered normal to track one’s daily activity and sleep and receive feed-back about one’s overall health.
Still the question rises on how reliable and scientifically grounded are activity tracker-based assessment of healthy and disturbed sleep and remains a key issue in this direction.
We hypothesized that generated data on sleep quality and sleep efficiency by the PAM Polar A300 in combination with the subjective sleep parameters correlate with those of a polysomnographic measurement.
| Materials and Methods | ▴Top |
In 2016, 26 subjects who were sent to polysomnographic examination mainly in order to check the efficacy of sleep apnea therapy by continuous positive airway pressure (CPAP). The study was conducted at the sleep laboratory of the Remigius Hospital Leverkusen-Opladen. After clarification and written informed consent, the participants were given a PAM (Polar A300) in order to measure sleep in addition to the polysomnography (PSG) for two consecutive nights. The PAM was worn both during the day and at night. At the same time, the patients completed two questionnaires for the survey period. One was on sleep quality (Pittsburgh sleep quality index (PSQI)) and one on daytime fatigue (multidimensional fatique inventory (MFI-20)), and they also kept a sleep diary (consensus sleep diary (CSD)). The measurement data from the subjective data collection (PSQI, MFI-20 and CSD) were compared to those of the PAM and the PSG in order to calculate correlations between the different measurement methods. We estimated the physical activity level (PAL) of all participants as suggested by United Nations University, World Health Organization and Food and Agriculture Organization of the United Nations [11].
Primary endpoint
Correlation of sleep quality and sleep efficiency measured with a novel PAM (A300 from Polar) in combination with subjective sleep parameters (PSQI, MFI-20 and CSD) was compared to the “gold standard” of PSG.
This study was conducted in compliance with the ethical standards of the responsible institution on human subjects as well as with the Helsinki Declaration and was approved by the Ethics Committee of the University of Witten-Herdecke (No. 70/2016) and registered with the DRKS (No. DRKS00017038).
Measurement methods
PAM Polar A300
The PAM had a CE mark (Certificate No. VTT-C-5494-01.1032-388-10-P0) and was worn on the wrist like a watch. After the measurement was activated, the data were recorded continuously. The data were stored on a PC. The working principle of the PAM was based on a 3D acceleration sensor (three axes). The system reacted to acceleration with a sampling rate of 50 Hz. To calculate the sleep, the movement intensity was first classified via the acceleration sensor. Sleep time is the longest continuous rest period within 24 h from 6 p.m. to 6 p.m. of the next day. Sleep interruptions of up to 1 h did not stop the sleep calculation, but were not included in the sleep time. Interruptions of more than 1 h ended the calculation of sleep time.
PSG
The PSG took place in the sleep center of the Remigius Hospital Leverkusen-Opladen, which was certified by the German Society for Sleep Research and Sleep Medicine (DGSM). The PSGs were performed with the Somnolab (Version 2.17), Weinmann Ltd, Hamburg and measurements were conducted according to the current guidelines of the American Society of Sleep Medicine (AASM). The evaluations were carried out by experienced sleep-lab staff with DGSM certificate.
PSQI
The PSQI was used to record the quality of sleep and asked retrospectively for a period of 4 weeks the frequency of sleep disturbing events, the assessment of sleep quality, the usual sleep times, sleep latency and sleep duration, the intake of sleep medications, as well as daytime fatigue. A total of 18 items were used for quantitative evaluation and assigned to seven components, each with a value ranging from 0 to 3. A total value of not more than 5 points as a rule indicated good sleep. Bad sleepers usually had values between 6 and 10 points. In chronic sleep disturbances clearly more than 10 points were found.
MFI-20
The daytime fatigue of the subjects was measured with the MFI-20. It contained 20 questions and the subjects could evaluate the fatigue with a five-point system (five scales): general fatigue, physical fatigue, decreased activity, decreased motivation and mental fatigue. Each scale consisted of four questions, two of which affirmed fatigue and two of which denied fatigue. In the affirmative, a high value meant a high level of fatigue; in the negative, a high value meant a low level of fatigue. The scales were balanced to keep the influence on the answering behavior as low as possible. On each scale a minimum value of 4 and a maximum value of 20 could be reached. This value was multiplied with 5 indicating a maximum percentage of 100.
CSD
The German version of the CSD was used to record the subjective sleep quality, sleep and wakefulness time, the number of nocturnal awakenings and the subjective restfulness of sleep and was completed daily by the participants. The sleep diary represented the simplest subjective method for recording the sleep-wake rhythm. Looking back the next day, subjects recorded when they went to bed, when they switched off the light to sleep, when they thought they fell asleep, how long they slept in their opinion and when they woke up in the morning. In addition, special occurrences during the night could be noted.
The study only included fully oriented subjects aged 19 - 99 years who were referred to inpatient PSG after their written informed consent. Subjects with dementia, neurodegenerative diseases (Parkinson’s, multiple sclerosis), with aphasia or subjects participating in another study were excluded. Only those who have worn the device sufficiently for both nights were included in the evaluation.
Statistical analysis
Descriptive statistics were used to describe the population: mean value, median, standard deviation, quantiles. Bland-Altman plots were used for further statistical calculation. With a sufficiently symmetrical distribution of the differences, 95% of the values lied in the range d ± 2xs, where “s” denotes the standard deviation of the differences. By definition, these were the “limits of agreement” (LoA) of the present study. Deviations outside 95% were classified as clinically not relevant. This graphical procedure took into account the distortion and dispersion of the data and allowed the assessment of the systematic deviations, outliers and dependencies of the variance on the magnitude of the measured values. The difference between the PAM data obtained using different methods was calculated for each subject and plotted against the mean value of two measurements. The sleep quality was measured by each subject with the A300 and assigned to an identical measuring point in the PSG. Correlations between these measurement points and values were calculated (Spearman correlation coefficient).
| Results | ▴Top |
A total of 26 screened patients fulfilled the inclusion criteria and completed the entire clinical trial according to the protocol. The baseline parameters are shown in Table 1. According to the estimation of the PAL, we registered a sedentary or light activity lifestyle of the participants.
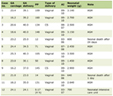 Click to view | Table 1. Baseline Parameters (n = 26) |
The comorbidities are listed in Table 2. The flow chart shows the sequence of the study (Fig. 1).
Click to view | Table 2. Comorbidities of the Patients |
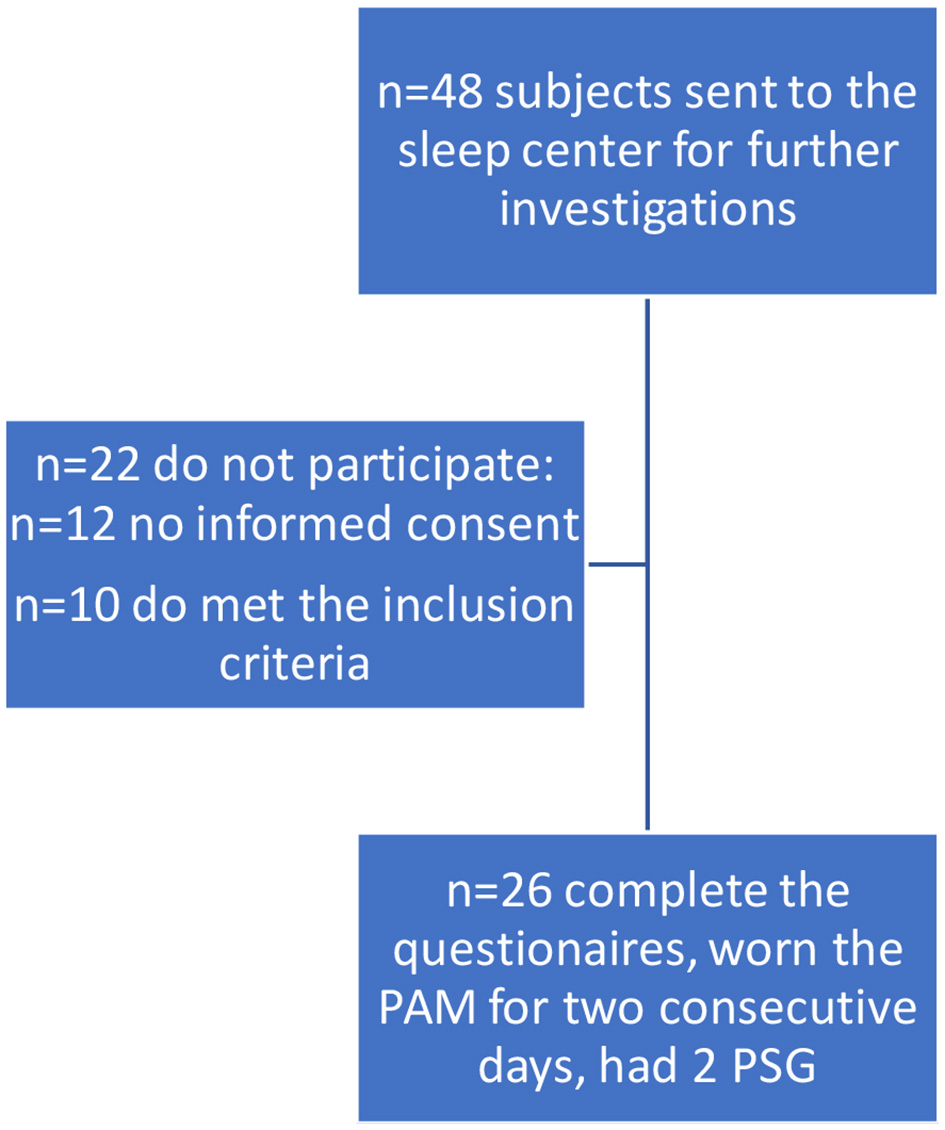 Click for large image | Figure 1. Flow chart. PSG: polysomnography; PAM: physical activity monitor. |
Regression analyses of aggregated data over two nights as assessed by both, PAM and PSG, are shown in Figures 2 and 3. High correlations between the data of both measurements were found for sleep efficacy and TST. For comparison of both measurements, Bland-Altman plots were used and showed no systematic deviation. The data were largely within the LoA (Figs. 4 and 5).
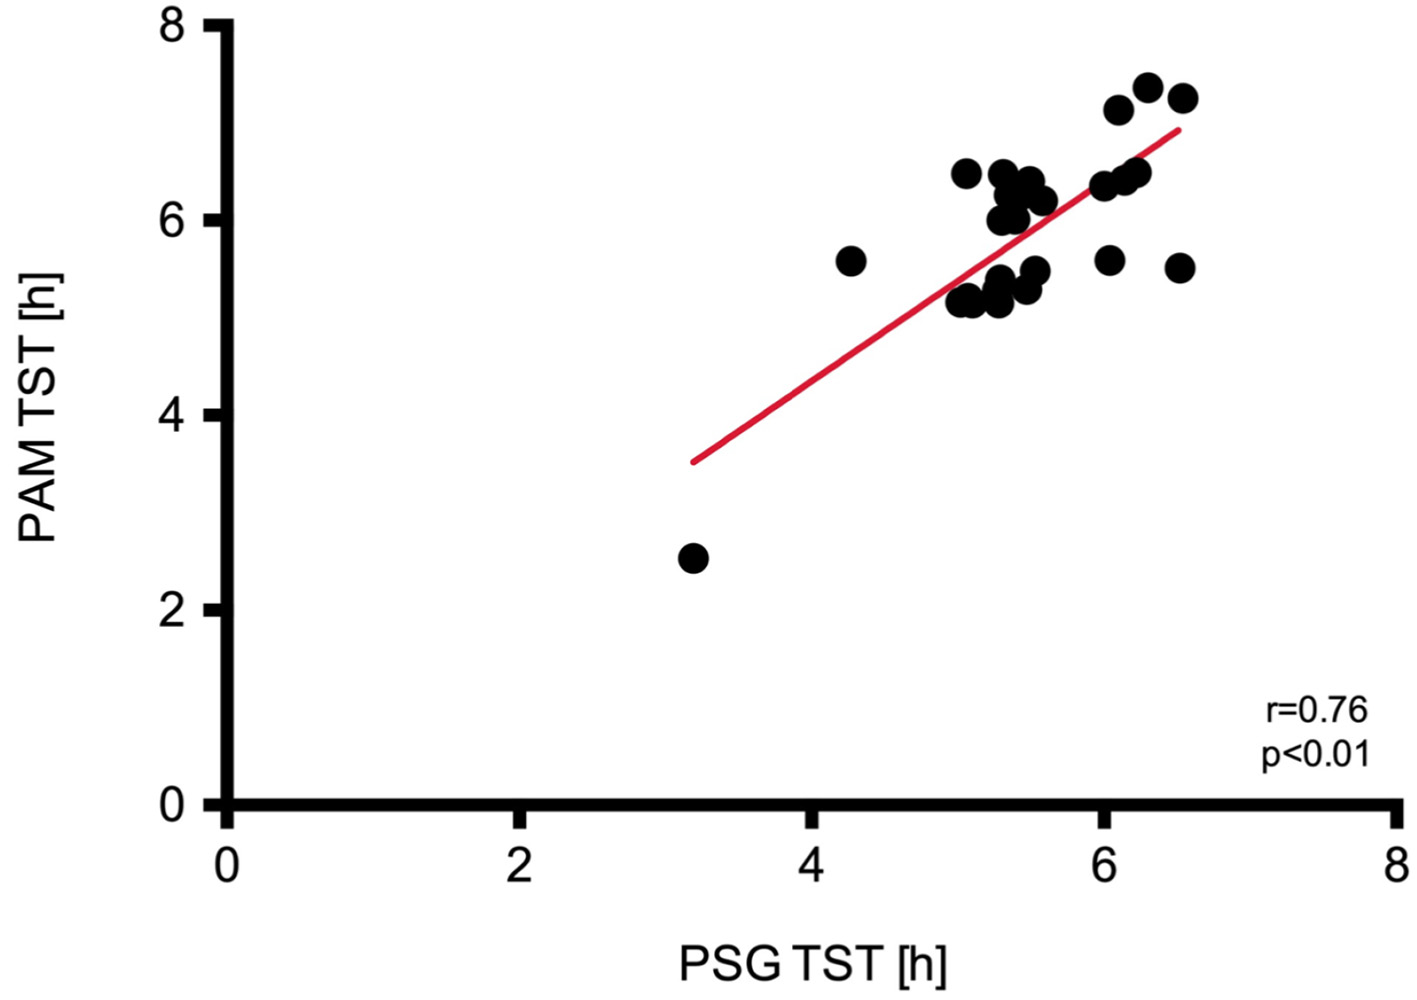 Click for large image | Figure 2. Regression analysis and identity plots. Total sleep time (TST) between Polar A300 and polysomnography (PSG). PAM: physical activity monitor. |
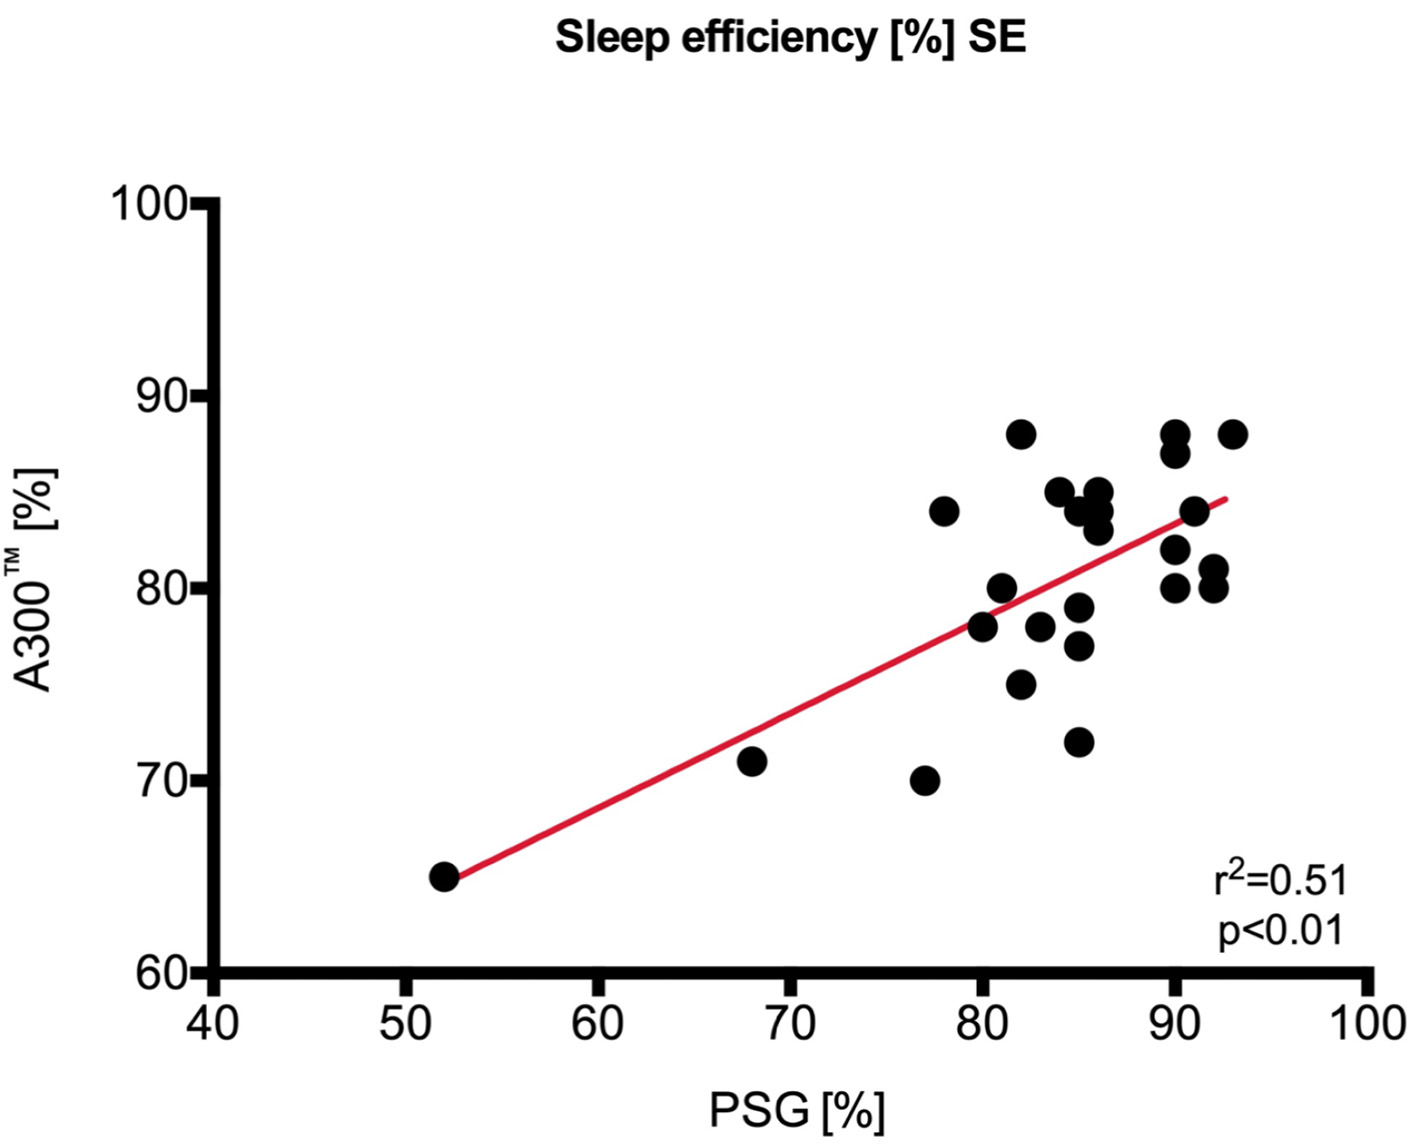 Click for large image | Figure 3. Regression analysis and identity plots. Sleep efficiency between Polar A300 and polysomnography (PSG). SE: standard error. |
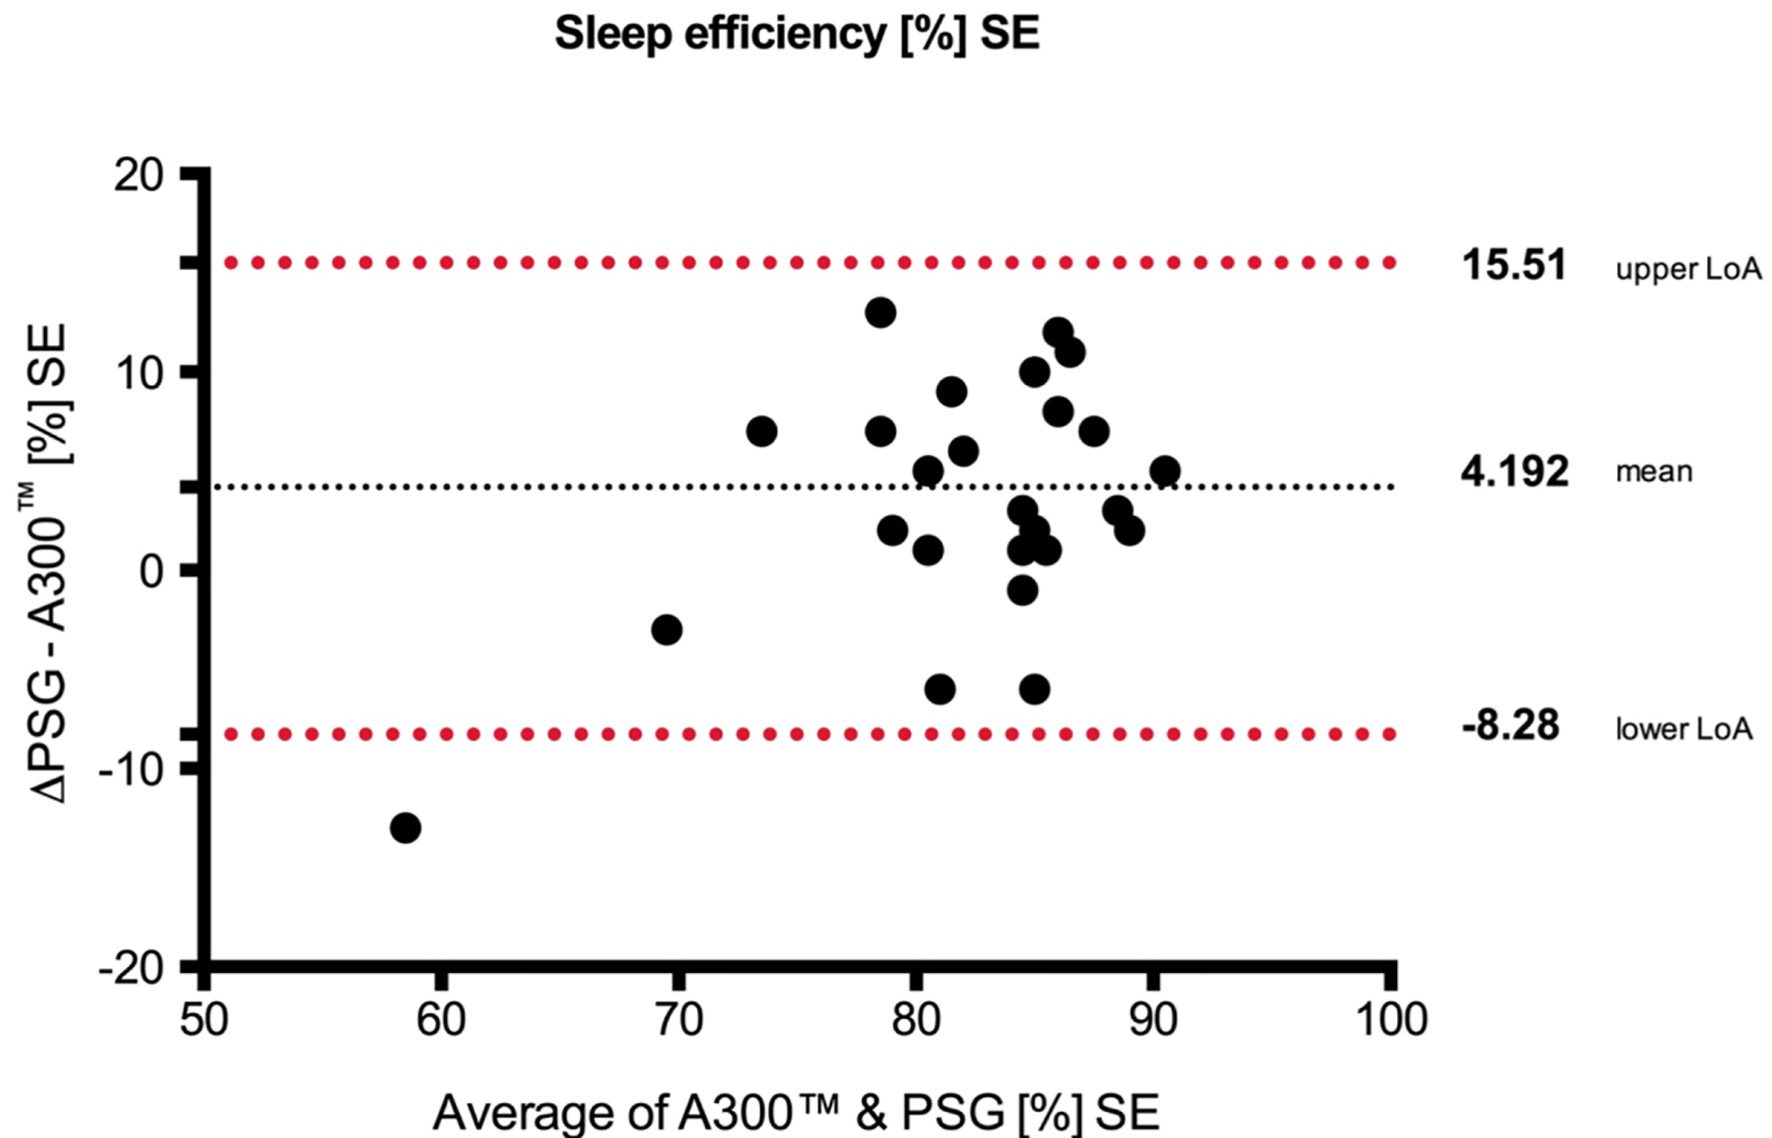 Click for large image | Figure 4. Bland-Altman plots with the mean over 2 days. Upper/lower limits of agreement (LoA) and 95% confidence interval (CI) (over/under the means) of sleep efficiency between (SE) Polar A300 and polysomnography (PSG). SE: standard error. |
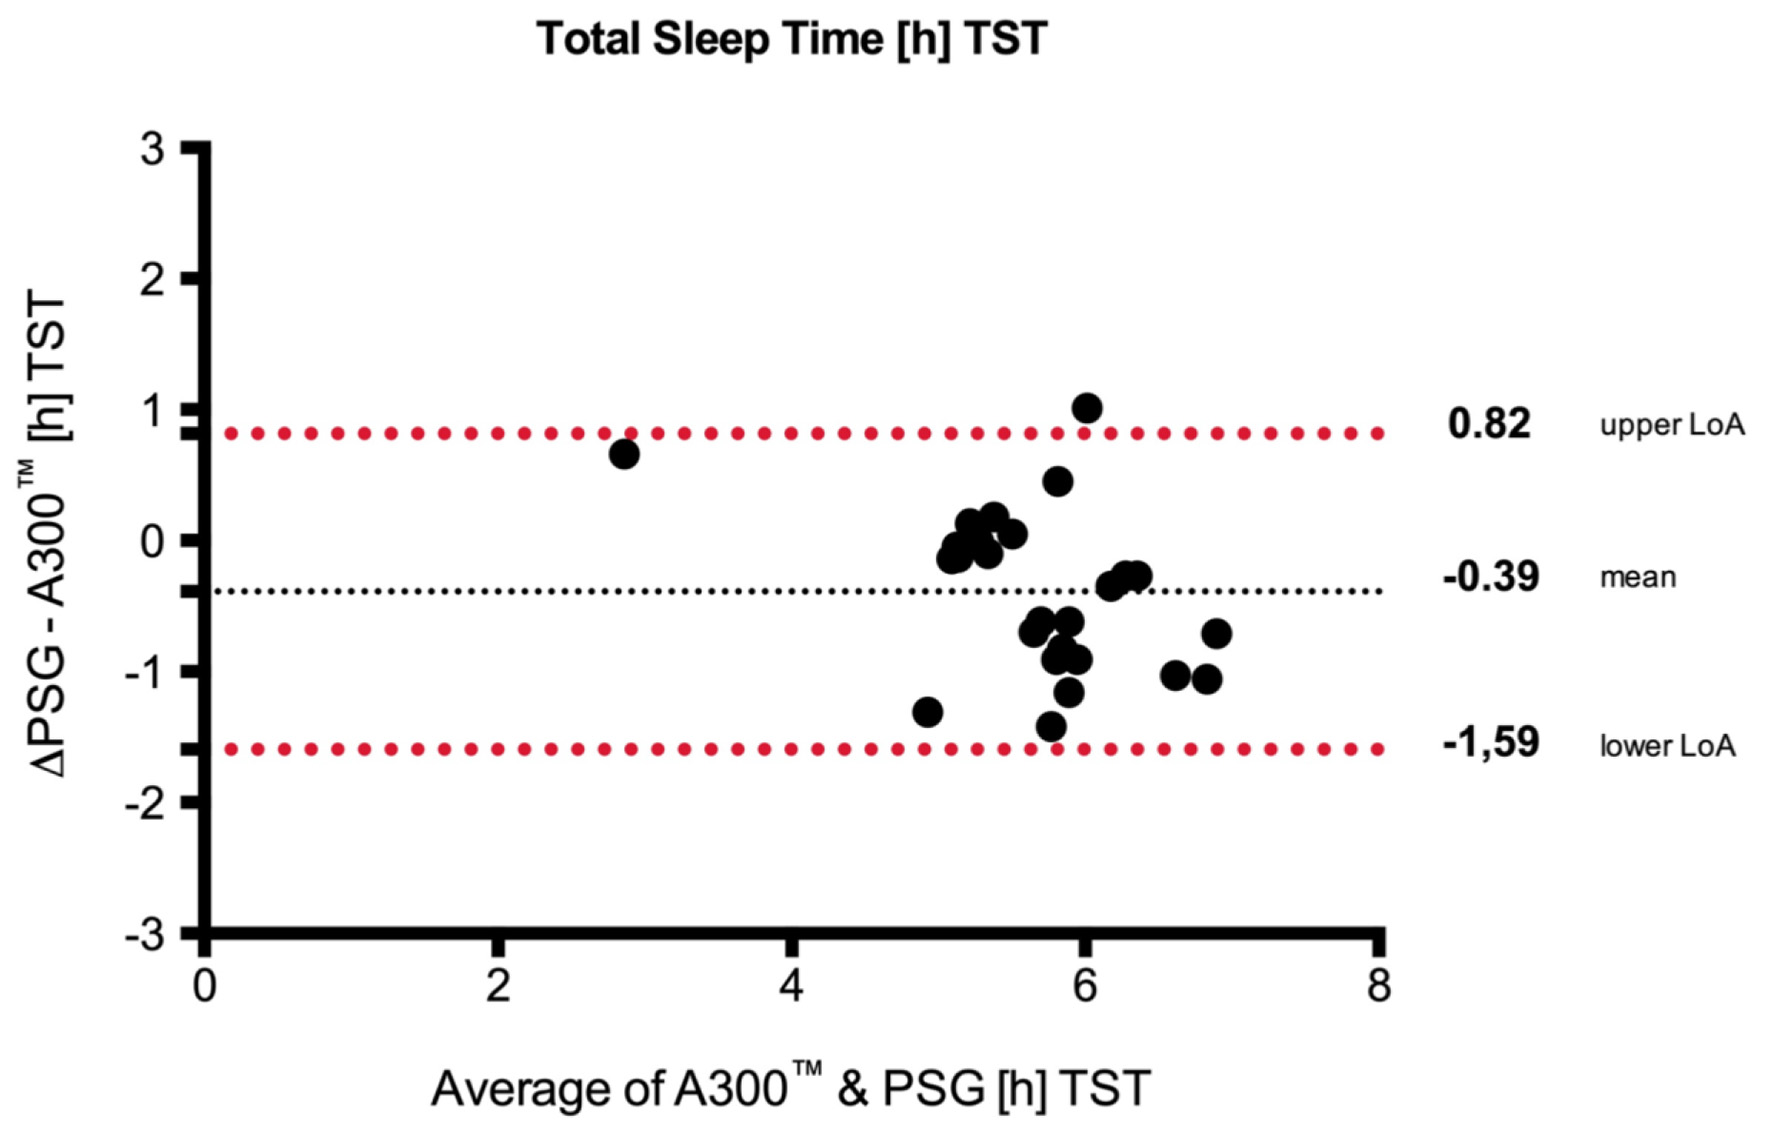 Click for large image | Figure 5. Bland-Altman plots with the mean over 2 days. Upper/lower limits of agreement (LoA) and 95% CI (over/under the means) of total sleep time (TST) between SE Polar A300 and polysomnography (PSG). SE: standard error. |
The answers given in the PSQI by the subjects according to the subjective sleep quality did not correlate to the physical activity (steps per day) measured by the PAM as well as the subjective sleep quality and efficacy (Figs. 6 and 7). The data according to fatigue registered in the MFI-20 questionnaire correlated with less physical activity but not with a poor sleep efficacy measured by the PAM (Figs. 8 and 9). The data acquired with the CSD also did not match with the sleep data (TST) from the PAM (Fig. 10).
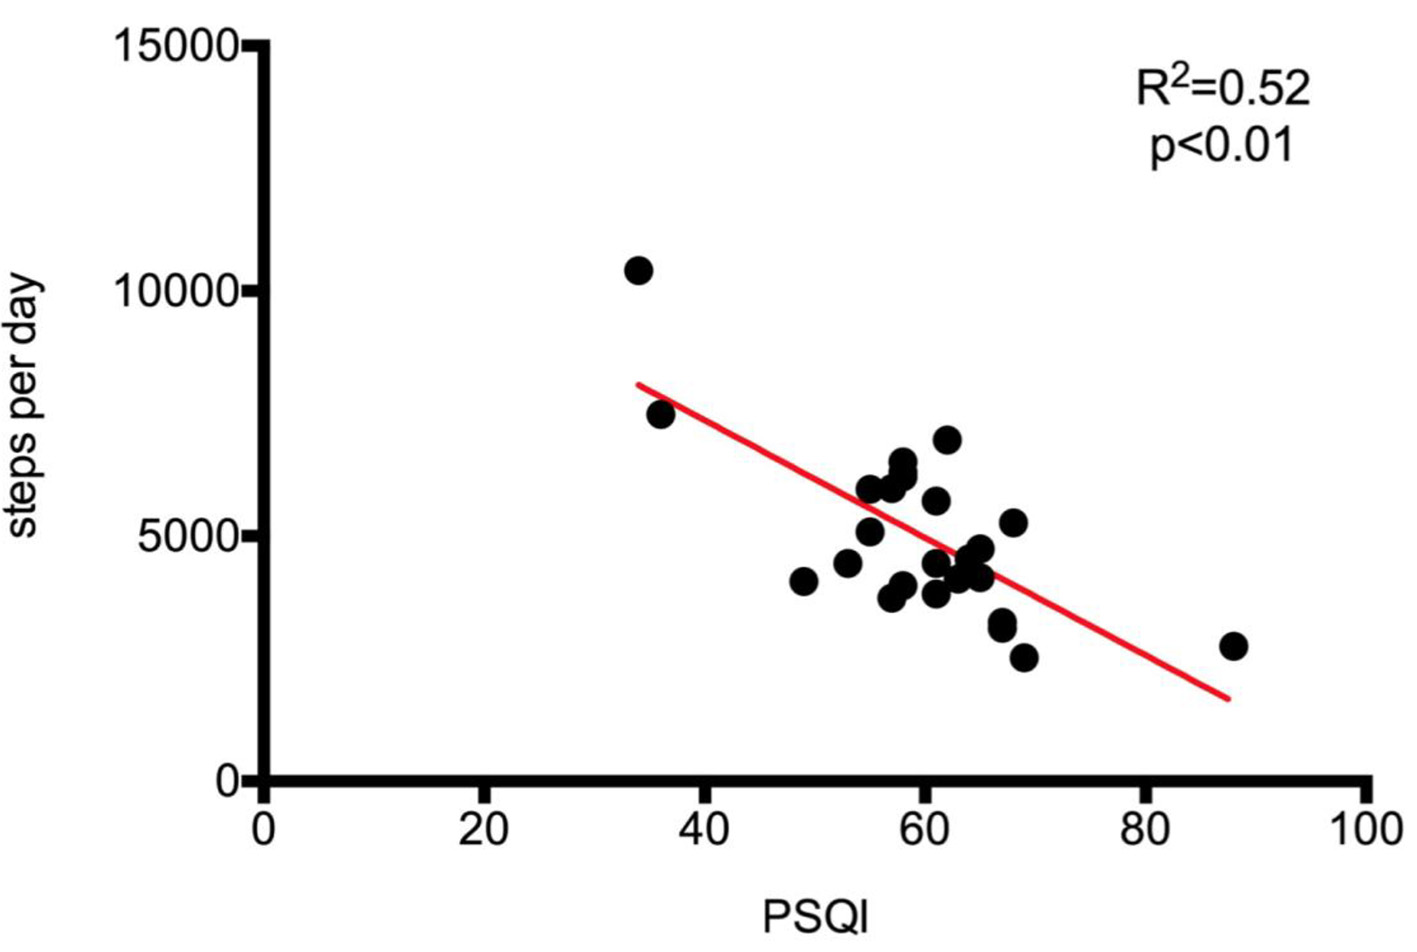 Click for large image | Figure 6. Regression analysis and identity plots. Steps per day between Polar A300 and Pittsburgh sleep quality index (PSQI). |
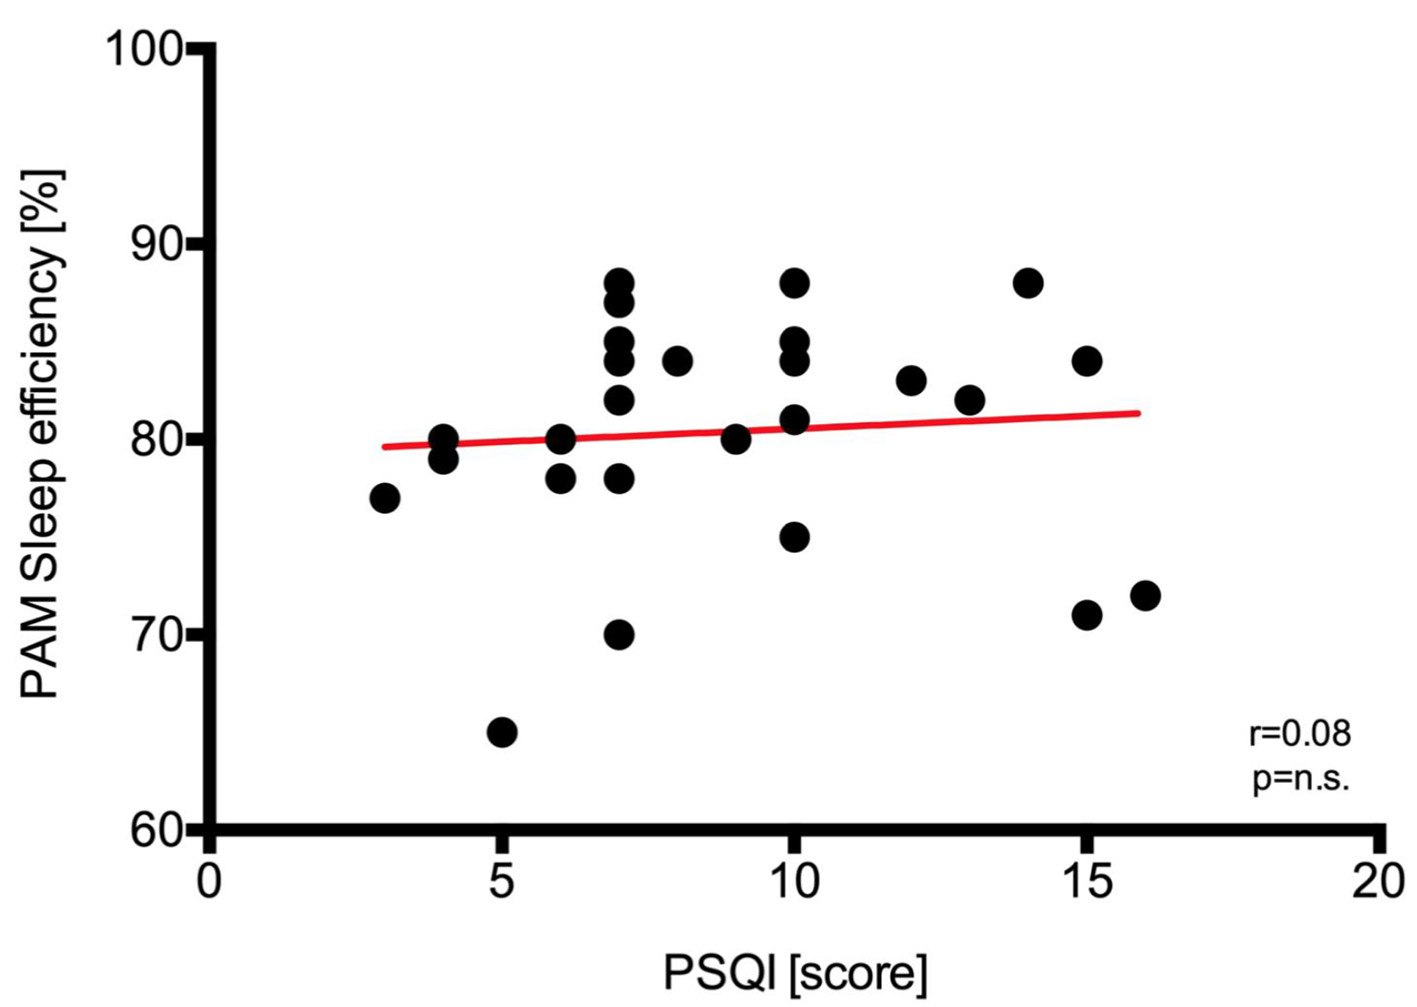 Click for large image | Figure 7. Regression analysis and identity plots. Sleep efficiency between Polar A300 and Pittsburgh sleep quality index (PSQI). PAM: physical activity monitor. |
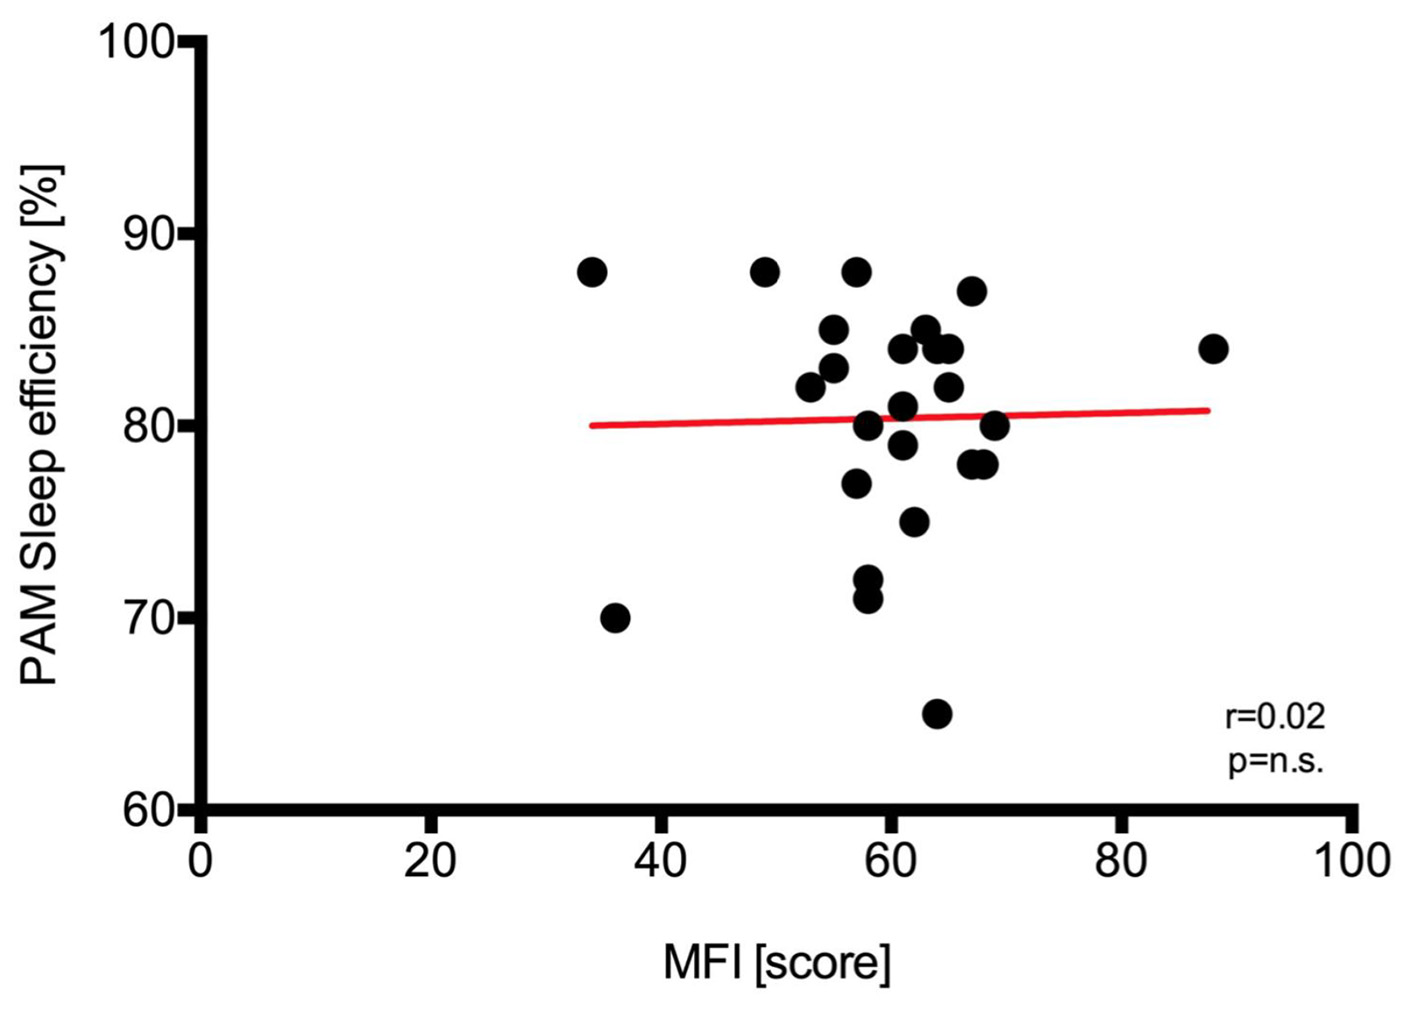 Click for large image | Figure 8. Regression analysis and identity plots. Sleep efficiency between Polar A300 and multidimensional fatique inventory (MFI). PAM: physical activity monitor. |
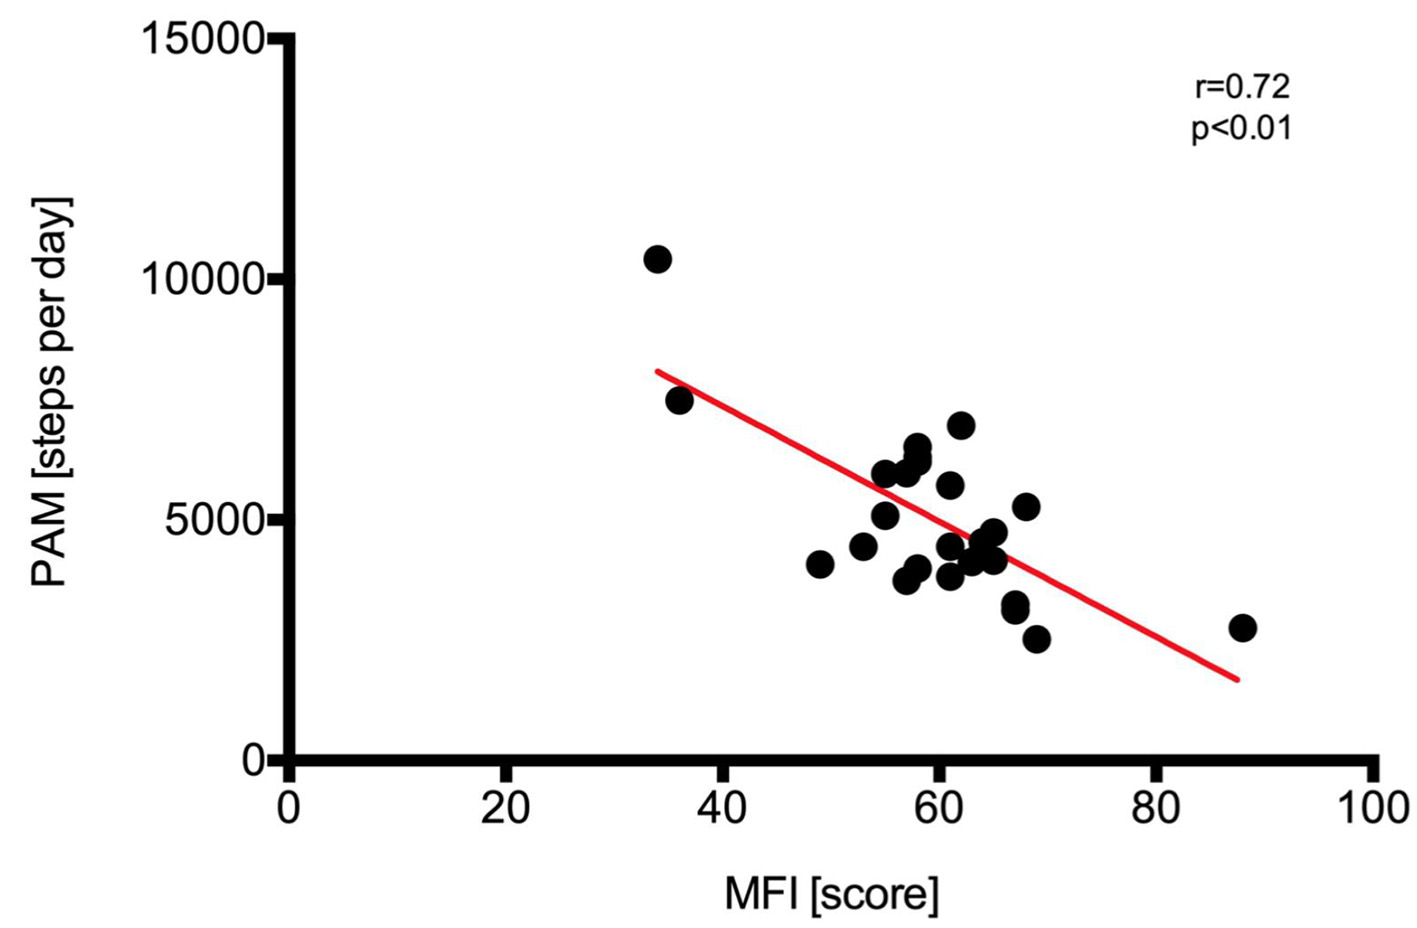 Click for large image | Figure 9. Regression analysis and identity plots. Steps per day between Polar A300 and multidimensional fatique inventory (MFI). PAM: physical activity monitor. |
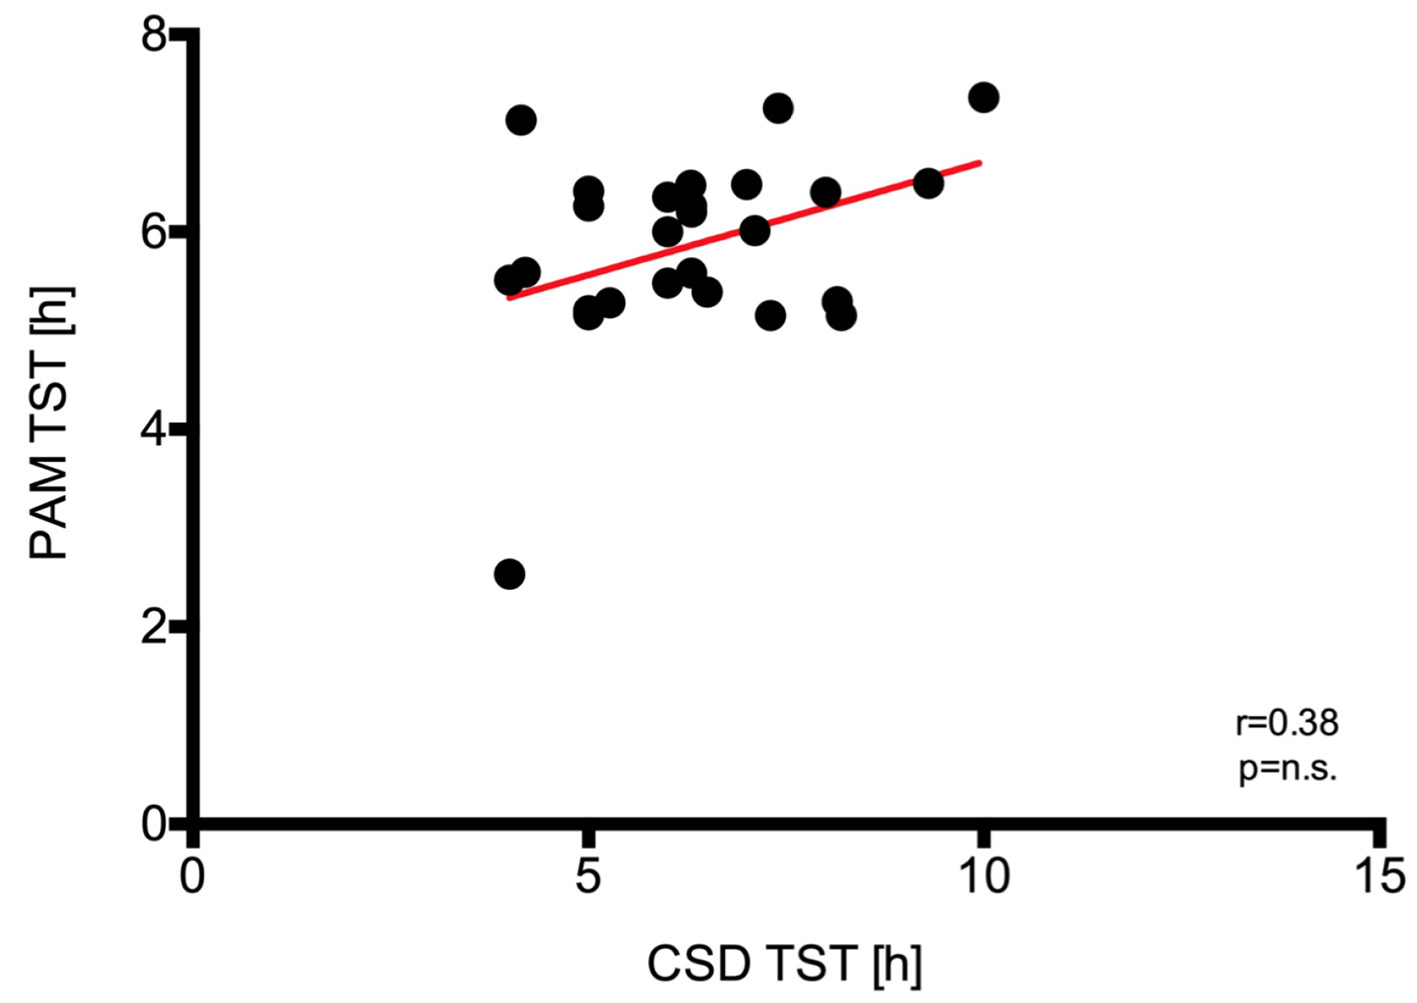 Click for large image | Figure 10. Regression analysis and identity plots. Total sleep time (TST) between Polar A300 and consensus sleep diary (CSD). PAM: physical activity monitor. |
| Discussion | ▴Top |
The present study showed a high correlation of the data according to TST and sleep efficacy acquired by PSG to the data generated by the PAM A300. To the best of our knowledge, this is the first study to compare this PAM with PSG according to sleep duration and sleep quality. These results are in line with recent studies comparing other activity tracker with PSG acquired sleep data showing a sufficient correlation of both measurements [12, 13].
The subjective information given by the participants in the questionnaires did not correlate to the PAM data. This is of further interest since subjective parameters provided by questionnaire are inconstant [1] in comparison to PSG sleep parameters. A recent study showed that the majority of objective sleep parameters appear not to be sensitive to sleep health status in normal sleepers [10]. Based upon the assessed sleep data by the PAM, the user gets aspects of the sleep experience and health outcomes, at least to two of the five domains suggested by Buysse et al that indicates good or poor sleep (satisfaction): the ability to maintain attentive wakefulness (alertness), placement of sleep in the 24-h day (timing), ease of falling asleep and staying asleep (efficiency), and total amount of sleep obtained per 24 h (duration) [14].
PSG is the gold standard for evaluating sleep in basic and clinical sleep research. However, there are several disadvantages of this technique: it is expensive, intrusive, time-consuming for individuals and evaluators, impractical for long-term in-laboratory and at home recordings, and has limited availability. Although an actigraphy and a PAM are not the same, the user of the PAM gets data about his sleep parameters day by day as well. Long-term observation of these parameters thus may provide data indicating the effectiveness of interventions, changes in sleep quality caused by exercise training or other circumstances influencing sleep. Of course the sleep parameters generated by the PAM are not able to substitute professional analysis by PSG or even diagnosing a disease. The limitations in diagnosing sleep disorders with a tool like a PAM are well known [15]. But for special groups such as athletes (almost healthy subjects), PAM might be useful tools [16]. PSG would be too complex for monitoring of trainings and other long-term interventions with regard to the effects on sleep. In the current study, we find a slightly deviation of the values from the normal distribution as shown in Figures 2, 3 and 9. The outliers are the same participant. However, the participant had a restless leg syndrome as a secondary disease which might be the reason for this deviation.
There are professional actigraphs, for example in sleep diagnostics. As a rule, actigraphy measurements are used in the diagnosis and therapy of sleep disorders. For example, actigraphy has shown to be a valid objective measure of sleep onset latency, wake after sleep onset, TST and sleep efficiency SE in a young adult insomnia sample, as compared to ambulatory PSG [17]. But the available devices are expensive, require complex evaluation software and are usually only intended for professionals in sleep medicine. Examinations in a sleep center are expensive and appointments are hard to get. Nevertheless, these measurements are important diagnostic tools for a sleep physician and ultimately also indispensable. But the PAM A300 is a cheap activity tracker that gives the user an idea about his sleep. Rough but reliable data confirmed by this study showed that PAM data on sleep are also sufficiently accurate. This should be interesting for the use of the data for further studies (e.g. connection between activity and sleep, and rehabilitation and sleep).
Limitations
There are mainly five limitations of the study worth mentioning. 1) It must be mentioned that only two measurements were carried out per patient. Measurements over, e.g. 5 - 7 days, would certainly have been more accurate in comparison between PSG and PAM. However, the organizational effort and the burden for the patients would have been too burdensome. However, in sleep medicine two consecutive PSGs are usually sufficient to exclude night to night variability, so that we assume to have correctly recorded the sleep parameters of the subjects. 2) Furthermore, it must be left open whether the findings can be transferred to all humans or different patient populations because only patients were examined who were sent for a PSG due to a sleep disorder. 3) The study was conducted in a sleep laboratory environment in which participants, even if free to decide light-off and light-on times, had to follow a strict protocol and where technicians ensured the quality of the data collection. This study therefore needs to be replicated in an at-home environment. 4) We compared PAM Polar A300 to standard PSG only. Thus, further comparisons of PAM with standard actigraphy are also needed. 5) We were unable to evaluate epoch-by-epoch comparisons between PAM and PSG sleep/wake state, and thus sensitivity and specificity of PAM remain to be determined.
Conclusion
The data according to sleep quality and sleep efficacy generated by the PAM Polar A300 are valid. The PAM is cheap and gives its user a general overview of his or her sleep quality.
Acknowledgments
None to declare.
Financial Disclosure
None to declare.
Conflict of Interest
None to declare.
Informed Consent
All participants gave their written consent.
Author Contributions
MS, TB and BD made substantial contributions to conception and design, or acquisition of data, or analysis and interpretation of data. MS, BD and TB made substantial contributions to acquisition of data. WW, MS, TB, DB, PA, CN, SJH, KAR, TG and NC involved in drafting the manuscript or revising it critically for important intellectual content. WW, MS, TB, DB, PA, CN, SJH, KAR, TG and NC gave final approval of the version to be published. Each author participated sufficiently in the work to take public responsibility for appropriate portions of the content. WW, MS, TB, DB, PA, CN, SJH, KAR, TG and NC agreed to be accountable for all aspects of the work in ensuring that questions related to the accuracy or integrity of any part of the work are appropriately investigated and resolved.
| References | ▴Top |
- Allen SF, Elder GJ, Longstaff LF, Gotts ZM, Sharman R, Akram U, Ellis JG. Exploration of potential objective and subjective daily indicators of sleep health in normal sleepers. Nat Sci Sleep. 2018;10:303-312.
doi pubmed - Erlacher D, Ehrlenspiel F, Adegbesan OA, El-Din HG. Sleep habits in German athletes before important competitions or games. J Sports Sci. 2011;29(8):859-866.
doi pubmed - Hublin C, Partinen M, Koskenvuo M, Kaprio J. Sleep and mortality: a population-based 22-year follow-up study. Sleep. 2007;30(10):1245-1253.
doi pubmed - Patel SR, Ayas NT, Malhotra MR, White DP, Schernhammer ES, Speizer FE, Stampfer MJ, et al. A prospective study of sleep duration and mortality risk in women. Sleep. 2004;27(3):440-444.
doi pubmed - Youngstedt SD, Kripke DF. Long sleep and mortality: rationale for sleep restriction. Sleep Med Rev. 2004;8(3):159-174.
doi pubmed - Lim AS, Yu L, Kowgier M, Schneider JA, Buchman AS, Bennett DA. Modification of the relationship of the apolipoprotein E epsilon4 allele to the risk of Alzheimer disease and neurofibrillary tangle density by sleep. JAMA Neurol. 2013;70(12):1544-1551.
doi pubmed - Ancoli-Israel S, Cole R, Alessi C, Chambers M, Moorcroft W, Pollak CP. The role of actigraphy in the study of sleep and circadian rhythms. Sleep. 2003;26(3):342-392.
doi pubmed - Wiater A. Mediziner warnen vor volkswirtschaftlichem Schaden durch zunehmende Schlafstorungen. 2014. 07.01.2016.
- Lichstein KL, Stone KC, Donaldson J, Nau SD, Soeffing JP, Murray D, Lester KW, et al. Actigraphy validation with insomnia. Sleep. 2006;29(2):232-239.
- Wang MY, Hung HL, Tsai PS. The sleep log and actigraphy: congruency of measurement results for heart failure patients. J Nurs Res. 2011;19(3):173-180.
doi pubmed - Human energy requirements: report of a joint FAO/ WHO/UNU Expert Consultation. Food Nutr Bull. 2005;26(1):166.
- de Zambotti M, Goldstone A, Claudatos S, Colrain IM, Baker FC. A validation study of Fitbit Charge 2 compared with polysomnography in adults. Chronobiol Int. 2018;35(4):465-476.
doi pubmed - de Zambotti M, Baker FC, Colrain IM. Validation of Sleep-Tracking Technology Compared with Polysomnography in Adolescents. Sleep. 2015;38(9):1461-1468.
doi pubmed - Buysse DJ. Sleep health: can we define it? Does it matter? Sleep. 2014;37(1):9-17.
doi pubmed - Sadeh A. The role and validity of actigraphy in sleep medicine: an update. Sleep Med Rev. 2011;15(4):259-267.
doi pubmed - Claudino JG, T JG, de Sa Souza H, Simim M, Fowler P, de Alcantara Borba D, Melo M, et al. Which parameters to use for sleep quality monitoring in team sport athletes? A systematic review and meta-analysis. BMJ Open Sport Exerc Med. 2019;5(1):e000475.
doi pubmed - Williams JM, Taylor DJ, Slavish DC, Gardner CE, Zimmerman MR, Patel K, Reichenberger DA, et al. Validity of actigraphy in young adults with insomnia. Behav Sleep Med. 2018:1-16.
doi pubmed
This article is distributed under the terms of the Creative Commons Attribution Non-Commercial 4.0 International License, which permits unrestricted non-commercial use, distribution, and reproduction in any medium, provided the original work is properly cited.
Journal of Clinical Medicine Research is published by Elmer Press Inc.