

| Journal of Clinical Medicine Research, ISSN 1918-3003 print, 1918-3011 online, Open Access |
| Article copyright, the authors; Journal compilation copyright, J Clin Med Res and Elmer Press Inc |
| Journal website http://www.jocmr.org |
Original Article
Volume 11, Number 8, August 2019, pages 563-571
Analysis of Dietary Factors Affecting Body Mass Index in Elderly Patients With Type 2 Diabetes Mellitus
Yasuko Fukudaa, f, Yumi Umenob, Yuko Taniguchic, e, Satoko Marukawad, e, Hiroko Kuriharad, e, Hiromu Nakajimad, e, Tomoyuki Yamasakid, e
aDepartment of Food Sciences and Nutrition, School of Human Environmental Sciences, Mukogawa Women’s University, Nishinomiya, Hyogo, Japan
bHealth Guidance Section, National Pension and Insurance, Kaizuka City Hall, Kaizuka, Osaka, Japan
cDepartment of Nutrition Management, Osaka Medical Center for Cancer and Cardiovascular Diseases, Osaka, Japan
dDepartment of Endocrinology and Metabolism/Clinical Laboratory, Osaka Medical Center for Cancer and Cardiovascular Diseases, Osaka, Japan
eCurrent Address: Osaka International Cancer Institute, Osaka, Japan
fCorresponding Author: Yasuko Fukuda, Department of Food Sciences and Nutrition, School of Human Environmental Sciences, Mukogawa Women’s University, 6-46, Ikebiraki-cho, Nishinomiya, Hyogo 663-8558, Japan
Manuscript submitted May 31, 2019, accepted July 5, 2019
Short title: Dietary Factors Affecting BMI in Elderly
doi: https://doi.org/10.14740/jocmr3893
| Abstract | ▴Top |
Background: Body mass index (BMI) is correlated with the outcomes of various metabolic and pathological conditions. To elucidate the factors affecting BMI in elderly persons, we studied elderly persons with and without diabetes mellitus for BMI management target values using receiver operating characteristic (ROC) analysis.
Methods: We conducted a dietary survey targeting 60 elderly outpatients with type 2 diabetes mellitus (diabetes group, 70.1 ± 7.8 years) and 66 elderly persons who participated in a health class offered by the municipality (health class group, 72.5 ± 5.7 years).
Results: In the diabetes group, positive correlations were observed between BMI and several variables including blood glucose levels (all P < 0.05), whereas BMI had negative correlations with the third principal component (positive weight for oils and fats). In addition, BMI was negatively correlated with the intake of oils and fats. In the health class group, BMI was positively correlated (all P < 0.05) with grip strength/sixth principal component (positive weight for sweets)/condiments. An analysis of dietary patterns revealed that dietary factors correlated with BMI in each group. The cutoff value of BMI was suggested to be near the normal upper limit or slightly higher in the subject group.
Conclusion: We considered that BMI management was useful as an indicator for maintaining grip and muscle strength in elderly persons and as an indicator for diabetes care management. From the present study, we may propose the utility of a careful dietary survey as one of the approaches for these aims.
Keywords: BMI; Diabetes mellitus; Dietary patterns; Elderly person; Grip strength
| Introduction | ▴Top |
For maintaining and promoting the health of elderly persons, dietary intake standards have been the criteria for indicating proper nutrient and energy intake [1]. Under these standards, body mass index (BMI) is used as an indicator of the balance between energy intake and expenditure, and the nutrition management is performed for the prevention of obesity and emaciation by maintaining BMI within the appropriate range. Obesity is associated with various complications in both elderly and young persons, particularly in elderly persons, who tend to have decreased endocrine/metabolic ability because of aging and are highly susceptible to diabetes mellitus due to obesity. Therefore, in elderly patients with type 2 diabetes mellitus, BMI is an important nutritional indicator for disease management and the prevention of progression of diabetic complications [2]. Regarding emaciation in elderly persons, in addition to deterioration of coexistent diseases, it also decreases the activities of daily living, by affecting resistance to infection and by impairing locomotive activities [3]. In clinical nutrition, body fat percentage and body composition are measured to evaluate obesity and emaciation. However, because these measurements are not common in daily life, BMI, which can be conveniently calculated from height and weight and which is correlated with total fat, is also often used [4-6]. Because BMI is correlated with the outcomes of various metabolic and pathological conditions, it can be a good indicator of the health condition [7-9].
For elucidating the disease risk through nutritional research, it may be difficult to obtain sufficient information only by investigating the relationship of disease risk with a single nutrient or food [10, 11]. It may be additionally necessary to evaluate the combination of food products, eating habits, eating behaviors and other variables. In recent years, a number of studies have comprehensively examined dietary habits using dietary patterns in consideration of entire meals [12]. However, the derived dietary patterns differ by ethnic group and country [13-15] and vary by generation and region. In elderly persons in particular, dietary patterns are based on past lifestyle, culture and locality, and it can be expected that nutritional intake and dietary patterns differ both collectively and individually compared with the findings for other age groups. These are due to changes in living background related to preferences and social and economic changes associated with aging.
In elderly outpatients who are not under strict medical management, BMI is used for health guidance as an indicator for maintaining physique and activities of daily life. Moreover, BMI was confirmed from the viewpoint of medical treatment as a medical indicator for evaluating disease progression and complications in elderly patients with type 2 diabetes mellitus in whom the disease is managed only via outpatient medical guidance [2]. Thus, BMI can be positioned as a comprehensively investigated indicator of the health status of elderly persons and a countermeasure against disease.
In the present study, we extracted and analyzed the dietary patterns of two independent elderly groups according to the presence or absence of diabetes mellitus. We subsequently compared the dietary factors affecting BMI in these groups.
| Patients and Methods | ▴Top |
The subjects were 60 elderly patients with type 2 diabetes mellitus (36 men and 24 women) residing in Osaka Prefecture who managed their condition through outpatient treatment guidance only (diabetes group) and 66 elderly persons (33 men and 33 women) who participated in a health class operated by the local municipality (health class group).
All the patients in the diabetes group were on outpatient pharmacotherapy (including insulin therapy) at the Osaka Medical Center for Cancer and Cardiovascular Diseases (the Center). The patients who attended from July to August 2015 were enrolled. There was no patient receiving hemodialysis treatment (Table 1). BMI was calculated from the height and weight values by use of the patients’ electronic medical records. The following blood biochemical examination values in the diabetes group were retrospectively collected from the electronic medical records closest to the day of the dietary survey: glycosylated hemoglobin (HbA1c), fasting plasma glucose (FPG), total cholesterol (TC), triglyceride (TG), low-density lipoprotein cholesterol (LDL-c), high-density lipoprotein cholesterol (HDL-c), systolic blood pressure (SBP) and diastolic blood pressure (DBP). Non-HDL cholesterol (non-HDL-c) was calculated from the values of TC and HDL-c.
 Click to view | Table 1. Demographics |
The health class group comprised people who participated in the 2015 resident health examination and health class sponsored by a local municipality (Kaizuka City, Osaka Prefecture). Height, weight, grip strength, calf circumference and the two-step value were measured. Grip strength was measured using the “New Strength Testing Requirements” by the Ministry of Education, Culture, Sports, Science and Technology [16], and the two-step value was based on the “locomotion degree test” [17]. The two-step value was calculated by dividing the two-step measurement value by height.
The exclusion criteria were as follows: Cr > 2 mg/dL, lack of laboratory data and refusal to participate.
Nutrient intake in each group
A dietary survey was conducted to calculate nutrient intake in each group. The brief-type self-administered diet history questionnaire (BDHQ) was used to investigate diet [11]. On the basis of the frequency of food intake per week in the most recent month, we estimated energy and nutrient intake by food group. According to the results of BDHQ, the daily intake energy (EN/kg) per 1 kg of current body weight and intake amount (converted value per 1,000 kcal) by other nutrient/food group was calculated.
Extraction of the dietary pattern in each group from BDHQ results
In each group, principal component analysis was performed using 15 items of food group intake for the extraction of factors that determined dietary patterns. The food groups indicating the principal components had a factor loading of 0.30 or higher, which can be determined as “having a slight correlation”.
Relationships of BMI with examination/physical measurement values, dietary patterns and food group by patient group
We examined the relationships of BMI with various factors in each group.
Next, in each group, linear regression analysis was performed by inputting BMI as the objective variable and the first to sixth principal component scores and age/sex as the explanatory variables.
Furthermore, in each group, linear regression analysis was performed using BMI as an objective variable and food groups related to the principal component factor extracted in each group and age/sex as explanatory variables.
Setting of the BMI cutoff in each group
The BMI cutoff for the examination and physical measurement values in each group was investigated using receiver operating curve (ROC) analysis. Each item was divided into two groups by the identification value, and values peculiar to each item and subject pair were obtained.
The identification values of the examination values were as follows: HbA1c < 7.4%, FPG < 140 mg/dL, TG < 150 mg/dL, LDL-c < 120 mg/dL, HDL-c ≥ 40 mg/dL, LDL-c/HDL-c < 2.0, SBP < 130 mm Hg and DBP < 80 mm Hg [2].
The identification values of the physical measurement value were set as grip strength < 25 kg for men and < 20 kg for women [18] and a two-step value of 1.4. Calf circumference was excluded as an identification value because the circumference exceeded 30 cm in all subjects [18].
Statistical analysis
SAS version 9.4 (SAS Institute Inc., Cary, NC, USA) was used. Regarding descriptive statistics, the mean ± standard deviation (SD) or median (first and third quartiles) is shown. After confirming normality between the two groups, the Mann-Whitney U test was used for continuous variables, and Spearman’s rank correlation coefficient was used for examining correlations. Multiple regression analysis was used for performing numerical prediction by linear model. A two-tailed P < 0.05 indicated statistical significance.
Ethical considerations
The present study was approved by the institutional review boards of the Osaka Medical Center for Cancer and Cardiovascular Diseases (approval number: No. 1503315262, approval date: March 31, 2015) and Mukogawa Women’s University (approval number: No. 15-68, approval date: December 14, 2015), and based on the Declaration of Helsinki. Data were anonymized to prevent the identification of participants.
| Results | ▴Top |
Subjects demographics
The demographics of the subjects are shown in Table 1.
Nutrient intake in each group
Nutrient intake was similar between the two groups (Table 2). Although the two groups could not be directly compared, even when belonging to the same population, significant difference was not observed.
Click to view | Table 2. Nutritional Intake |
Extraction of the dietary pattern in each group
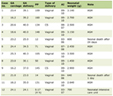
In both groups, seven major constituents with eigenvalues of 1 or higher were extracted (Table 3). In both groups, these dietary patterns explained 73.5% of the total variance.
Click to view | Table 3. Principal Component Factor Related to BMI |
Among these, “oils/meat” was selected as the third principal component factor because oils (0.604) and meat (0.363) were extracted in the positive direction, whereas cereals (-0.414), seasoning spices (-0.311) and fruits (-0.306) were extracted in the negative direction (Table 3). In addition, “sweets/fishes/meat/seasoning spices” was selected as the sixth principal component factor because sweets (0.450), fishes (0.355) and seasoning spices (0.315) were extracted in the positive direction, whereas meat (-0.594) was extracted in the negative direction (Table 3).
Relationships of BMI with examination/physical measurement values and dietary patterns/food groups within each group
The results are shown in Tables 3-5.
Click to view | Table 4. Relationship Between BMI and Demographics |
Click to view | Table 5. Relationship Between BMI and Principal Component Factor |
In the diabetes group, significant positive correlations were noted between BMI and FPG (P = 0.032), TG (P = 0.016), LDL-c (P = 0.037), LDL-c/HDL-c (P = 0.042), non-HDL-c (P = 0.004) and SBP (P < 0.001), and positive trends were noted for HbA1c (P = 0.053) and TC (P = 0.065) (Table 4). Moreover, a negative correlation was observed between BMI and the third principal component factor, albeit without significance (P = 0.057) (Table 5). In addition, there was a significant negative correlation between BMI and oils (P = 0.022) and a significant positive correlation with women (both P < 0.05) (Table 5). In other words, in the diabetes group, those with a high BMI tended to have reduced intake of oils and fats, and this trend was significantly more common among females.
In the health class group, BMI was positively correlated with grip strength (P = 0.032) and calf circumference (P < 0.001), and a trend toward a negative correlation between BMI and the two-step value was noted (P = 0.083) (Table 4). BMI was also positively correlated (P = 0.001) with the sixth principal component factor (Table 5). Moreover, a significant positive correlation was noted between BMI and seasoning spices (P = 0.009) and a trend toward a negative correlation was noted with meat (P = 0.072) (Table 5). In other words, in the health classroom group, those with a high BMI consumed a large quantity of fish and shellfish as well as seasonings; further, they predominantly consumed these foods more than meat. This finding was attributed to the fact that these subjects resided near a harbor. In general, regarding dietary habit, the diabetes group appeared to be disciplined, whereas the health classroom group appeared to be permissive.
BMI cutoff in each group
The target management values were as follows: HbA1c, 23.8 kg/m2 (95% confidence interval (CI): 0.585 - 0.737); FPG, 24.3 kg/m2 (95% CI: 0.686 - 0.720); TG, 27.1 kg/m2 (95% CI: 0.905 - 0.444); LDL-c, 21.9 kg/m2 (95% CI: 0.306 - 1.000); HDL-c, 23.1 kg/m2 (95% CI: 0.611 - 0.667); LDL-c/HDL-c, kg/m2 (95% CI: 0.923 - 0.382); SBP, 23.9 kg/m2 (95% CI: 0.789 - 0.719); and DBP, 24.3 kg/m2 (95% CI: 0.568 - 0.714).
In addition, the cutoff values for grip strength and the two-step value were 22.7 (area under the curve (AUC) 95% CI: 0.433 - 0.713) and 25.2 kg/m2 (AUC 95% CI: 0.941 - 0.471), respectively.
| Discussion | ▴Top |
In the present study, we examined the significance and utility of routinely managed BMI in elderly persons and elucidated various dietary factors that affect BMI. We focused on groups with diverse backgrounds including elderly outpatients with type 2 diabetes mellitus and general elderly persons who resided in the local community. To elucidate the dietary habits that affected BMI management, we extracted and analyzed the dietary patterns. The results suggest that BMI is a useful care management indicator for elderly patients with diabetes mellitus as well as a maintenance indicator for grip and muscle strength in resident subjects, and the modifiable factors of dietary habits can be derived by analyzing dietary patterns associated with BMI.
It is nowadays a common notion that obesity leads to various health problems; thus, BMI has been widely used to estimate the degree of obesity. Epidemiological studies revealed that both obesity and low body weight increase mortality rates, which is called a J-curve, in a study of the correlation between BMI in young persons and vital prognosis. However, in elderly persons aged 65 years or older, this correlation becomes weaker, and in those aged 85 years or older, mortality rates do not increase with increases in BMI [19]. In addition, various clinical studies reported that maintaining an appropriate BMI is extremely important for healthy longevity [20]. Thus, when BMI is used as a health indicator, it is also important to optimize the target value using background factors such as age, the basic disease condition and lifestyle habits.
In the present study, significant correlations were confirmed between BMI and several physical and clinical examination variables for both subject groups.
In the diabetes group, positive correlations with blood glucose, blood pressure and serum lipid were shown. It has been indicated that in patients with diabetes mellitus, an increase in BMI can worsen diabetes care management, suggesting that the management of BMI is useful in managing the disease pathology [2].
By contrast, in the health class group, BMI had positive correlations with grip strength and calf circumference and a negative correlation with the two-step value, which is an indicator for estimating BMI and walking ability. On the basis of these findings, it appears that maintaining BMI within the proper range can help maintain grip and leg muscle strength. In persons with high BMIs, the two-step value is decreased, suggestive of decreased walking ability and mobility. Thus, increases in fat mass and decreases in muscle mass, for example, the potential development of sarcopenia, were suggested to occur in persons with high BMIs. For this reason, it is also necessary to note that problems other than those evaluated by BMI may remain in elderly persons. In the present study, although the number of cases studied were limited, we preliminary obtained the cutoff values for BMI for managing the items used in the analysis in each group. FPG, TG, LDL-c and SBP had significant correlations with BMI in the diabetes group, and the normal upper limits of BMI for these items were 24.3, 27.1, 21.9 and 23.9, respectively. To maintain BMI at standard values (18.5 - 25) is recommended in the current diabetes management criteria, and the cutoff values obtained for the elderly patients in this study were similar to or slightly higher than this standard recommendation. According to the diagnostic criteria of the Japan Society for the Study of Obesity, a BMI of 25 - 30 is defined as obesity class 1 [21]. If there are no obesity-related complications, it is indicated to be simple obesity. In the health class group, the items significantly correlated with BMI were grip strength and two-step values, and the normal upper limits of BMI for these variables were 22.7 and 25.2, respectively. When leg strength and mobility were maintained, the cutoff value was 25.2, indicating that simple obesity of the mildest class may be tolerated in the elderly.
However, different dietary patterns were extracted because of the basic disease status of the elderly persons, the ratio of men to women in the subject groups and differences in regional characteristics and lifestyle habits.
In the diabetes group, the reduced intake of oils, fats and meat was noted as a characteristic dietary pattern related to BMI. Oils were extracted as a food group negatively correlated with BMI, and such dietary habits were identified in female patients. In this study group, female patients had relatively higher BMI levels than males, and the tendency to refrain from oil and fat consumption was reasonably explained. Referring to the previously learned dietary therapy, outpatients would precipitate dietary habits incorporating a freedom with some degree of preferences tolerable to blood glucose/serum lipid control. This kind of flexible control may be effective as part of self-management supports in patients undergoing sustainable therapy. In addition, it was recognized that optimization of BMI is useful for improving blood pressure as well as blood glucose and serum lipid levels. In dietary care guidance for elderly patients with type 2 diabetes mellitus, to manage blood glucose and serum lipid levels, it is important to consider a low-lipid diet within the proper energy intake range and encourage the continuation of self-management during long-term care. In the health class group, the intake of sweets was notable, and eating behavior in which preferred foods were dominant such as fishes seasoned by the subject’s favorite flavor was characteristic of dietary patterns related to BMI. Moreover, seasoning spices was extracted as a food group exhibiting a positive correlation with BMI, and meat was extracted as a food group displaying a negative correlation with BMI, illustrating the necessity of reducing salt intake, increasing meat intake, and eating balanced meals.
To date, dietary patterns have been analyzed regarding metabolic syndrome (MetS) and type 2 diabetes mellitus. Reportedly, is related to low whole grain intake [22-25] and high intake of sweetened beverages [23-25], white bread made from wheat flour, refined cereals [23, 26], snacks [22] and processed meat [22, 26, 27]. Analysis of dietary patterns for type 2 diabetes mellitus has also been reported regarding the relationship with various response variables including nutrient intake [28], inflammatory markers [29] and biomarkers [30]. Other dietary pattern studies indicated that the intake of some leguminous plants and vegetables is considered protective against cardiovascular disease or diabetes mellitus [29-31]. Moreover, some foods are not consumed by themselves, and they may be related to the intake of other foods. For example, dressing is used with vegetables, and in many cases, it is consumed with a meal consisting of bread. In the subject group of the present study, food groups such as meats and fishes in addition to factor groups with high factor burdens such as sugar, oils were extracted as factors constituting the extracted dietary patterns. Seasoning spices such as sugar, oils are used in cooking methods such as boiling, stir frying and deep-frying. Therefore, eating habits specific to the study population may unexpectedly amplify the factor burden of foods and weaken the robustness of the derived dietary patterns. Therefore, it is important to understand characteristics such as the age group and locality of the subject groups.
On the basis of these findings, proper management of BMI was useful for preventing the exacerbation of disease and the onset of complications in patients with diabetes mellitus, whereas in the control group, BMI appeared to be an indicator contributing to the maintenance of grip and leg strength. However, in elderly persons, the potential progression of sarcopenia was suggested in persons with high BMIs, and therefore, problems that cannot be evaluated only by BMI management remain. Regardless of the presence or absence of disease, it is important to manage BMI to maintain and improve daily health in elderly persons, indicating the significance of close investigation of the dietary factors that affect BMI. It can be anticipated that further comprehensive evaluation of combinations of food products will contribute to the improvement of healthy life expectancy.
Limitations of the study
The present study had several limitations that must be considered. First, the present study was a cross-sectional study that cannot prove causality. Second, because the number of subjects was small, it cannot be denied that the generalizability of results may be limited. Third, multivariate analysis does not consider confounding factors such as socioeconomic status or the influence of exercise habits. Fourth, because the dietary survey was evaluated using a self-reported questionnaire, recall bias may have occurred. Therefore, it is necessary to consider the possibility that inaccuracies or misreports are included in the results, causing a certain degree of error [32, 33].
Conclusion
In the present study, extracting and analyzing dietary habits were found to be effective for clarifying the dietary factors and problems affecting BMI. Furthermore, managing BMI in elderly persons is useful as care management indicators of blood glucose, blood pressure and serum lipid in patients with type 2 diabetes mellitus, and it may be useful for maintaining grip and muscle strength in general elderly persons with a moderate degree of activity such as those participating in health classes.
Acknowledgments
We are deeply indebted to all study subjects for their understanding and cooperation with the study.
Financial Disclosure
None to declare.
Conflict of Interest
We declare that we have no conflict of interest.
Informed Consent
The contents of the study were explained to the subjects in advance, and written informed consent was obtained.
Author Contributions
Yasuko Fukuda drew up research plan, did matters regarding ethical research screening, provided detailed explanation of research to subjects, collected/analyzed data and prepared initial draft. Yumi Umeno did matters regarding ethical research screening and collected data. Yuko Taniguchi collected data. Satoko Marukawa explained research to subjects and obtain their consent. Hiroko Kurihara explained research to subjects and obtained their consent. Hiromu Nakajima drew up research plan and did guidance/advice regarding English translation. Tomoyuki Yamasaki did matters regarding ethical research screening, explained research to subjects and obtained their consent.
| References | ▴Top |
- Hishida A, Sasaki S, Ed. Ministry of Health, Labour and Welfare "Dietary Reference Intake for Japanese, 2015" formulation review committee report. Dietary Reference Intake for Japanese. Tokyo. 2015:153-163. (in Japanese).
- Haneda M, Noda M, Origasa H, Noto H, Yabe D, Fujita Y, Goto A, et al. Japanese Clinical Practice Guideline for Diabetes 2016. J Diabetes Investig. 2018;9(3):657-697.
doi pubmed - Tamakoshi A, Yatsuya H, Lin Y, Tamakoshi K, Kondo T, Suzuki S, Yagyu K, et al. BMI and all-cause mortality among Japanese older adults: findings from the Japan collaborative cohort study. Obesity (Silver Spring). 2010;18(2):362-369.
doi pubmed - Garrow JS, Webster J. Quetelet's index (W/H2) as a measure of fatness. Int J Obes. 1985;9(2):147-153.
- Freedman DS, Horlick M, Berenson GS. A comparison of the Slaughter skinfold-thickness equations and BMI in predicting body fatness and cardiovascular disease risk factor levels in children. Am J Clin Nutr. 2013;98(6):1417-1424.
doi pubmed - Wohlfahrt-Veje C, Tinggaard J, Winther K, Mouritsen A, Hagen CP, Mieritz MG, de Renzy-Martin KT, et al. Body fat throughout childhood in 2647 healthy Danish children: agreement of BMI, waist circumference, skinfolds with dual X-ray absorptiometry. Eur J Clin Nutr. 2014;68(6):664-670.
doi pubmed - Sun Q, van Dam RM, Spiegelman D, Heymsfield SB, Willett WC, Hu FB. Comparison of dual-energy x-ray absorptiometric and anthropometric measures of adiposity in relation to adiposity-related biologic factors. Am J Epidemiol. 2010;172(12):1442-1454.
doi pubmed - Flegal KM, Graubard BI. Estimates of excess deaths associated with body mass index and other anthropometric variables. Am J Clin Nutr. 2009;89(4):1213-1219.
doi pubmed - Willett K, Jiang R, Lenart E, Spiegelman D, Willett W. Comparison of bioelectrical impedance and BMI in predicting obesity-related medical conditions. Obesity (Silver Spring). 2006;14(3):480-490.
doi pubmed - Sasaki S. Chapter 1 Dietary assessment methods 4. Validity and precision of dietary assessment methods. model core curriculum standards in registered dietitian training courses-dietary intake standards-theory and application. In: Vol. 2 Specified Nonprofit Corporation Japanese Society of Nutrition and Dietetics, editorial supervision (Suzuki I, Kido Y, eds), 2012:24-36 (in Japanese).
- Kobayashi S, Honda S, Murakami K, Sasaki S, Okubo H, Hirota N, Notsu A, et al. Both comprehensive and brief self-administered diet history questionnaires satisfactorily rank nutrient intakes in Japanese adults. J Epidemiol. 2012;22(2):151-159.
doi pubmed - Kant AK. Dietary patterns and health outcomes. J Am Diet Assoc. 2004;104(4):615-635.
doi pubmed - Imamura F, Lichtenstein AH, Dallal GE, Meigs JB, Jacques PF. Generalizability of dietary patterns associated with incidence of type 2 diabetes mellitus. Am J Clin Nutr. 2009;90(4):1075-1083.
doi pubmed - Zamora D, Gordon-Larsen P, He K, Jacobs DR, Jr., Shikany JM, Popkin BM. Are the 2005 Dietary Guidelines for Americans Associated With reduced risk of type 2 diabetes and cardiometabolic risk factors? Twenty-year findings from the CARDIA study. Diabetes Care. 2011;34(5):1183-1185.
doi pubmed - Liese AD, Nichols M, Sun X, D'Agostino RB, Jr., Haffner SM. Adherence to the DASH Diet is inversely associated with incidence of type 2 diabetes: the insulin resistance atherosclerosis study. Diabetes Care. 2009;32(8):1434-1436.
doi pubmed - MEXT. 2008. Guidelines for new strength test and Q&A. In: Meaningful utilization of new physical fitness test, 8th ed. Tokyo: Gyosei, 2008:5-50. (in Japanese).
- Shimokata H, Ando F. [Association of daily physical performance with muscle volume and strength]. Nihon Ronen Igakkai Zasshi. 2012;49(2):195-198.
doi pubmed - Muranaga S, Hirano K. Development of a convenient way to predict ability to walk, using a two-step test. Journal of the Showa Medical Association. 2003;63:301308.
- Stevens J, Cai J, Pamuk ER, Williamson DF, Thun MJ, Wood JL. The effect of age on the association between body-mass index and mortality. N Engl J Med. 1998;338(1):1-7.
doi pubmed - Prospective Studies C, Whitlock G, Lewington S, Sherliker P, Clarke R, Emberson J, Halsey J, et al. Body-mass index and cause-specific mortality in 900 000 adults: collaborative analyses of 57 prospective studies. Lancet. 2009;373(9669):1083-1096.
doi - Kanazawa M, Yoshiike N, Osaka T, Numba Y, Zimmet P, Inoue S. Criteria and classification of obesity in Japan and Asia-Oceania. World Rev Nutr Diet. 2005;94:1-12.
doi pubmed - Villegas R, Salim A, Flynn A, Perry IJ. Prudent diet and the risk of insulin resistance. Nutr Metab Cardiovasc Dis. 2004;14(6):334-343.
doi - Gittelsohn J, Wolever TM, Harris SB, Harris-Giraldo R, Hanley AJ, Zinman B. Specific patterns of food consumption and preparation are associated with diabetes and obesity in a Native Canadian community. J Nutr. 1998;128(3):541-547.
doi pubmed - Dhingra R, Sullivan L, Jacques PF, Wang TJ, Fox CS, Meigs JB, D'Agostino RB, et al. Soft drink consumption and risk of developing cardiometabolic risk factors and the metabolic syndrome in middle-aged adults in the community. Circulation. 2007;116(5):480-488.
doi pubmed - Schulze MB, Manson JE, Ludwig DS, Colditz GA, Stampfer MJ, Willett WC, Hu FB. Sugar-sweetened beverages, weight gain, and incidence of type 2 diabetes in young and middle-aged women. JAMA. 2004;292(8):927-934.
doi pubmed - Fung TT, Schulze M, Manson JE, Willett WC, Hu FB. Dietary patterns, meat intake, and the risk of type 2 diabetes in women. Arch Intern Med. 2004;164(20):2235-2240.
doi pubmed - van Dam RM, Rimm EB, Willett WC, Stampfer MJ, Hu FB. Dietary patterns and risk for type 2 diabetes mellitus in U.S. men. Ann Intern Med. 2002;136(3):201-209.
doi pubmed - Hoffmann K, Schulze MB, Schienkiewitz A, Nothlings U, Boeing H. Application of a new statistical method to derive dietary patterns in nutritional epidemiology. Am J Epidemiol. 2004;159(10):935-944.
doi pubmed - Schulze MB, Hoffmann K, Manson JE, Willett WC, Meigs JB, Weikert C, Heidemann C, et al. Dietary pattern, inflammation, and incidence of type 2 diabetes in women. Am J Clin Nutr. 2005;82(3):675-684; quiz 714-675.
doi pubmed - Heidemann C, Hoffmann K, Spranger J, Klipstein-Grobusch K, Mohlig M, Pfeiffer AF, Boeing H, et al. A dietary pattern protective against type 2 diabetes in the European Prospective Investigation into Cancer and Nutrition (EPIC) - Potsdam Study cohort. Diabetologia. 2005;48(6):1126-1134.
doi pubmed - Hoffmann K, Zyriax BC, Boeing H, Windler E. A dietary pattern derived to explain biomarker variation is strongly associated with the risk of coronary artery disease. Am J Clin Nutr. 2004;80(3):633-640.
doi pubmed - Freedman LS, Schatzkin A, Midthune D, Kipnis V. Dealing with dietary measurement error in nutritional cohort studies. J Natl Cancer Inst. 2011;103(14):1086-1092.
doi pubmed - Livingstone MB, Black AE. Markers of the validity of reported energy intake. J Nutr. 2003;133(Suppl 3):895S-920S.
doi pubmed
This article is distributed under the terms of the Creative Commons Attribution Non-Commercial 4.0 International License, which permits unrestricted non-commercial use, distribution, and reproduction in any medium, provided the original work is properly cited.
Journal of Clinical Medicine Research is published by Elmer Press Inc.