Figure 1. The change of tenascin-C levels between baseline and first month in all study groups. (Group 1: Total-PCI group; Group 2: Total-medical group; Group 3: Subtotal-PCI group; BL: baseline; FM: first month).
| Journal of Clinical Medicine Research, ISSN 1918-3003 print, 1918-3011 online, Open Access |
| Article copyright, the authors; Journal compilation copyright, J Clin Med Res and Elmer Press Inc |
| Journal website http://www.jocmr.org |
Original Article
Volume 4, Number 1, February 2012, pages 20-25
The Importance of Cardiac Biomarkers on Remodelling After Myocardial Infarction
Figure
Tables
| Total-PCI Group (n: 18) | Total-Medical Group (n: 19) | Subtotal-PCI Group (n: 20) | P value | |
| Data expressed as mean ± SD, P < 0.05 was accepted as a statistically significant. DM: diabetes mellitus; HT: hypertension; CVD: cerebrovascular disease; LDL-C: low density lipoprotein; HDL-C: high density lipoprotein; T.CHOL: total cholesterol; TG: trigliseride | ||||
| Age | 62 ± 12 | 65 ± 8 | 59 ± 12 | 0.2 |
| Female (n, %) | 5 (27) | 6 (31) | 6 (30) | 0.9 |
| DM (n, %) | 8 (44) | 9 (47) | 4 (20) | 0.1 |
| HT (n, %) | 9 (50) | 10 (52) | 6 (30) | 0.3 |
| Smoke (n, %) | 11 (61) | 10 (52) | 12 (60) | 0.8 |
| CVD (n, %) | 1 (5) | 2 (10) | 0 | 0.3 |
| NYHA Class (n, %) | ||||
| I | 7 (39) | 8 (42) | 9 (45) | 0.9 |
| II | 11(61) | 11(58) | 11(55) | 0.9 |
| III- IV | 0 | 0 | 0 | |
| Blood Pressure(mmHg) | ||||
| Diastolic | 82 ± 18 | 85 ± 15 | 75 ± 11 | 0.1 |
| Systolic | 133 ± 23 | 137 ± 28 | 125 ± 22 | 0.3 |
| Creatinine (mg/dL) | 1.0 ± 0.2 | 1.1 ± 0.4 | 0.9 ± 0.1 | 0.1 |
| Lipid profile (mg/dL) | ||||
| LDL-C | 120 ± 29 | 116 ± 43 | 118 ± 34 | 0.9 |
| HDL-C | 39 ± 9 | 41 ± 10 | 37 ± 8 | 0.4 |
| T.CHOL | 192 ± 46 | 183 ± 54 | 184 ± 42 | 0.8 |
| TG | 165 ± 131 | 129 ± 89 | 144 ± 80 | 0.5 |
| Total- PCI Group (n = 18) | Baseline | First month | P value |
| Data expressed as mean ± SD, P < 0.05 was accepted as a statistically significant. NT-proBNP: N- terminal natriuretic peptide; CRP: C-reaktive protein | |||
| TENASCIN- C (ng/mL) | 24 ± 12 | 14 ± 8 | 0.01 |
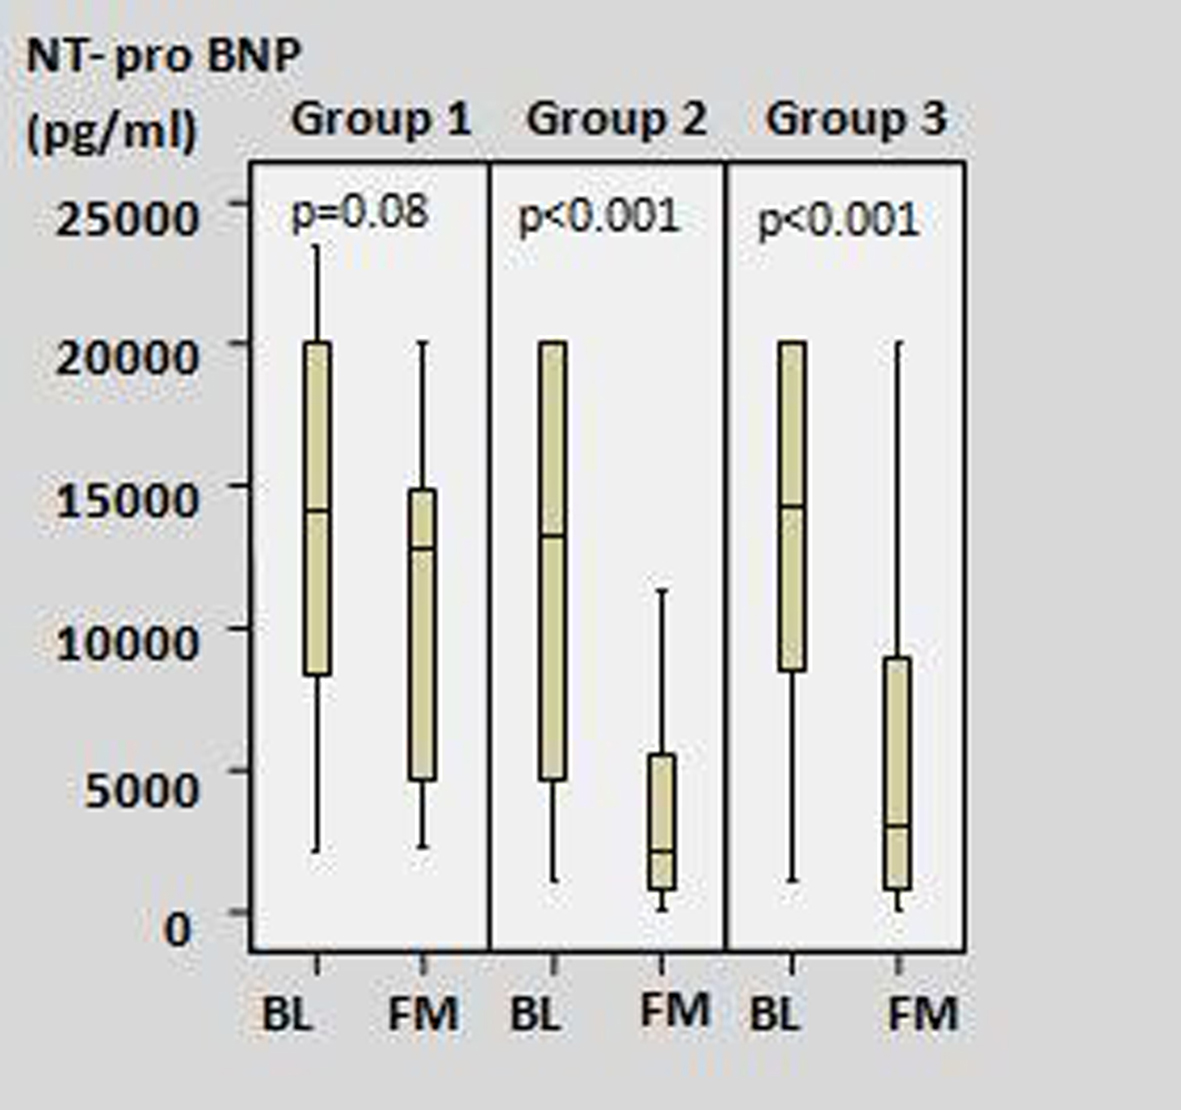
| NT-PROBNP (pg/mL) | 14311 ± 6962 | 11249 ± 5918 | 0.08 |
| CRP (mg/dL) | 24 ± 6 | 10 ± 2 | 0.07 |
| Total-Medical Group (n = 19) | |||
| TENASCIN-C (ng/mL) | 21 ± 8 | 13 ± 4 | < 0.001 |
| NT-PROBNP (pg/mL) | 12284 ± 7527 | 3661 ± 3973 | < 0.001 |
| CRP (mg/dL) | 82 ± 12 | 8 ± 6 | 0.003 |
| Subtotal-PCI Group (n = 20) | |||
| TENASCIN-C (ng/mL) | 22 ± 7 | 13 ± 5 | < 0.001 |
| NT-PROBNP (pg/mL) | 15329 ± 6281 | 5305 ± 6141 | < 0.001 |
| CRP (mg/dL) | 23 ± 4 | 5 ± 2 | 0.004 |
| Total- PCI Group (n = 18) | Baseline | First month | P value |
| Data expressed as mean ± SD, P < 0.05 was accepted as a statistically significant. LVEDV: Left ventricular enddiastolic volume; LVESV: Left ventricular endsystolic volume; LVEF: Left ventricular ejection fraction | |||
| LVESV (mL/mm2) | 59 ± 27 | 68 ± 26 | 0.03 |
| LVEDV (mL/mm2) | 98 ± 35 | 114 ± 35 | 0.01 |
| LVEF (%) | 39 ± 8 | 40 ± 8 | 0.1 |
| Total-Medical Group (n = 19) | |||
| LVESV (mL/mm2) | 75 ± 23 | 82 ± 25 | 0.1 |
| LVEDV (mL/mm2) | 113 ± 27 | 126 ± 29 | 0.05 |
| LVEF (%) | 35 ± 9 | 36 ± 9 | 0.2 |
| Subtotal-PCI Group (n = 20) | |||
| LVESV (mL/mm2) | 66 ± 30 | 68 ± 32 | 0.4 |
| LVEDV (mL/mm2) | 113 ± 40 | 115 ± 38 | 0.5 |
| LVEF (%) | 42 ± 9 | 42 ± 9 | 0.3 |