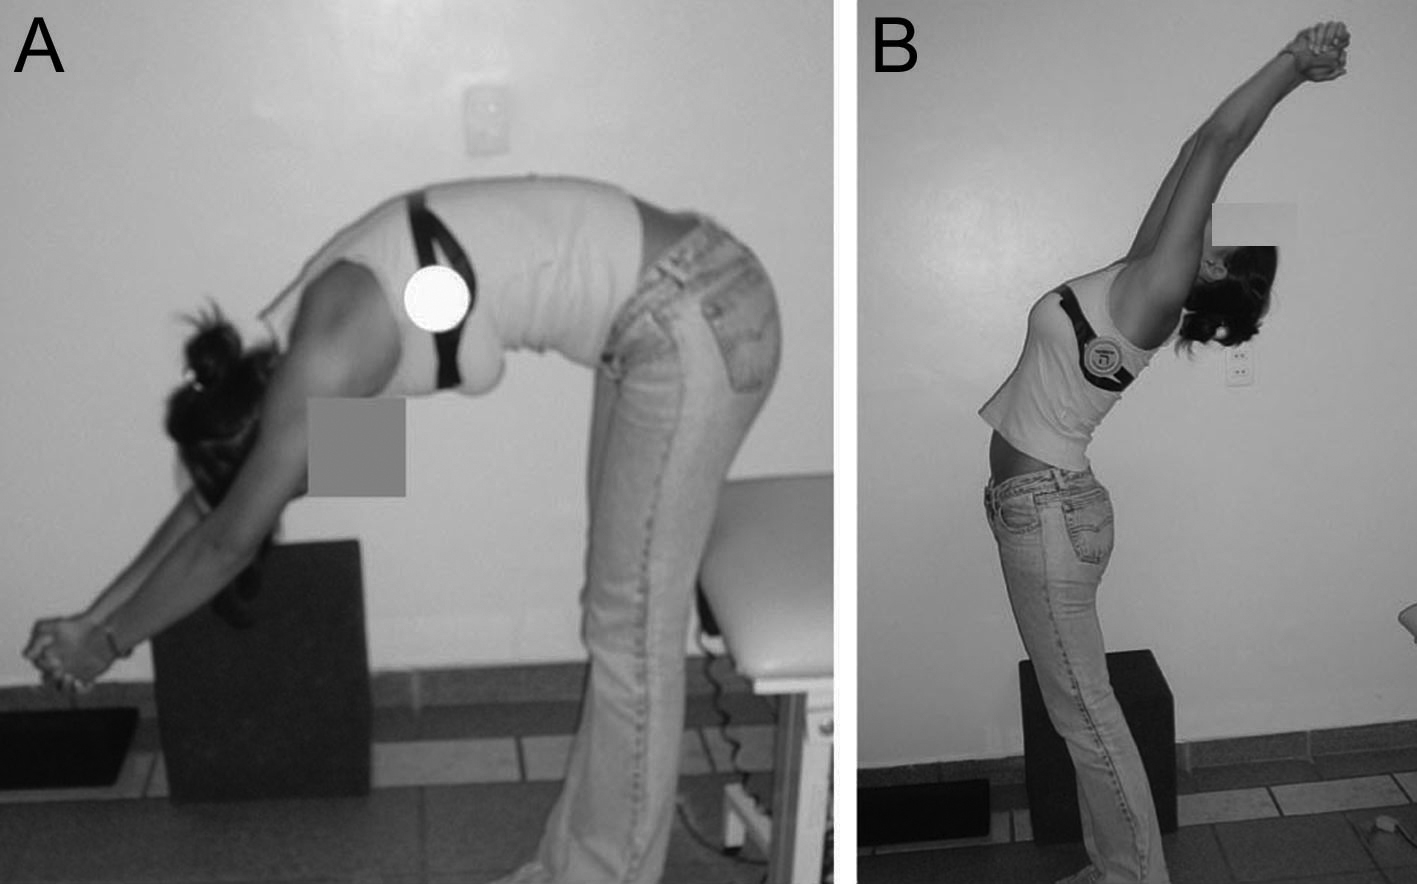
Figure 1.. Range of motion of the spine, flexion (A) and extension (B), measured with fleximeter®.
| Journal of Clinical Medicine Research, ISSN 1918-3003 print, 1918-3011 online, Open Access |
| Article copyright, the authors; Journal compilation copyright, J Clin Med Res and Elmer Press Inc |
| Journal website http://www.jocmr.org |
Original Article
Volume 3, Number 4, August 2011, pages 168-176
Postmenopausal Women With Osteoporosis and Musculoskeletal Status: A Comparative Cross-Sectional Study
Figures
Tables
| Variable | Women with Osteoporosis (n = 30) (mean ± SD) | Women without Osteoporosis (n = 33) (mean ± SD) | P-value* |
|---|---|---|---|
| * Mann-Whitney non-parametric test | |||
| Age (years) | 57.40 ± 5.21 | 55.76 ± 5.76 | 0.35 |
| Education (years of schooling) | 3.70 ± 4.36 | 5.24 ± 4.33 | 0.09 |
| Age at menopause (years) | 46.70 ± 7.15 | 45.33 ± 5.94 | 0.23 |
| Time since menopause (years) | 11.00 ± 6.65 | 11.06 ± 6.53 | 0.97 |
| Weight (kg) | 57.70 ± 13.64 | 71.34 ± 13.57 | < 0.01 |
| Height (cm) | 142.29 ± 32.62 | 150.23 ± 27.43 | 0.01 |
| BMI (kg/m2) | 25.62 ± 6.34 | 29.74 ± 5.90 | < 0.01 |
| Variable | Women with osteoporosis (n = 30) (mean ± SD) | Women without osteoporosis (n = 33) (mean ± SD) | P-value* |
|---|---|---|---|
| * Mann-Whitney non-parametric test | |||
| Muscular strength | |||
| Trunk flexors | 1.43 ± 0.50 | 2.00 ± 0.79 | < 0.01 |
| Trunk extensors | 1.10 ± 0.48 | 2.09 ± 0.98 | < 0.01 |
| Range of motion | |||
| Spine flexion | 88.17 ± 13.74 | 86.67 ± 16.85 | 0.91 |
| Spine extension | 20.50 ± 9.68 | 28.48 ± 10.12 | < 0.01 |
| Angles of the sagittal curvatures of the spine | Women with osteoporosis | Women without osteoporosis | P-value* | |||
|---|---|---|---|---|---|---|
| n | Mean ± SD | n | Mean ± SD | |||
| * Mann-Whitney non-parametric test | ||||||
| Thoracic kyphosis angle | T1 | 18 | 60.94 ± 4.80 | 17 | 49.82 ± 3.83 | < 0.01 |
| T2 | 26 | 60.77 ± 4.94 | 23 | 47.39 ± 5.87 | < 0.01 | |
| T3 | 29 | 60.31 ± 5.13 | 33 | 47.64 ± 6.49 | < 0.01 | |
| T4 | 30 | 62.10 ± 5.64 | 33 | 47.00 ± 6.70 | < 0.01 | |
| Lumbar lordosis angle | 30 | 117.60 ± 8.09 | 33 | 53.12 ± 5.15 | < 0.01 | |
| Balance | Women with osteoporosis (n = 30) | Women without osteoporosis (n = 33) | P-value | ||
|---|---|---|---|---|---|
| * Fisher's exact test; ** Chi-square test; *** Mann-Whitney non-parametric test | |||||
| Static | Grade (%) | negative | 73.3 | 78.8 | 0.61** |
| positive | 26.7 | 21.2 | |||
| Time (mean) | 52.43 ± 15.50 | 52.58 ± 15.92 | 0.99*** | ||
| Dynamic | Grade (%) | 3 | 9.1 | 10.0 | 0.48* |
| 2 | 12.1 | 3.3 | |||
| 1 | 78.8 | 86.7 | |||
| Time (mean) | 27.00 ± 18.28 | 25.60 ± 19.30 | 0.61*** | ||
| Variable | Estimated parameter | Coefficient error | R2 | P-value* |
|---|---|---|---|---|
| * Adjusted for BMI, age, use of HT, physical activity and age at menopause. | ||||
| Range of motion: extension spine | 0.0036 | 0.0020 | 0.143 | 0.03 |
| T4 kyphosis angle | -0.0125 | 0.0019 | 0.603 | < 0.01 |