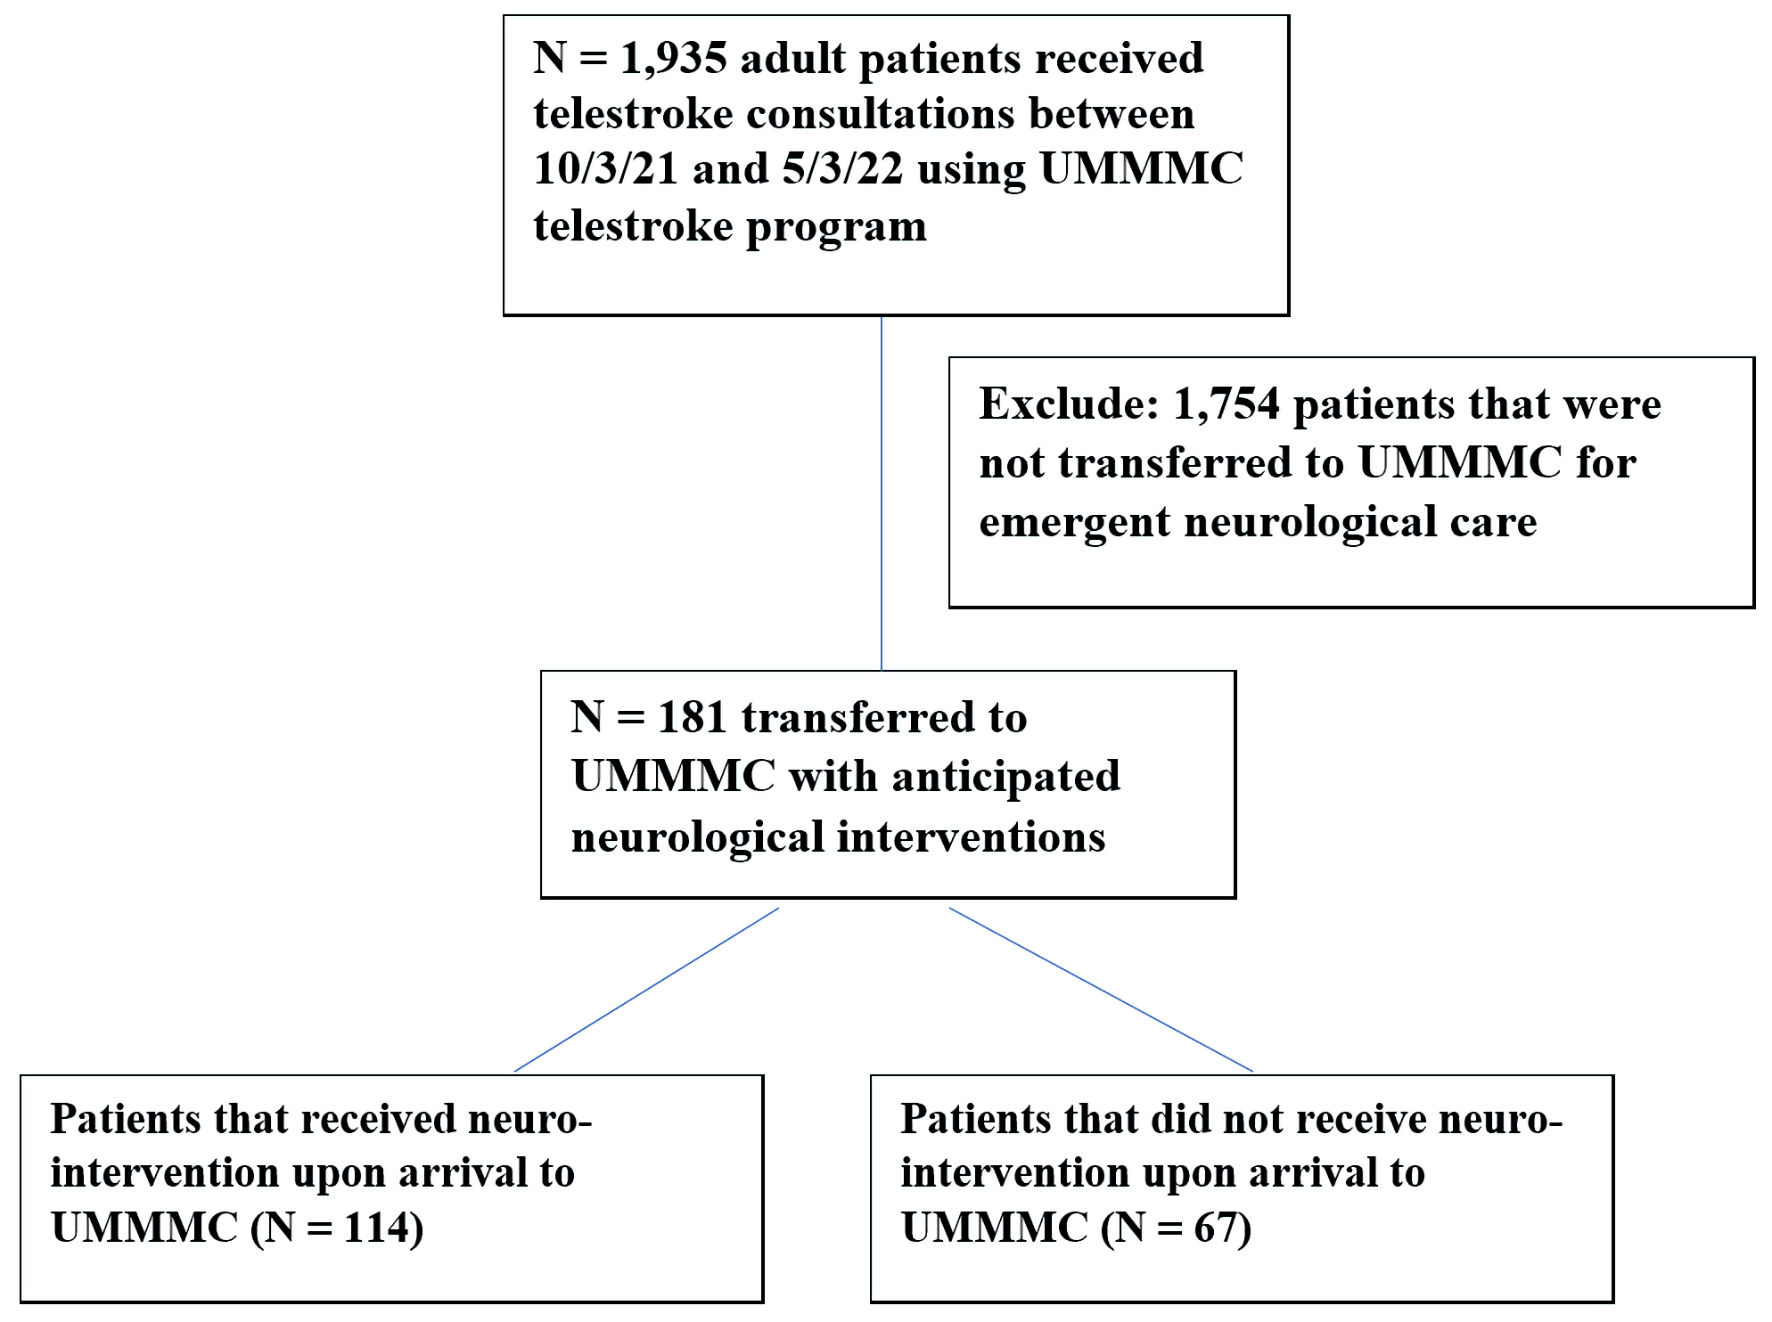
Figure 1. Patient flow. UMMMC: University of Massachusetts Memorial Medical Center.
| Journal of Clinical Medicine Research, ISSN 1918-3003 print, 1918-3011 online, Open Access |
| Article copyright, the authors; Journal compilation copyright, J Clin Med Res and Elmer Press Inc |
| Journal website https://www.jocmr.org |
Original Article
Volume 15, Number 6, June 2023, pages 292-299
Outcomes of Telestroke Inter-Hospital Transfers Among Intervention and Non-Intervention Patients
Figure
Tables
| No intervention (n = 67), % | Intervention (n = 114), % | P value | |
|---|---|---|---|
| ICU: intensive care unit; IQR: interquartile range; tPA: tissue plasminogen activator; mRS: modified Rankin scale; NIHSS: National Institutes of Health Stroke Scale; DNR: do not resuscitate; DNI: do not intubate; CMO: comfort measures only; EVD: external ventricular drains; EEG: electroencephalogram; PEG: percutaneous endoscopic gastrostomy. | |||
| Age, median (IQR) | 65 (55 - 76) | 66 (58 - 75) | 0.406 |
| Gender | 0.661 | ||
| Female | 34 (50.7%) | 54 (47.4%) | |
| Male | 33(49.3%) | 60 (52.6%) | |
| Medical history | |||
| Hypertension | 41 (61.2%) | 87 (76.3%) | 0.031 |
| Hyperlipidemia | 43 (64.2%) | 82 (71.9%) | 0.276 |
| Diabetes mellitus | 20 (29.9%) | 37 (32.5%) | 0.716 |
| History of stroke | 10 (14.9%) | 17 (14.9%) | 0.998 |
| Atrial fibrillation | 8 (11.9%) | 28 (24.6%) | 0.040 |
| Coronary artery disease | 16 (23.9%) | 17 (14.9%) | 0.131 |
| Congestive heart failure | 9 (13.4%) | 14 (12.3%) | 0.822 |
| Peripheral arterial disease | 2 (3%) | 4 (3.5%) | 1 |
| Smoking history | 36 (53.7%) | 75 (65.8%) | 0.108 |
| Medications | |||
| Statin use | 42 (62.7%) | 87 (76.3%) | 0.050 |
| Anti-hypertensives use | 43 (64.2%) | 87 (76.3%) | 0.080 |
| Anti-diabetics use | 17 (25.4%) | 33 (28.9%) | 0.604 |
| Anti-platelets use | 31 (46.3%) | 64 (56.1%) | 0.199 |
| Oral anticoagulants use | 9 (13.4%) | 28 (24.6%) | 0.073 |
| Severity of illness on admission | |||
| Presenting NIHSS, median (IQR) | 1 (0 - 3) | 11 (3 - 22) | < 0.001 |
| Presenting mRS, Median (IQR) | 0 (0 - 1) | 0 (0 - 1) | 0.511 |
| Diagnosis | |||
| Ischemic stroke | 24 (35.8%) | 67 (58.8%) | 0.003 |
| Hemorrhagic stroke | 8 (11.9%) | 14 (12.3%) | 0.946 |
| Non-stroke neurological | 35 (52.2%) | 33 (28.9%) | 0.002 |
| Goals of care discussed prior to transfer | |||
| Yes | 2 (3%) | 3 (2.6 %) | 1 |
| Code status upon transfer | |||
| Full code | 55 (82.1%) | 91 (79.8%) | 0.710 |
| DNR/DNI | 8 (11.9%) | 9 (7.9%) | 0.368 |
| CMO | 4 (6%) | 14 (12.3%) | 0.171 |
| Acuity of care upon transfer | < 0.001 | ||
| ICU | 27 (40.3%) | 80 (70.2%) | |
| Floor | 40 (59.7%) | 34 (29.8%) | |
| Interventions upon transfer | |||
| Neurosurgery consult | 28 (41.8%) | 36 (31.6%) | 0.165 |
| IV thrombolysis | 0 (0%) | 30 (26.3%) | < 0.001 |
| Thrombectomy | 0 (0%) | 45 (39.5%) | < 0.001 |
| Craniectomy | 0 (0%) | 8 (7%) | 0.027 |
| EVD | 0 (0%) | 8 (7%) | 0.027 |
| EEG | 0 (0%) | 45 (39.5%) | < 0.001 |
| PEG/tracheostomy | 0 (0%) | 4 (3.5%) | 0.298 |
| Palliative care consult | 4 (6%) | 8 (7%) | 1 |
| Non-intervention (n = 67), % | Intervention (n = 114), % | P value | |
|---|---|---|---|
| IQR: interquartile range; mRS: modified Rankin scale; NIHSS: National Institutes of Health Stroke Scale; LOS: length of stay. | |||
| Death during admission | 7 (10.4%) | 20 (17.5%) | 0.196 |
| LOS, (days) median (IQR) | 3 (1 - 5) | 6 (3 - 10) | < 0.001 |
| Discharge mRS, median (IQR) | 2 (1 - 4) | 4 (2 - 4) | 0.001 |
| Discharge NIHSS, median (IQR) | 0 (0 - 3) | 4 (1 - 14) | < 0.001 |
| Non-intervention (n = 67), % | Intervention (n = 114), % | P value | |
|---|---|---|---|
| Proportions were calculated by excluding 22 unknowns from analyses. IQR: interquartile range; mRS: modified Rankin scale; NIHSS: National Institutes of Health Stroke Scale; CV: cardiovascular. | |||
| 30-day unpreventable readmission | 9 (13.4%) | 16 (14.0%) | 0.910 |
| 90-day outcome events | |||
| No complication | 39 (58.2) | 71 (62.3) | 0.588 |
| Death | 14 (20.9%) | 26 (22.8%) | 0.765 |
| CV event | 3 (4.5%) | 4 (3.5%) | 0.711 |
| 90-day mRS, median (IQR) | 2 (0 - 6) | 3 (1 - 6) | 0.109 |
| 90-day NIHSS, median (IQR) | 0 (0 - 3) | 2 (0 - 11) | 0.004 |