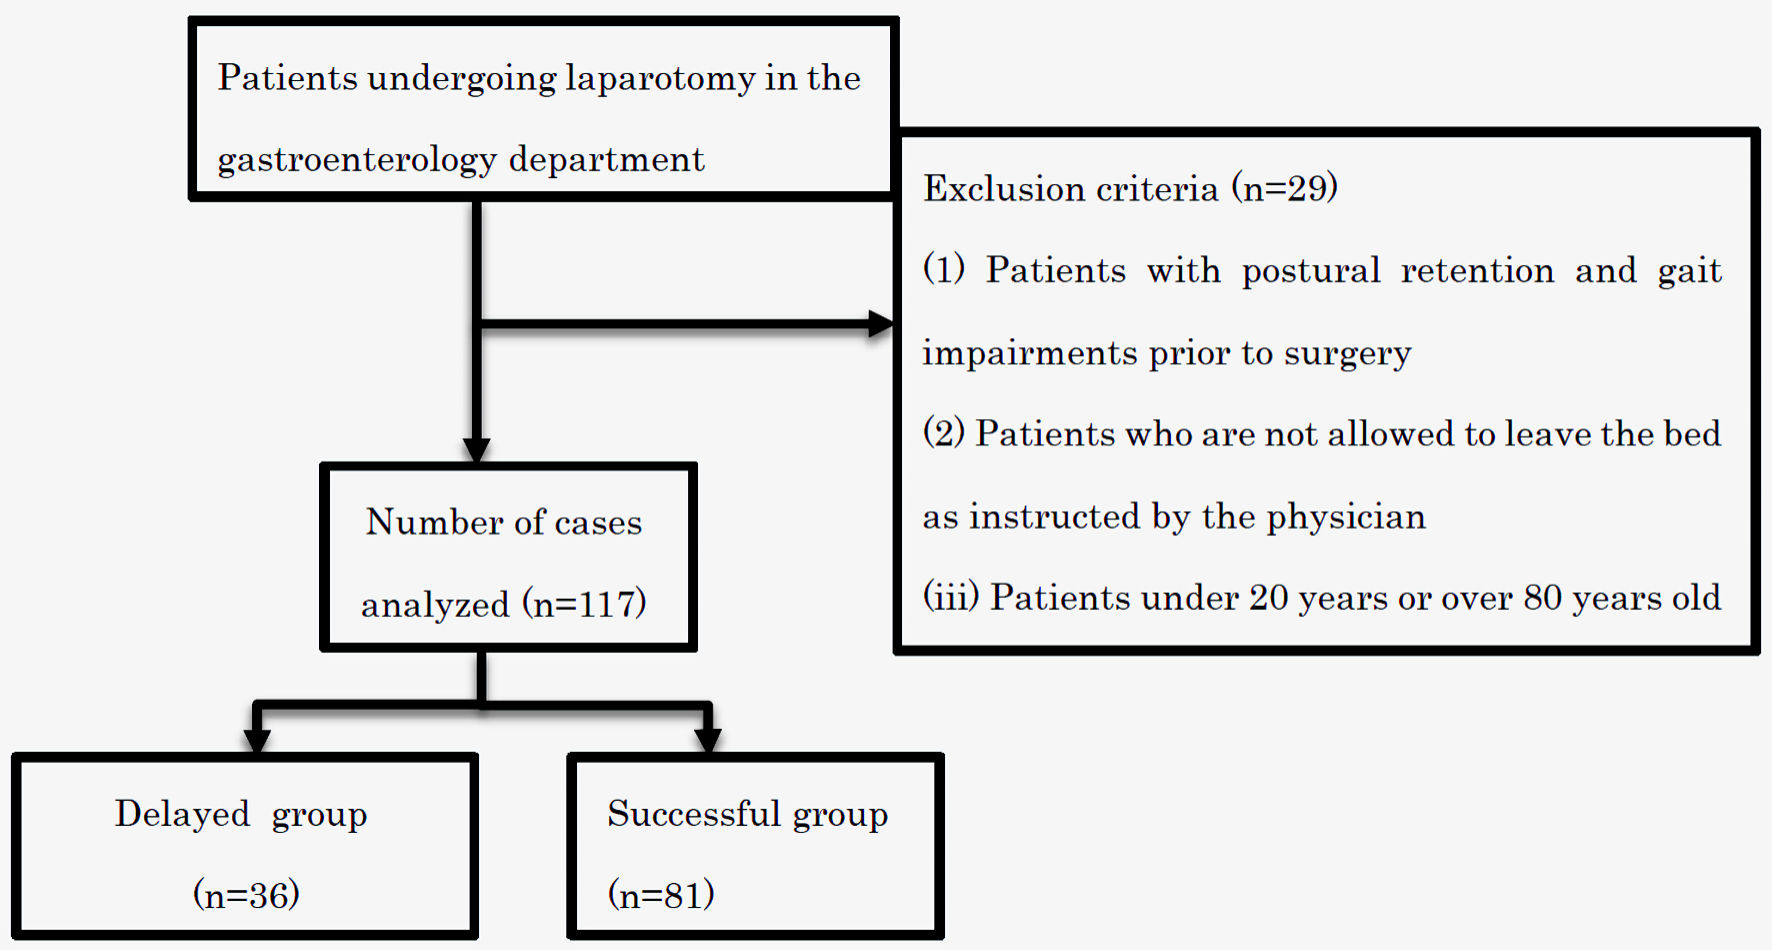
Figure 1. Flowchart of patient selection.
| Journal of Clinical Medicine Research, ISSN 1918-3003 print, 1918-3011 online, Open Access |
| Article copyright, the authors; Journal compilation copyright, J Clin Med Res and Elmer Press Inc |
| Journal website https://www.jocmr.org |
Original Article
Volume 15, Number 5, May 2023, pages 255-261
Differences in Analgesia Methods for Open Gastrointestinal Surgery Are Not Associated With Initial Postoperative Ambulation
Figure
Tables
| Delayed group (n = 36) | Successful group (n = 81) | P value | |
|---|---|---|---|
| Data are expressed as means (SD) or as n (%). Categorical and continuous variables were compared using Fisher’s exact test. SD: standard deviation. | |||
| Age (years) | 66.81 ± 12.04 | 65.62 ± 13.01 | 0.642 |
| Sex | |||
| Female (%) | 15 (41.7) | 33 (40.7) | > 0.999 |
| Male (%) | 21 (58.3) | 48 (59.3) | |
| Height (cm) | 163.73 (8.53) | 163.83 (9.36) | 0.956 |
| Weight (kg) | 57.04 (10.76) | 57.88 (15.46) | 0.766 |
| Surgical site | |||
| Stomach | 4 (11.1) | 9 (11.1) | 0.877 |
| Liver | 6 (16.7) | 11 (13.6) | |
| Pancreas and spleen | 14 (38.9) | 23 (28.4) | |
| Colon | 7 (19.4) | 25 (30.9) | |
| Esophagus | 2 (5.6) | 6 (7.4) | |
| Small intestine | 2 (5.6) | 4 (4.9) | |
| Gall bladder | 1 (2.8) | 3 (3.7) | |
| Preoperative (preparation, diagnosis, etc.) | Postoperative | |||||
|---|---|---|---|---|---|---|
| Delayed group (n = 36) | Successful group (n = 81) | P value | Delayed group (n = 36) | Successful group (n = 81) | P value | |
| Data are expressed as means (SD). Categorical and continuous variables were compared using Fisher’s exact test. ALT: alanine transaminase; APTT: activated partial thromboplastin time; AST: aspartate aminotransferase; BUN: blood urea nitrogen; Cre: creatinine; CRP: C-reactive protein; eGFR: estimated glomerular filtration rate; Hb: hemoglobin; Ht: hematocrit; PLT: platelet; PT%: prothrombin time activity; PT-INR: international normalized ratio of prothrombin time; RBC: red blood cell; WBC: white blood cell; SD: standard deviation. | ||||||
| ALT (U/L) | 22.17 (12.11) | 22.95 (20.22) | 0.83 | 125.36 (191.72) | 85.57 (129.34) | 0.191 |
| AST (U/L) | 25.14 (14.56) | 23.96 (18.12) | 0.731 | 156.31 (228.11) | 99.54 (146.20) | 0.109 |
| BUN (mg/dL) | 12.83 (3.32) | 14.90 (5.70) | 0.045 | 13.85 (6.08) | 15.11 (6.64) | 0.332 |
| Cre (mg/dL) | 0.77 (0.18) | 0.83 (0.27) | 0.25 | 0.76 (0.25) | 0.80 (0.30) | 0.481 |
| CRP (mg/dL) | 1.10 (2.46) | 0.70 (1.35) | 0.258 | 7.48 (5.66) | 7.37 (3.73) | 0.906 |
| eGFR (mL/min/1.73 m2) | 71.79 (14.48) | 69.58 (16.97) | 0.499 | 73.54 (16.76) | 73.90 (21.62) | 0.93 |
| Hb (g/dL) | 12.67 (1.29) | 12.77 (2.12) | 0.808 | 11.47 (1.32) | 11.45 (1.59) | 0.947 |
| Ht (%) | 37.76 (3.48) | 38.09 (5.60) | 0.746 | 34.63 (5.28) | 34.04 (4.50) | 0.539 |
| PLT (10,000/µL) | 23.86 (8.37) | 23.20 (7.77) | 0.68 | 18.92 (7.65) | 18.26 (7.15) | 0.653 |
| PT (s) | 12.17 (1.51) | 12.37 (1.10) | 0.466 | 15.10 (2.02) | 16.27 (9.97) | 0.549 |
| APTT (s) | 28.34 (2.64) | 29.94 (6.66) | 0.199 | 28.93 (6.68) | 30.62 (6.65) | 0.264 |
| PT-INR | 0.98 (0.11) | 1.00 (0.10) | 0.476 | 1.20 (0.15) | 1.23 (0.17) | 0.43 |
| PT% | 104.92 (22.24) | 102.81 (18.84) | 0.619 | 73.71 (13.38) | 74.15 (14.83) | 0.893 |
| RBC (× 106/µL) | 4.11 (0.43) | 4.18 (0.60) | 0.538 | 3.72 (0.50) | 3.77 (0.58) | 0.647 |
| WBC (× 109/L) | 5.64 (2.18) | 6.52 (5.63) | 0.366 | 10.15 (3.56) | 10.88 (4.80) | 0.413 |
| Delayed group (n = 36) | Successful group (n = 81) | P value | |
|---|---|---|---|
| Data are expressed as n (%). Categorical and continuous variables were compared using Fisher’s exact test. ASA-PS: American Society of Anesthesiologists Physical Status. | |||
| ASA-PS | |||
| 1 | 5 (13.9) | 7 (8.6) | 0.61 |
| 2 | 19 (52.8) | 49 (60.5) | |
| 3 | 12 (33.3) | 25 (30.9) | |
| Preoperative walking condition | |||
| Unique | 35 (97.2) | 77 (95.1) | > 0.999 |
| Walking with a cane | 1 (2.8) | 3 (3.7) | |
| Wheelchair | 0 (0.0) | 1 (1.2) | |
| Bedridden | 0 | 0 | |
| Delayed group (n = 36) | Successful group (n = 81) | P value | |
|---|---|---|---|
| Data are expressed as means (SD) or as n (%). Categorical and continuous variables were compared using Fisher’s exact test. IVPCA: intravenous patient-controlled analgesia; SD: standard deviation. | |||
| Anesthesia method | |||
| General anesthesia | 4 (11.1) | 4 (4.9) | 0.094 |
| General anesthesia + epidural anesthesia | 31 (86.1) | 62 (76.5) | |
| General anesthesia + nerve block | 0 (0.0) | 7 (8.6) | |
| General anesthesia + IVPCA | 1 (2.8) | 8 (9.9) | |
| Operation time (min) | 366.89 (164.04) | 330.30 (157.88) | 0.255 |
| Delayed group (n = 36) | Successful group (n = 81) | P value | |
|---|---|---|---|
| Data are expressed as n (%). Categorical and continuous variables were compared using Fisher’s exact test. | |||
| Postoperative analgesia | |||
| Epidural continuous analgesia | 32 (88.9) | 66 (81.5) | 0.534 |
| Intravenous continuous analgesia | 2 (5.6) | 11 (13.6) | |
| Sustained wound infiltration analgesia | 1 (2.8) | 3 (3.7) | |
| Other | 1 (2.8) | 1 (1.2) | |
| Delayed group (n = 36) | Successful group (n = 81) | P value | |
|---|---|---|---|
| Data are expressed as means (SD) or as n (%). Categorical and continuous variables were compared using Fisher’s exact test. NRS: numerical rating scale; SD: standard deviation. | |||
| Used oral analgesics | |||
| Without | 10 (27.8) | 18 (22.2) | 0.639 |
| Existence (at the present moment) | 26 (72.2) | 63 (77.8) | |
| PCA contents | |||
| Local anesthetic only | 10 (27.8) | 18 (22.2) | 0.77 |
| Narcotic + local anesthetic | 4 (11.1) | 9 (11.1) | |
| Narcotic + local anesthetic + Droleptan | 20 (55.6) | 43 (53.1) | |
| Narcotics + Droleptan | 1 (2.8) | 8 (9.9) | |
| Narcotics only | 1 (2.8) | 3 (3.7) | |
| Days until the patient could walk independently (days) | 6.64 (5.27) | 3.83 (2.37) | > 0.999 |
| Days spent in hospital (JP) | 39.36 (48.05) | 25.02 (14.64) | 0.016 |
| NRS | 4.25 (2.51) | 2.48 (1.70) | < 0.001 |