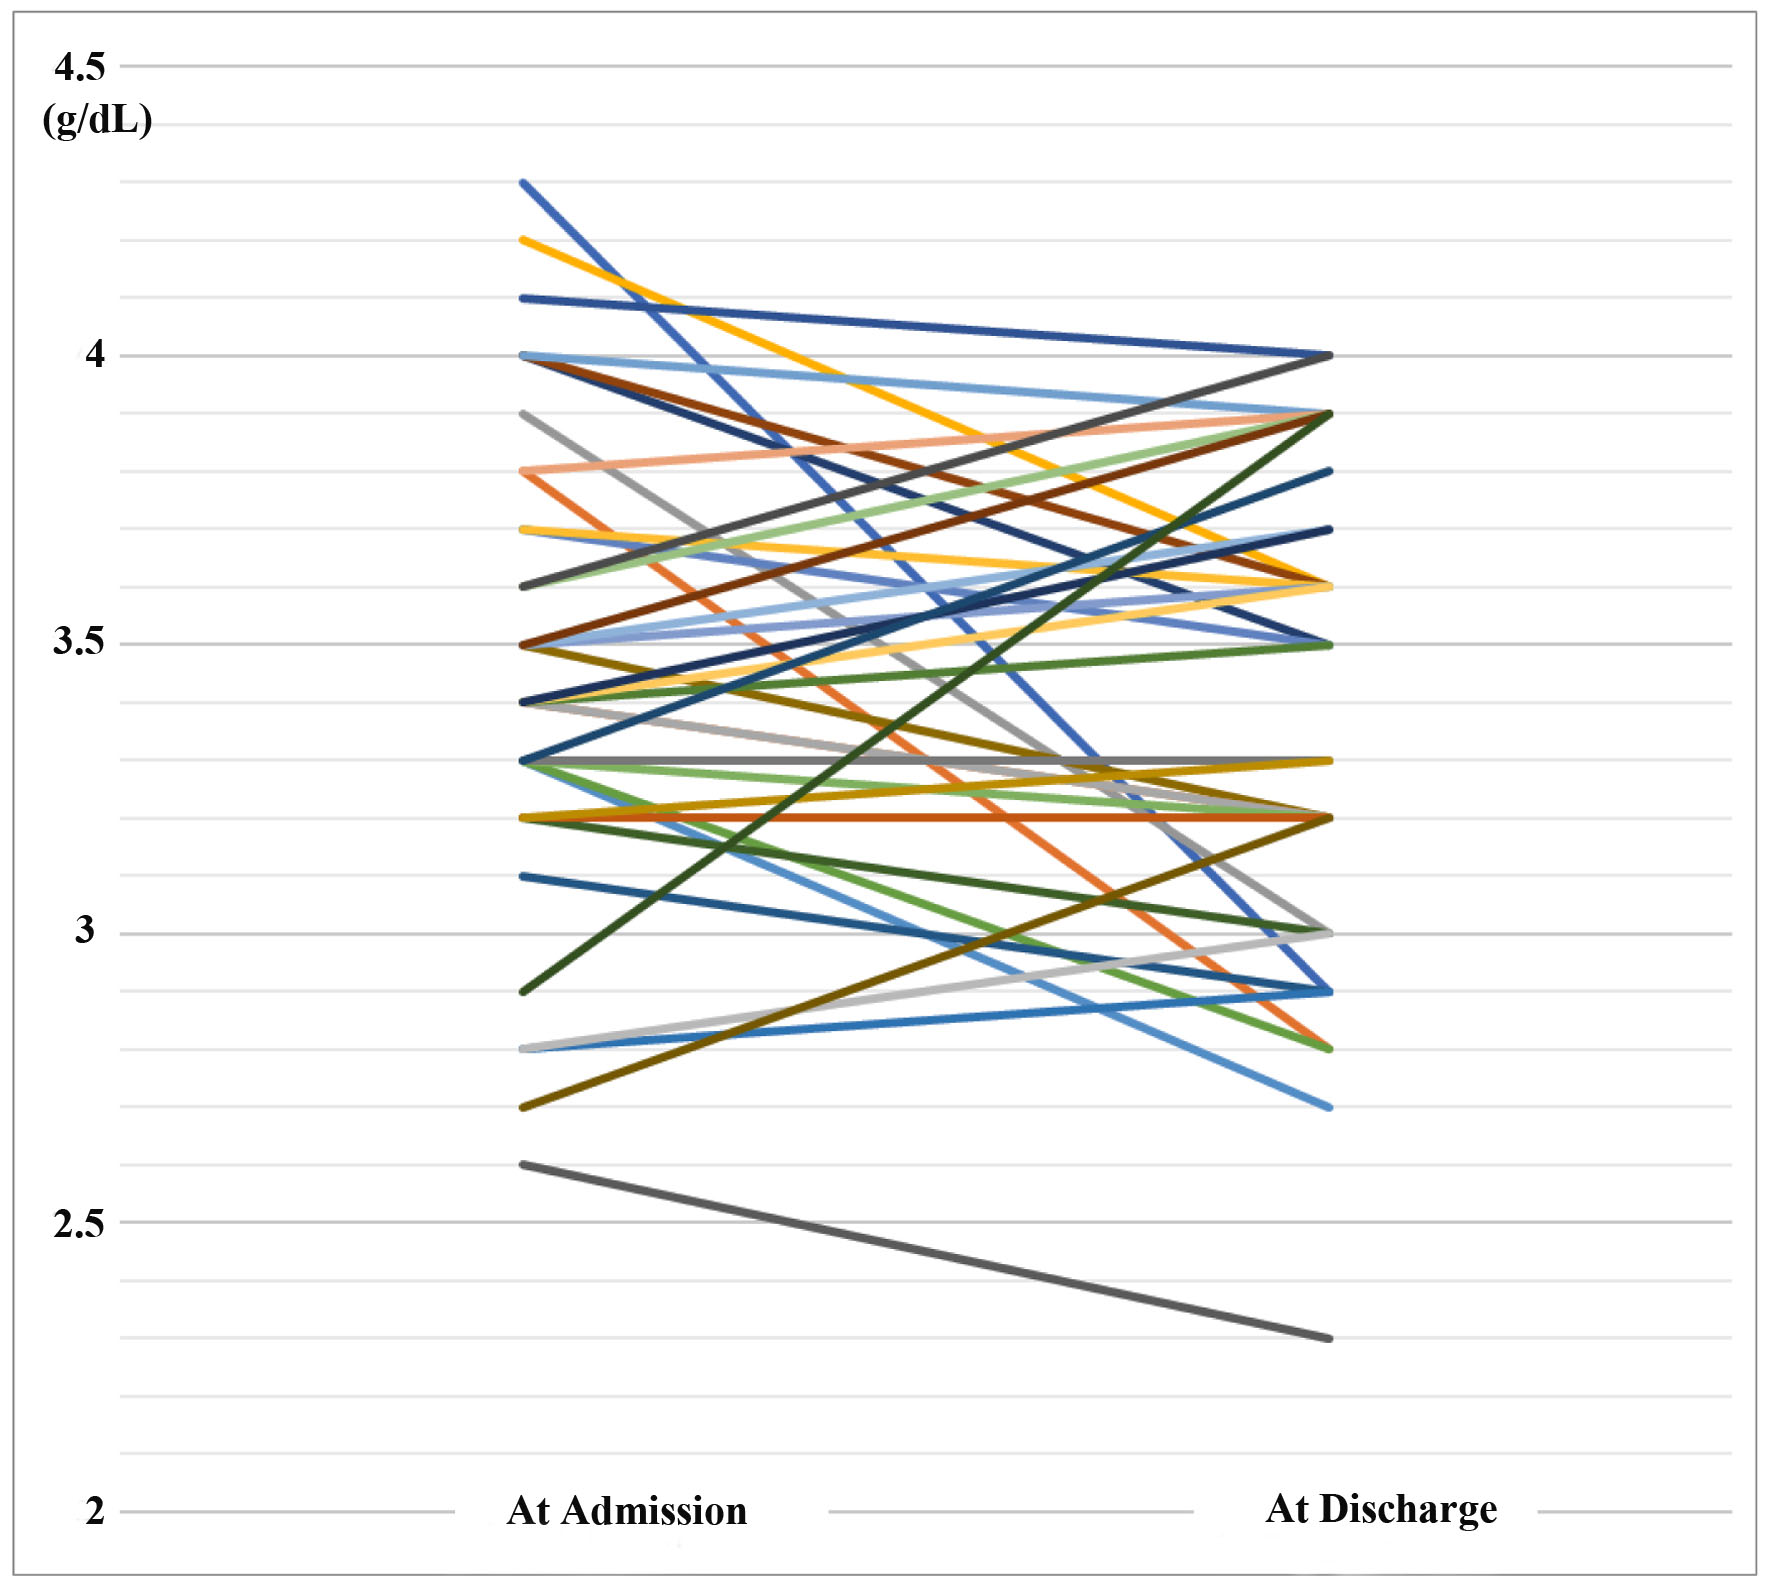
Figure 1. Changes in serum albumin levels at admission and discharge.
| Journal of Clinical Medicine Research, ISSN 1918-3003 print, 1918-3011 online, Open Access |
| Article copyright, the authors; Journal compilation copyright, J Clin Med Res and Elmer Press Inc |
| Journal website https://www.jocmr.org |
Original Article
Volume 15, Number 2, February 2023, pages 109-115
Positive Correlation Between Changes in Serum Albumin Levels and Breakfast Non-Protein Calorie/Nitrogen Ratio in Geriatric Patients
Figure
Tables
| At admission | At discharge | P-value | |
|---|---|---|---|
| Data are expressed as mean ± standard deviation. Paired t-test. The main diseases for admission included chronic heart failure, bronchial pneumonia, chronic obstructive pulmonary disease, and type 2 diabetes; however, these conditions had been treated in the acute care hospital, and thus, patients’ condition became stable. BI: Barthel index; Alb: serum albumin; TC: total cholesterol; TLC: total lymphocyte count; CRP: C-reactive protein; AST: aspartate aminotransferase; ALT: alanine aminotransferase; NPC/N: non-protein calorie/nitrogen ratio. | |||
| Number of patients (male/female) | 36 (20/16) | ||
| Age (years) | 81.7 ± 7.7 | ||
| Duration of hospitalization (days) | 74.0 ± 43.7 | ||
| Charlson co-morbidity index (score) | 2.5 ± 1.2 | ||
| BI (score) | 50.8 ± 41.6 | ||
| Body mass index (kg/m2) | 19.9 ± 3.2 | 19.9 ± 3.0 | 0.953 |
| Alb (g/dL) | 3.5 ± 0.4 | 3.4 ± 0.4 | 0.227 |
| 25-75% | 3.3 - 3.7 | 3.3 - 3.7 | |
| TC (mg/dL) | 173 ± 38 | 175 ± 35 | 0.635 |
| 25-75% | 145 - 195 | 147 - 198 | |
| TLC (/mm3) | 1,422 ± 471 | 1,588 ± 536 | 0.133 |
| 25-75% | 1,129 - 1,718 | 1,278 - 1,817 | |
| CRP (mg/dL) | 0.29 ± 0.42 | 0.4 ± 0.52 | 0.283 |
| 25-75% | 0.03 - 0.33 | 0.07 - 0.52 | |
| AST (IU/L) | 22 ± 8 | 21 ± 6 | 0.128 |
| 25-75% | 16 - 25 | 18 - 23 | |
| ALT (IU/L) | 17 ± 9 | 16 ± 10 | 0.801 |
| 25-75% | 12 - 19 | 10 - 19 | |
| Nutrition intake | |||
| Energy intake (kcal/BW kg/day) | 29.8 ± 6.5 | ||
| Breakfast | 9.5 ± 2.4 | ||
| Lunch | 10.3 ± 2.4 | ||
| Dinner | 10.0 ± 2.4 | ||
| Protein intake (g/BW kg/day) | 1.17 ± 0.28 | ||
| Breakfast | 0.32 ± 0.08 | ||
| Lunch | 0.42 ± 0.12 | ||
| Dinner | 0.43 ± 0.11 | ||
| NPC/N mean | 136 ± 22 | ||
| Breakfast | 167 ± 37 | ||
| Lunch | 140 ± 30 | ||
| Dinner | 130 ± 30 | ||
| Nutrient intake ratio | Dietary pattern | ||
|---|---|---|---|
| First factor | Second factor | Third factor | |
| a|load| > 0.500 were considered as an important factor (in module). | |||
| Breakfast | |||
| Energy intake | 0.317 | 0.551a | 0.134 |
| Protein intake | 0.285 | -0.016 | 0.760a |
| Non-protein energy intake | 0.305 | 0.607a | 0.032 |
| Lunch | |||
| Energy intake | 0.359 | -0.075 | -0.241 |
| Protein intake | 0.328 | -0.395 | 0.217 |
| Non-protein energy intake | 0.351 | 0.000 | -0.334 |
| Dinner | |||
| Energy intake | 0.357 | -0.128 | -0.236 |
| Protein intake | 0.337 | -0.381 | 0.174 |
| Non-protein energy intake | 0.351 | -0.071 | -0.316 |
| Variance explained by each factor (eigenvalue) | 2.666 | 0.940 | 0.809 |
| Proportion of variance (%) | 79.0 | 9.8 | 7.3 |
| Cumulative proportion (%) | 79.0 | 88.8 | 96.1 |
| Regression of coefficient | Standard error | t value | P-value | |
|---|---|---|---|---|
| *P < 0.05, n = 36. Multiple regression analysis. aStepwise method. NPC/N: non-protein calorie/nitrogen ratio. | ||||
| Model 1 | ||||
| Sex | 0.078 | 0.042 | 1.846 | 0.075 |
| First factor | 0.002 | 0.008 | 0.255 | 0.801 |
| Second factor | 0.008 | 0.022 | 0.354 | 0.726 |
| Third factor | -0.055 | 0.025 | -2.164 | 0.038* |
| Model 2a | ||||
| Breakfast NPC/N | 0.043 | 0.019 | 2.282 | 0.029* |
| Lower group | Upper group | P value | |
|---|---|---|---|
| Data are expressed as mean ± standard deviation. Mann-Whitney U test. aFisher’s exact test. Alb: serum albumin; NPC/N: non-protein calorie/nitrogen ratio. | |||
| Number of patients (male/female) | 12 (8/4) | 12 (5/7) | 0.414 |
| Age (years) | 83 ± 4.5 | 79.6 ± 10.1 | 0.296 |
| At discharge Alb/at admission Alb | 0.85 ± 0.08 | 1.11 ± 0.09 | < 0.001 |
| Breakfast NPC/N | -0.35 ± 0.91 | 0.54 ± 1.23 | 0.058 |
| Breakfast (bread/porridge)a | 11/1 | 6/6 | 0.069 |