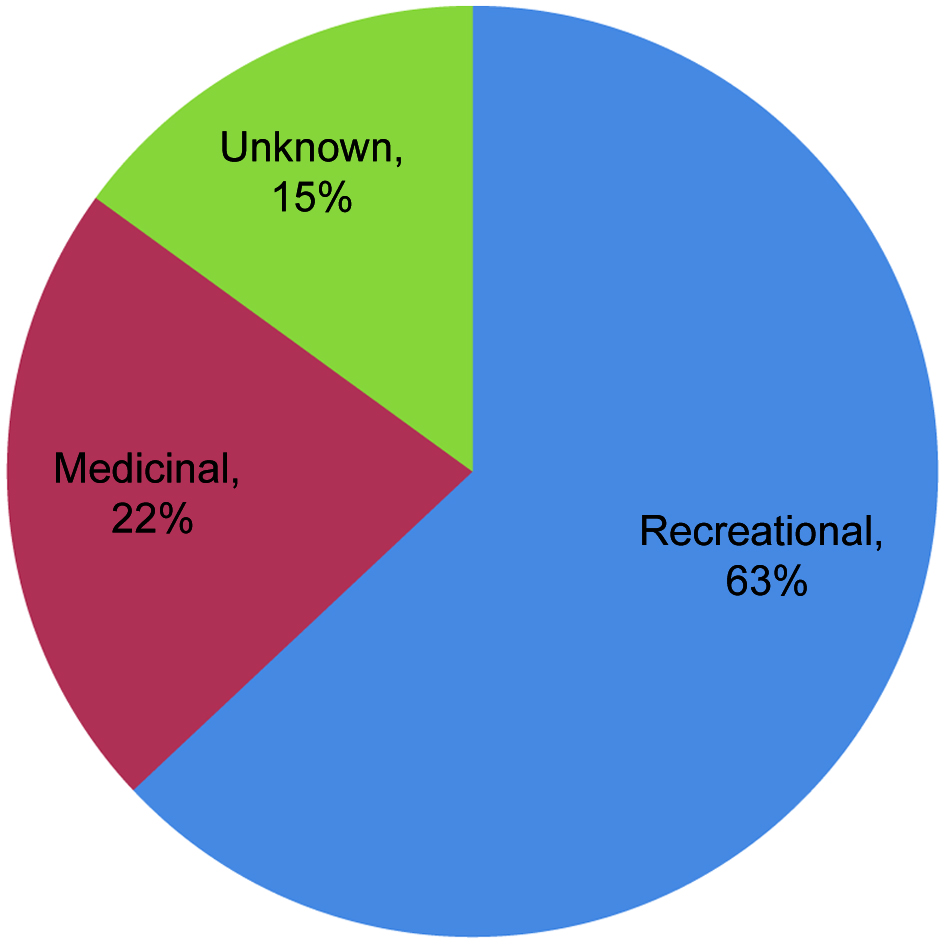
Figure 1. Cannabis use classifications.
| Journal of Clinical Medicine Research, ISSN 1918-3003 print, 1918-3011 online, Open Access |
| Article copyright, the authors; Journal compilation copyright, J Clin Med Res and Elmer Press Inc |
| Journal website https://www.jocmr.org |
Original Article
Volume 15, Number 2, February 2023, pages 99-108
Cannabis Use and Its Association With Thirty- and Ninety-Day Hospital Readmissions for Patients Admitted for an Inflammatory Bowel Disease Exacerbation
Figure
Tables
| CCI: Charlson comorbidity index; IBD: inflammatory bowel disease; LOS: length of stay; SD: standard deviation. | |
| Age (years) | |
| Mean (SD) | 45.28 (20.24) |
| Gender | |
| Female | 542 (53.09) |
| Male | 479 (46.91) |
| Race | |
| African American/Black | 150 (14.69) |
| Asian | 54 (5.29) |
| Other/multiracial | 143 (14.01) |
| White | 674 (66.01) |
| Cannabis use | |
| Yes | 74 (7.25) |
| No | 947 (92.75) |
| Hospital opioid use | |
| Yes | 322 (31.54) |
| No | 699 (68.46) |
| Tobacco use | |
| Current | 100 (9.79) |
| Former | 172 (16.85) |
| Never | 617 (60.43) |
| Unknown | 132 (12.93) |
| Alcohol use | |
| Current | 179 (17.53) |
| Former | 24 (2.35) |
| Never | 408 (39.96) |
| Unknown | 410 (40.16) |
| IBD type | |
| Crohn’s disease | 484 (47.40) |
| Ulcerative colitis | 537 (52.60) |
| CCI | |
| Mean (SD) | 2.17 (2.88) |
| LOS (days) | |
| Mean (SD) | 6.39 (7.11) |
| Cannabis use (n = 74), n (%) | No cannabis use (n = 947), n (%) | Univariable OR (95% CI) | P-value | Multivariable OR (95% CI) | P-value | |
|---|---|---|---|---|---|---|
| CCI: Charlson comorbidity index; CI: confidence interval; IBD: inflammatory bowel disease; OR: odds ratio; SD: standard deviation. | ||||||
| Patient characteristics | ||||||
| Age (years) | ||||||
| Mean (SD) | 36.46 (15.52) | 45.97 (20.41) | 0.97 (0.96 - 0.99) | 0.0001 | 0.96 (0.94 - 0.98) | < 0.0001 |
| Gender | ||||||
| Female | 22 (29.73) | 520 (54.91) | 0.35 (0.21 - 0.58) | < 0.0001 | 0.28 (0.16 - 0.50) | < 0.0001 |
| Male | 52 (70.27) | 427 (45.09) | Reference | Reference | ||
| Race | ||||||
| African American/Black | 21 (28.38) | 129 (13.62) | 2.51 (1.44 - 4.40) | 0.0012 | 2.80 (1.50 - 5.23) | 0.0012 |
| Asian | 3 (4.05) | 51 (5.39) | 0.90 (0.27 - 3.04) | 0.8757 | 1.12 (0.31 - 3.96) | 0.8667 |
| Other/multiracial | 9 (12.16) | 134 (14.15) | 1.04 (0.49 - 2.19) | 0.9240 | 1.11 (0.50 - 2.48) | 0.7978 |
| White | 41 (55.41) | 633 (66.84) | Reference | Reference | ||
| Tobacco use | ||||||
| Current | 17 (22.97) | 83 (8.76) | 3.32 (1.78 - 6.16) | 0.0002 | 2.97 (1.48 - 6.02) | 0.0022 |
| Former | 12 (16.22) | 160 (16.90) | 1.21 (0.61 - 2.38) | 0.5800 | 1.70 (0.78 - 3.71) | 0.1788 |
| Never | 36 (48.65) | 581 (61.35) | Reference | Reference | ||
| Unknown | 9 (12.16) | 123 (12.99) | 1.19 (0.55 - 2.52) | 0.6664 | 1.26 (0.50 - 3.16) | 0.6319 |
| Alcohol use | ||||||
| Current | 17 (22.97) | 162 (17.11) | 1.32 (0.71 - 2.47) | 0.3794 | 1.04 (0.53 - 2.07) | 0.8998 |
| Former | 6 (8.11) | 18 (1.90) | 4.22 (1.55 - 11.38) | 0.0047 | 3.71 (1.20 - 11.36) | 0.0227 |
| Never | 30 (40.54) | 378 (39.92) | Reference | Reference | ||
| Unknown | 21 (28.38) | 389 (41.08) | 0.68 (0.38 - 1.21) | 0.1892 | 0.51 (0.25 - 1.04) | 0.0644 |
| Clinical characteristics | ||||||
| Anxiety | ||||||
| Yes | 14 (18.92) | 91 (9.61) | 2.20 (1.18 - 4.09) | 0.0130 | 2.72 (1.30 - 5.70) | 0.0080 |
| No | 60 (81.08) | 856 (90.39) | Reference | Reference | ||
| Depression | ||||||
| Yes | 12 (16.22) | 53 (5.60) | 3.25 (1.66 - 6.43) | 0.0006 | 3.97 (1.78 - 8.87) | 0.0007 |
| No | 62 (83.78) | 894 (94.40) | Reference | Reference | ||
| IBD type | ||||||
| Crohn’s disease | 42 (56.76) | 442 (46.67) | 1.51 (0.93 - 2.42) | 0.0961 | - | - |
| Ulcerative colitis | 32 (43.24) | 505 (53.33) | Reference | - | - | |
| CCI | ||||||
| Mean (SD) | 1.35 (2.35) | 2.23 (2.90) | 0.87 (0.78 - 0.97) | 0.0124 | - | - |
| Yes (n = 92), n (%) | No (n = 392), n (%) | Univariable OR (95% CI) | P-value | Multivariable OR (95% CI) | P-value | |
|---|---|---|---|---|---|---|
| aOdds ratio was not computed for former alcohol users due to low cell counts. CCI: Charlson comorbidity index; CI: confidence interval; LOS: length of stay; OR: odds ratio; SD: standard deviation. | ||||||
| Main exposures | ||||||
| Cannabis use | ||||||
| Yes | 5 (5.43) | 37 (9.44) | 0.55 (0.21 - 1.45) | 0.2256 | 0.59 (0.22 - 1.62) | 0.3079 |
| No | 87 (94.57) | 355 (90.56) | Reference | Reference | ||
| Hospital opioid use | ||||||
| Yes | 39 (42.39) | 132 (33.67) | 1.45 (0.91 - 2.31) | 0.1166 | 1.45 (0.89 - 2.33) | 0.1343 |
| No | 53 (57.61) | 260 (66.33) | Reference | Reference | ||
| Patient characteristics | ||||||
| Age (years) | ||||||
| Mean (SD) | 44.64 (19.12) | 44.34 (19.15) | 1.00 (0.99 - 1.01) | 0.8924 | - | - |
| Gender | ||||||
| Female | 48 (52.17) | 212 (54.08) | 0.92 (0.59 - 1.46) | 0.7412 | - | - |
| Male | 44 (47.83) | 180 (45.92) | Reference | - | - | |
| Race | ||||||
| African American/Black | 21 (22.83) | 64 (16.33) | 1.68 (0.95 - 3.01) | 0.0731 | 1.99 (1.08 - 3.67) | 0.0261 |
| Asian | 4 (4.35) | 13 (3.32) | 1.58 (0.50 - 5.06) | 0.4360 | 2.12 (0.65 - 6.93) | 0.2116 |
| Other/multiracial | 14 (15.22) | 42 (10.71) | 1.72 (0.87 - 3.37) | 0.1152 | 2.01 (1.00 - 4.04) | 0.0484 |
| White | 53 (57.61) | 273 (69.64) | Reference | |||
| Tobacco use | ||||||
| Current | 12 (13.04) | 47 (11.99) | 1.14 (0.57 - 2.30) | 0.7144 | - | - |
| Former | 17 (18.48) | 53 (13.52) | 1.43 (0.77 - 2.67) | 0.2575 | - | - |
| Never | 54 (58.70) | 241 (61.48) | Reference | - | - | |
| Unknown | 9 (9.78) | 51 (13.01) | 0.79 (0.36 - 1.70) | 0.5421 | - | - |
| Alcohol use | ||||||
| Current | 13 (14.13) | 71 (18.11) | 0.76 (0.38 - 1.53) | 0.4486 | - | - |
| Formera | 0 (0.00) | 6 (1.53) | NA | NA | - | - |
| Never | 38 (41.30) | 159 (40.56) | Reference | - | - | |
| Unknown | 41 (44.57) | 156 (39.80) | 1.11 (0.67 - 1.80) | 0.7059 | - | - |
| Clinical characteristics | ||||||
| Anxiety | ||||||
| Yes | 11 (11.96) | 47 (11.99) | 1.00 (0.49 - 2.01) | 0.9929 | - | - |
| No | 81 (88.04) | 345 (88.01) | Reference | - | - | |
| Depression | ||||||
| Yes | 3 (3.26) | 33 (8.42) | 0.37 (0.11 - 1.23) | 0.1024 | 0.35 (0.10 - 1.22) | 0.0995 |
| No | 89 (96.74) | 359 (91.58) | Reference | |||
| CCI | ||||||
| Mean (SD) | 2.79 (3.59) | 1.86 (2.40) | 1.12 (1.11 - 1.23) | 0.1024 | 1.15 (1.07 - 1.25) | 0.0005 |
| LOS (days) | ||||||
| Mean (SD) | 7.28 (6.33) | 5.62 (7.70) | 1.02 (1.00 - 1.05) | 0.0790 | - | - |
| Yes (n = 92), n (%) | No (n = 445), n (%) | Univariable OR (95% CI) | P-value | Multivariable OR (95% CI) | P-value | |
|---|---|---|---|---|---|---|
| CCI: Charlson comorbidity index; CI: confidence interval; LOS: length of stay; OR: odds ratio; SD: standard deviation. | ||||||
| Main exposures | ||||||
| Cannabis use | ||||||
| Yes | 10 (10.87) | 22 (4.94) | 2.34 (1.07 - 5.14) | 0.0331 | 2.48 (1.06 - 5.79) | 0.0363 |
| No | 82 (89.13) | 423 (95.06) | Reference | Reference | ||
| Hospital opioid use | ||||||
| Yes | 26 (28.26) | 125 (28.09) | 1.01 (0.61 - 1.66) | 0.9735 | 0.79 (0.46 - 1.36) | 0.3958 |
| No | 66 (71.74) | 320 (71.91) | Reference | Reference | ||
| Patient characteristics | ||||||
| Age (years) | ||||||
| Mean (SD) | 48.80 (22.15) | 45.50 (20.97) | 1.01 (1.00 - 1.02) | 0.1740 | - | - |
| Gender | ||||||
| Female | 49 (53.26) | 233 (52.36) | 1.04 (0.66 - 1.63) | 0.8748 | - | - |
| Male | 43 (46.74) | 212 (47.64) | Reference | - | - | |
| Race | ||||||
| African American/Black | 7 (7.61) | 58 (13.03) | 0.47 (0.21 - 1.08) | 0.0740 | 0.39 (0.16 - 0.95) | 0.0369 |
| Asian | 5 (5.43) | 32 (7.19) | 0.61 (0.23 - 1.62) | 0.3212 | 0.57 (0.21 - 1.55) | 0.2698 |
| Other/multiracial | 9 (9.78) | 78 (17.53) | 0.45 (0.21 - 0.94) | 0.0339 | 0.38 (0.18 - 0.84) | 0.0163 |
| White | 71 (77.17) | 277 (62.25) | Reference | Reference | ||
| Tobacco use | ||||||
| Current | 5 (5.43) | 36 (8.09) | 0.77 (0.29 - 2.07) | 0.6094 | - | - |
| Former | 23 (25.00) | 79 (17.75) | 1.62 (0.93 - 2.83) | 0.0877 | - | - |
| Never | 49 (53.26) | 273 (61.35) | Reference | - | - | |
| Unknown | 15 (16.30) | 57 (12.81) | 1.46 (0.77 - 2.80) | 0.2449 | - | - |
| Alcohol use | ||||||
| Current | 12 (13.04) | 83 (18.65) | 0.78 (0.38 - 1.59) | 0.4926 | - | - |
| Former | 6 (6.52) | 12 (2.70) | 2.69 (0.94 - 7.71) | 0.0635 | - | - |
| Never | 33 (35.87) | 178 (40.00) | Reference | - | - | |
| Unknown | 41 (44.57) | 172 (38.65) | 1.28 (0.78 - 2.13) | 0.3283 | - | - |
| Clinical characteristics | ||||||
| Anxiety | ||||||
| Yes | 7 (7.61) | 40 (8.99) | 0.84 (0.36 - 1.93) | 0.6702 | - | - |
| No | 85 (92.39) | 405 (91.01) | Reference | - | - | |
| Depression | ||||||
| Yes | 5 (5.43) | 24 (5.39) | 1.01 (0.37 - 2.72) | 0.9872 | - | - |
| No | 87 (94.57) | 421 (94.61) | Reference | - | - | |
| CCI | ||||||
| Mean (SD) | 2.99 (3.43) | 2.14 (2.93) | 1.08 (1.02 - 1.16) | 0.0154 | - | - |
| LOS (days) | ||||||
| Mean (SD) | 10.03 (9.77) | 6.14 (5.71) | 1.07 (1.04 - 1.10) | < 0.0001 | 1.07 (1.04 - 1.11) | < 0.0001 |
| Yes (n = 271), n (%) | No (n = 750), n (%) | Univariable OR (95% CI) | P-value | Multivariable OR (95% CI) | P-value | |
|---|---|---|---|---|---|---|
| CCI: Charlson comorbidity index; CI: confidence interval; IBD: inflammatory bowel disease; LOS: length of stay; OR: odds ratio; SD: standard deviation. | ||||||
| Main exposures | ||||||
| Cannabis use | ||||||
| Yes | 21 (7.75) | 53 (7.07) | 1.11 (0.65 - 1.87) | 0.7105 | 1.19 (0.68 - 2.05) | 0.5537 |
| No | 250 (92.25) | 697 (92.93) | Reference | Reference | ||
| Hospital opioid use | ||||||
| Yes | 92 (33.95) | 230 (30.67) | 1.16 (0.86 - 1.56) | 0.3192 | 1.01 (0.74 - 1.37) | 0.9742 |
| No | 179 (66.05) | 520 (69.33) | Reference | Reference | ||
| Patient characteristics | ||||||
| Age (years) | ||||||
| Mean (SD) | 46.79 (20.43) | 44.73 (20.16) | 1.01 (1.00 - 1.01) | 0.1502 | 0.99 (0.98 - 1.00) | 0.0127 |
| Gender | ||||||
| Female | 118 (43.54) | 361 (48.13) | 1.21 (0.91 - 1.59) | 0.1946 | 1.27 (0.95 - 1.70) | 0.1024 |
| Male | 153 (56.46) | 389 (51.87) | Reference | - | - | |
| Race | ||||||
| African American/Black | 43 (15.87) | 107 (14.27) | 1.07 (0.72 - 1.58) | 0.7347 | - | - |
| Asian | 12 (4.43) | 42 (5.60) | 0.76 (0.39 - 1.48) | 0.4195 | - | - |
| Other/multiracial | 32 (11.81) | 111 (14.80) | 0.77 (0.50 - 1.18) | 0.2263 | - | - |
| White | 184 (67.90) | 490 (65.33) | Reference | - | - | |
| Tobacco use | ||||||
| Current | 32 (11.81) | 68 (9.07) | 1.42 (0.89 - 2.24) | 0.1376 | - | - |
| Former | 54 (19.93) | 118 (15.73) | 1.38 (0.95 - 1.99) | 0.0910 | - | - |
| Never | 154 (56.83) | 463 (61.73) | Reference | - | - | |
| Unknown | 31 (11.44) | 101 (13.47) | 0.92 (0.59 - 1.44) | 0.7215 | - | - |
| Alcohol use | ||||||
| Current | 38 (14.02) | 141 (18.80) | 0.70 (0.46 - 1.07) | 0.0998 | - | - |
| Former | 7 (2.58) | 17 (2.27) | 1.07 (0.43 - 2.66) | 0.8758 | - | - |
| Never | 113 (41.70) | 295 (39.33) | Reference | - | - | |
| Unknown | 113 (41.70) | 297 (39.60) | 0.99 (0.73 - 1.35) | 0.9655 | - | - |
| Clinical characteristics | ||||||
| Anxiety | ||||||
| Yes | 30 (11.07) | 75 (10.00) | 1.12 (0.72 - 1.75) | 0.6193 | - | - |
| No | 241 (88.93) | 675 (90.00) | Reference | - | - | |
| Depression | ||||||
| Yes | 17 (6.27) | 48 (6.40) | 0.98 (0.55 - 1.73) | 0.9415 | - | - |
| No | 254 (93.73) | 702 (93.60) | Reference | - | - | |
| IBD type | ||||||
| Crohn’s disease | 141 (52.03) | 343 (45.73) | 1.28 (0.97 - 1.70) | 0.0755 | 1.36 (1.02 - 1.81) | 0.0363 |
| Ulcerative colitis | 130 (47.97) | 407 (54.27) | Reference | Reference | ||
| CCI | ||||||
| Mean (SD) | 2.80 (3.32) | 1.94 (2.66) | 1.11 (1.05 - 1.15) | < 0.0001 | 1.16 (1.08 - 1.25) | < 0.0001 |
| LOS (days) | ||||||
| Mean (SD) | 8.10 (7.62) | 5.77 (6.82) | 1.04 (1.02 - 1.07) | < 0.0001 | 1.04 (1.02 - 1.06) | 0.0002 |