Journal of Clinical Medicine Research, ISSN 1918-3003 print, 1918-3011 online, Open Access
Article copyright, the authors; Journal compilation copyright, J Clin Med Res and Elmer Press Inc
Journal website https://www.jocmr.org

Original Article

Volume 15, Number 2, February 2023, pages 90-98


Increased Serum Sodium at Acute Kidney Injury Onset Predicts In-Hospital Death

Figures

Figure 1.
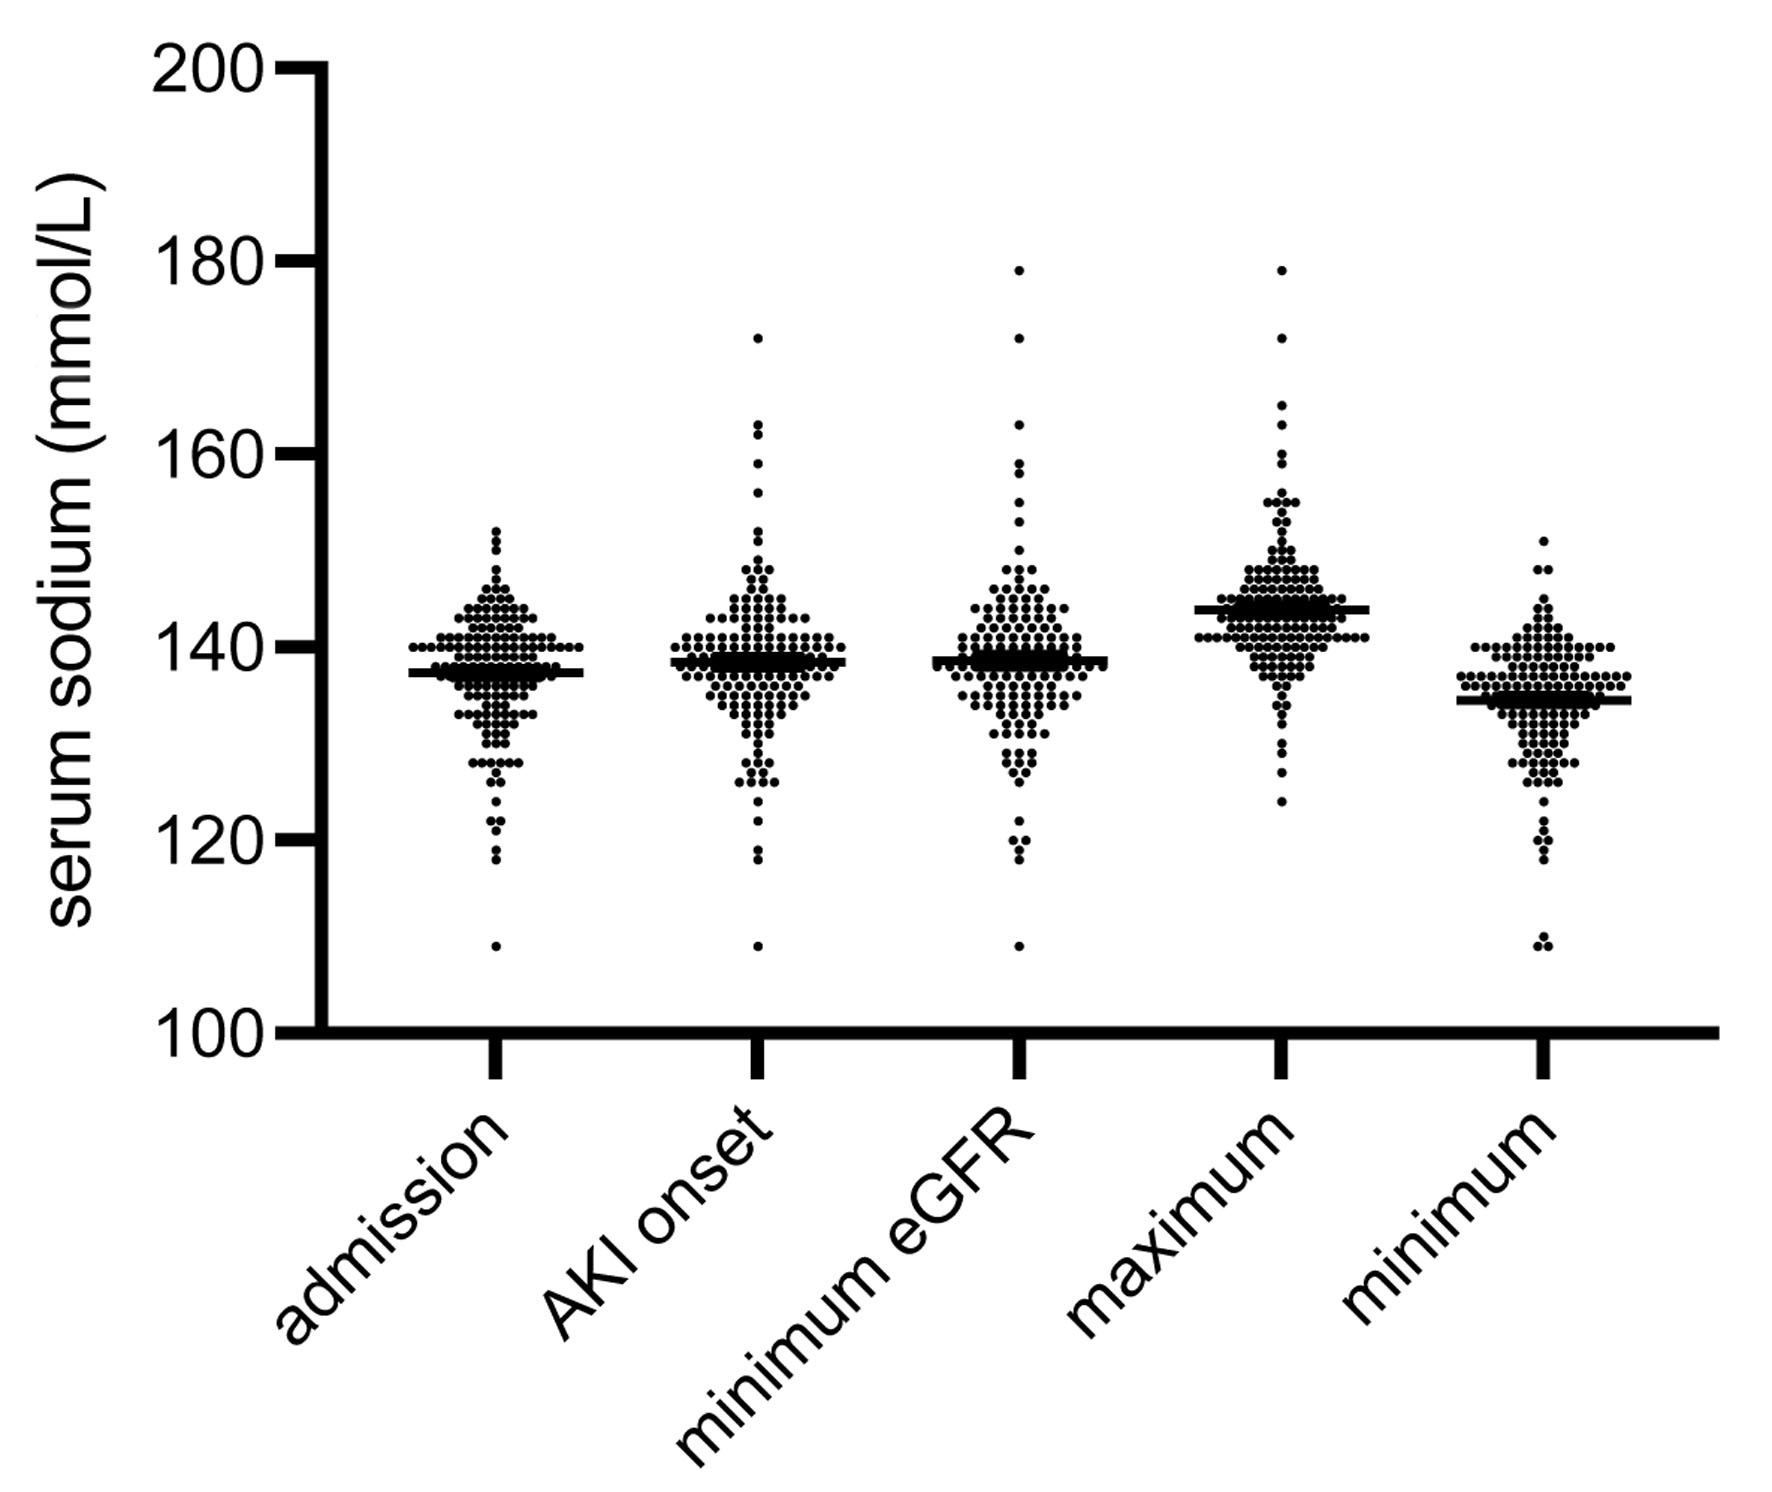
Figure 1. Distribution of serum sodium at five pre-defined time points: admission to the hospital, diagnosis of AKI (AKI onset), minimum eGFR, maximum and minimum of serum sodium, respectively. The medians were not equal (P < 0.001). The numbers of all outliers per group were: admission 1, AKI onset 6, minimum eGFR 6, maximum 5, minimum 3 (data are shown as median ± IQR). AKI: acute kidney injury; eGFR: estimated glomerular filtration rate; IQR: interquartile range.
Figure 2.
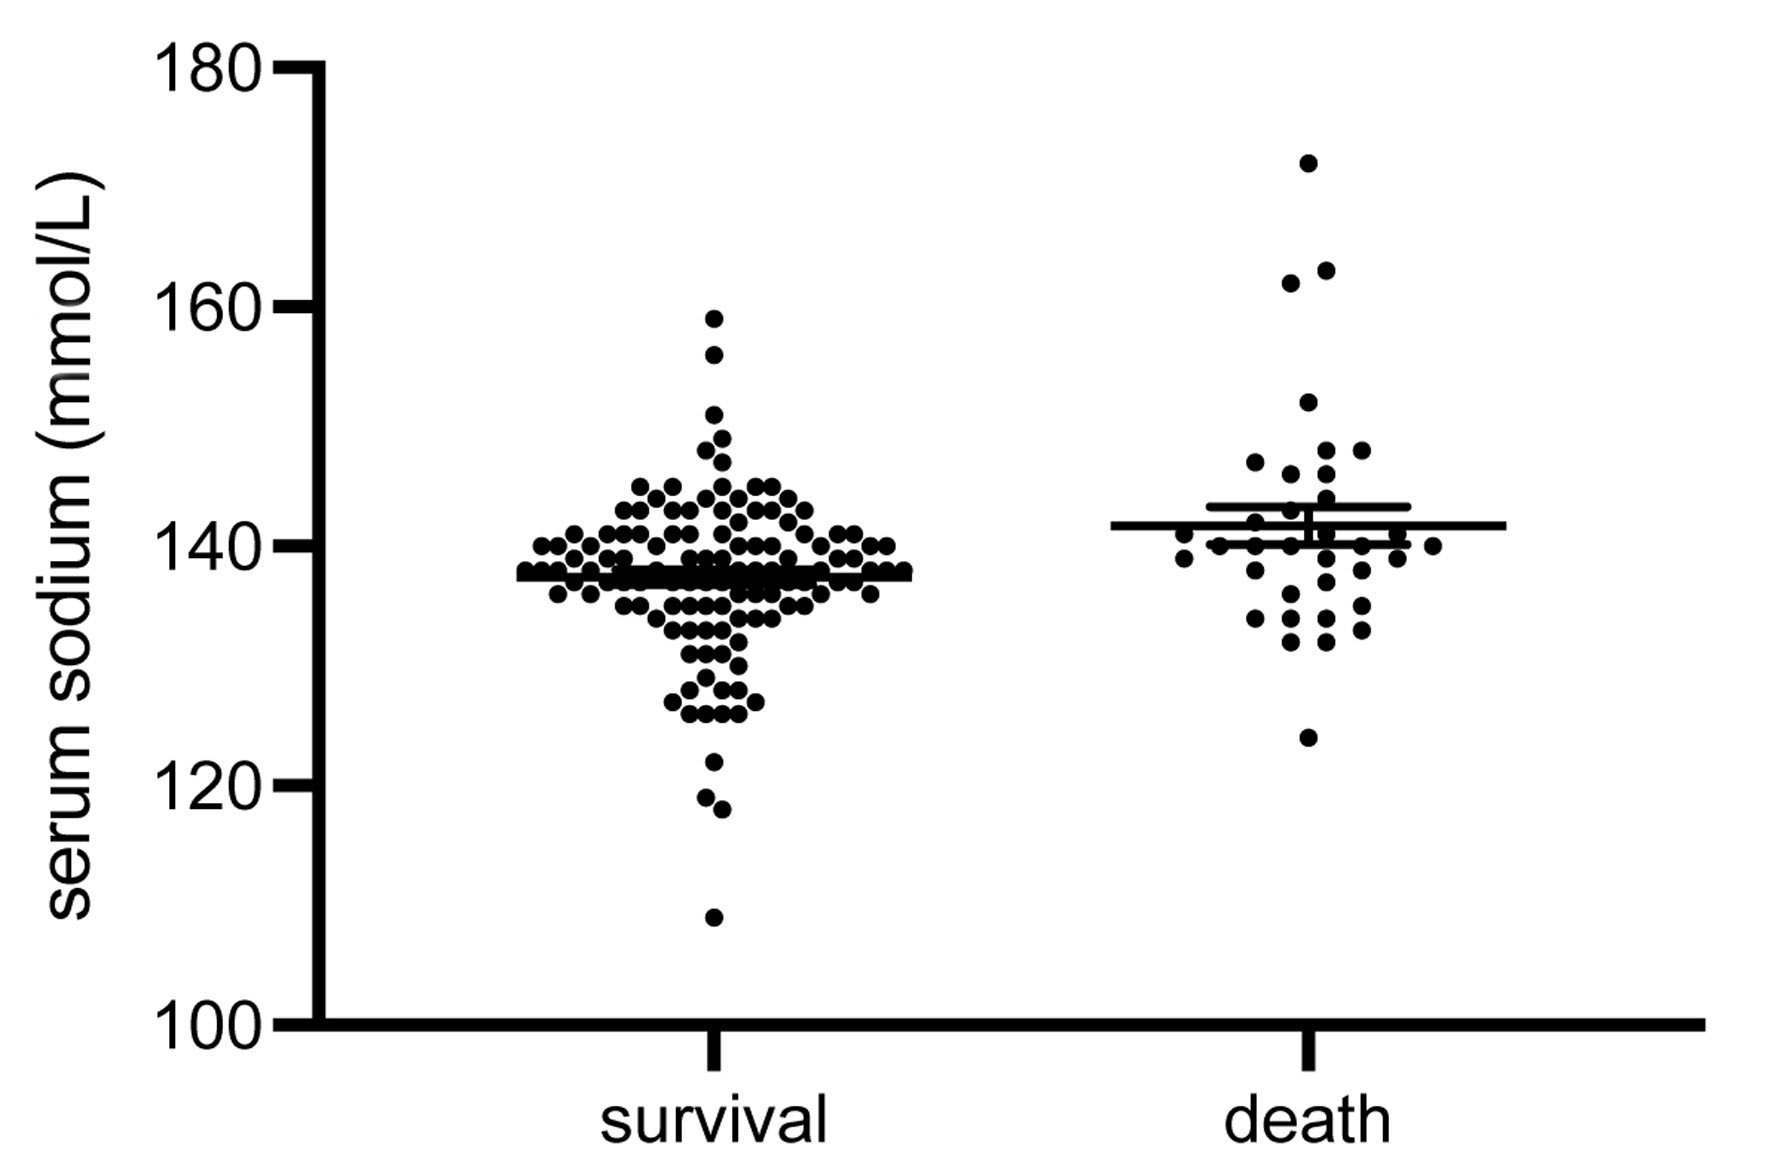
Figure 2. Serum sodium at AKI diagnosis. Subjects that did not survive the in-hospital treatment period showed significantly higher serum sodium levels at AKI onset (P = 0.003). The numbers of all outliers per group were: survival 4, death 1 (data are shown as median ± IQR). AKI: acute kidney injury; IQR: interquartile range.
Figure 3.
Figure 3. ROC curve for serum sodium at AKI diagnosis. AUC > 0.5 as the ROC lies above the diagonal line. ROC: receiver operating characteristic; AKI: acute kidney injury; AUC: area under the curve.
Figure 4.
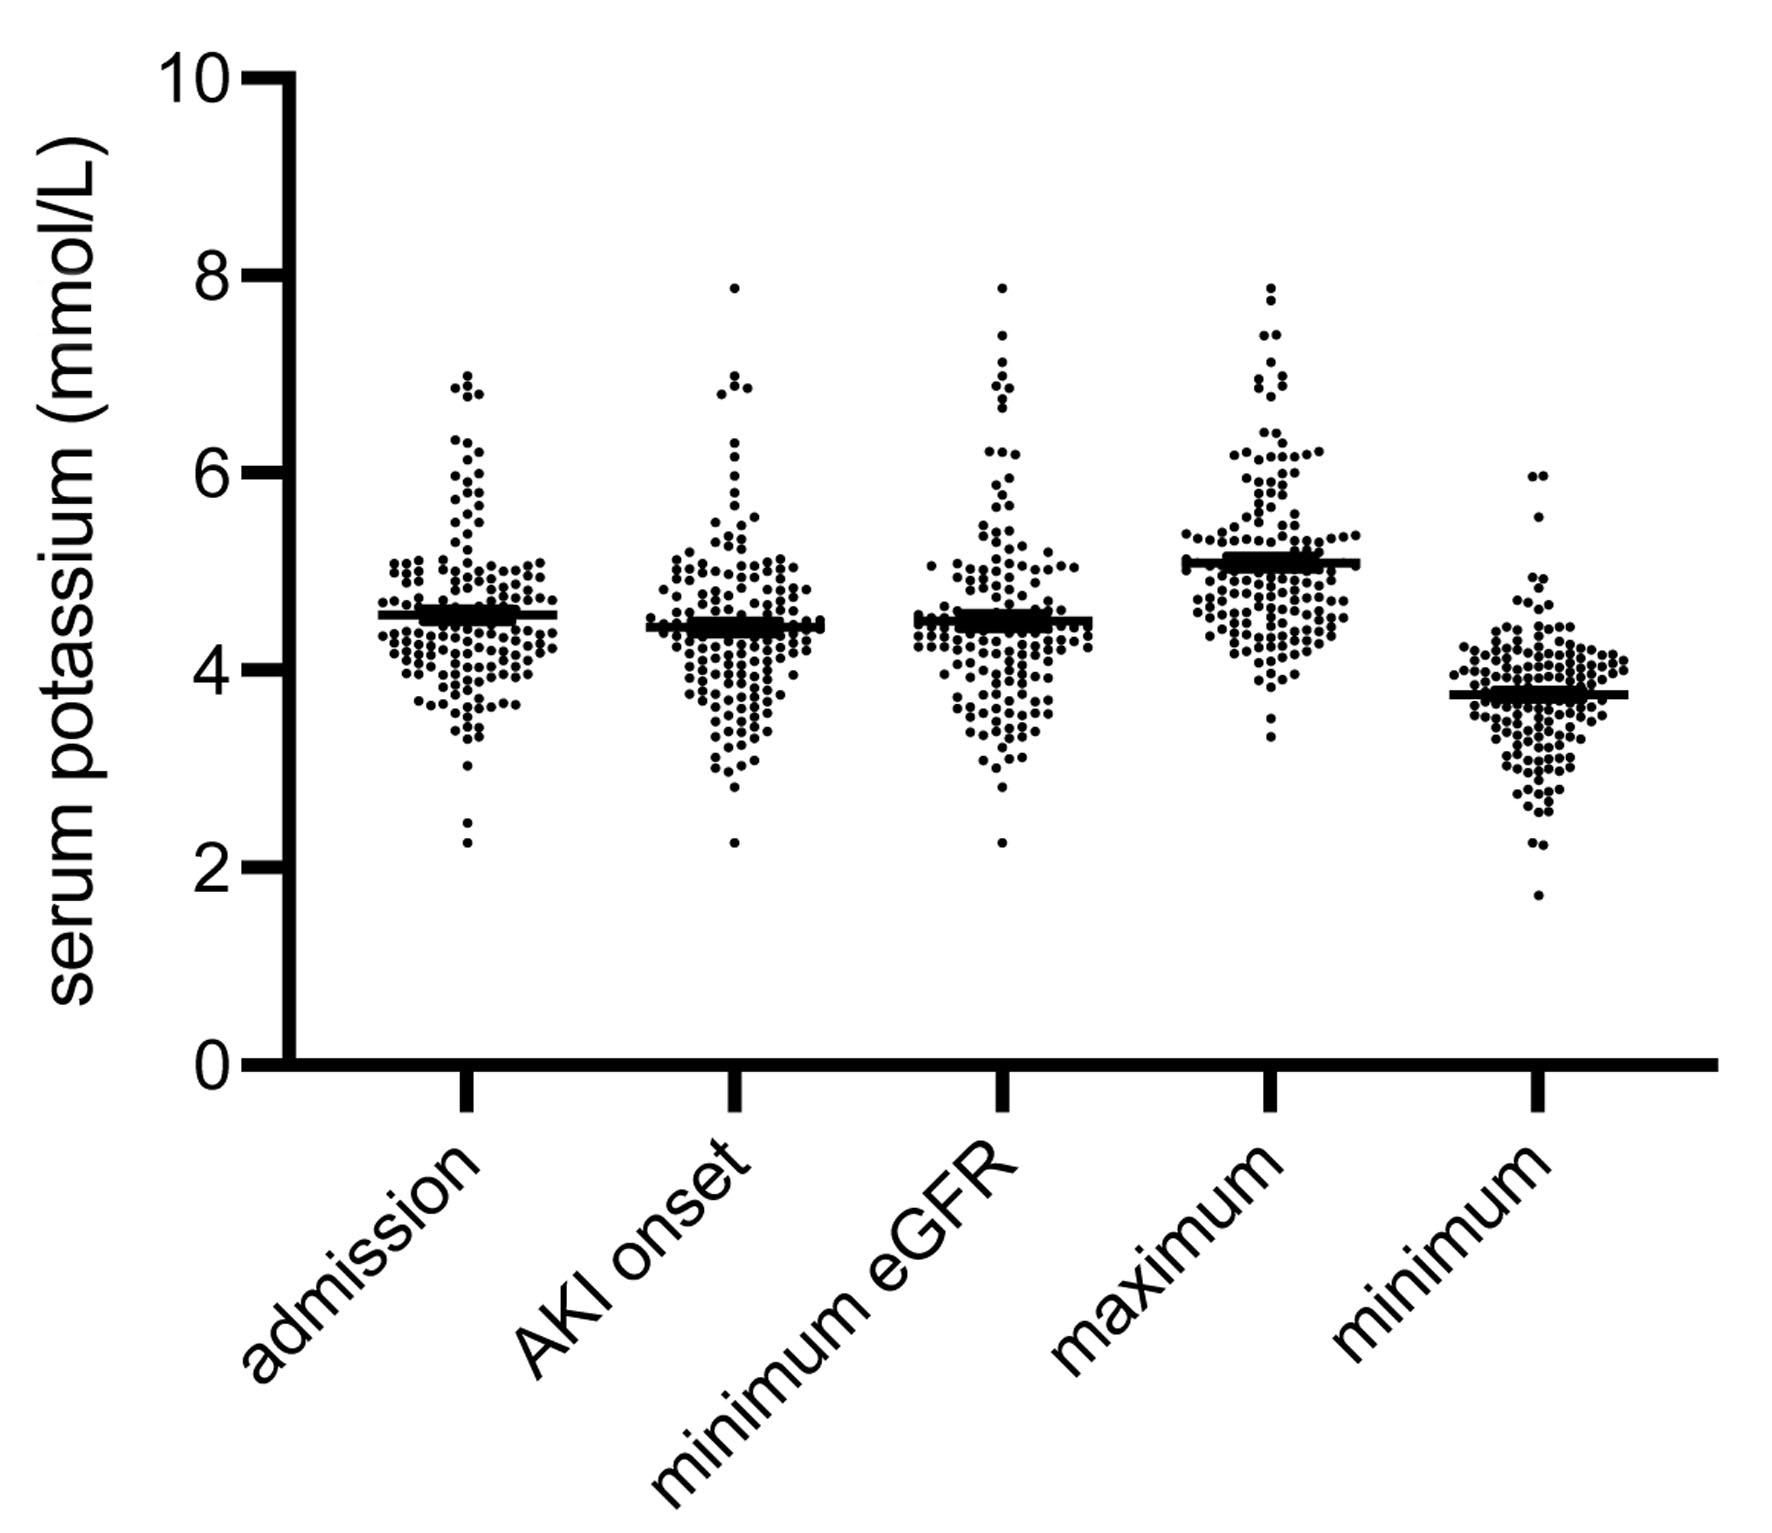
Figure 4. Distribution of serum potassium at the five time points (Fig. 2). Comparable to serum sodium, the respective medians were not equal (P < 0.001). The numbers of all outliers per group were: admission 5, AKI onset 1, minimum eGFR 2, maximum 2, minimum 3 (data are shown as median ± IQR). AKI: acute kidney injury; eGFR: estimated glomerular filtration rate; IQR: interquartile range.

Tables

Table 1. Baseline Characteristics of All Patients Included in the Study
 
VariableResult
SEM: standard error of the mean; AKI: acute kidney injury; CKD: chronic kidney disease; COPD: chronic obstructive pulmonary disease.
Age (years) (± SEM)77.2 ± 0.98
Gender (female/male)57/103
In-hospital treatment (days) (± SEM)16 ± 1.05
AKI etiology (%)
  Sepsis31.2
  Volume depletion8.8
  Cardiorenal26.2
  Contrast-induced3.8
  Hepatorenal5.6
  Drug-induced3.1
  Post-surgery10.6
  Obstruction1.2
  Other9.4
AKI stage (n (%))
  I84 (52.5%)
  II34 (21.2%)
  III42 (26.2%)
Morbidities
  Pre-existing CKD (%)49.7
  Arterial hypertension (%)81.3
  Diabetes mellitus (%)39
  Coronary artery disease (%)35.2
  Pre-existing heart failure (%)32.7
  COPD (%)15.8
  History of neoplasia (%)29.4
Dialysis initiated (n (%))17 (10.6%)
In-hospital death (n (%))37 (23.1%)
Recovery of kidney function (n (%))66 (60%)


Table 2. Analysis of Confounding Factors Regarding the Endpoints In-Hospital Death, KRT and Recovery of Kidney Function
 
Counfounding variableSurvival (P-value)KRT (P-value)Recovery of kidney function (P-value)
KRT: kidney replacement therapy; AKI: acute kidney injury; CKD: chronic kidney disease; COPD: chronic obstructive pulmonary disease.
Gender (females vs. males)0.10.270.75
Age (years)0.440.840.02
AKI stage (I, II, III)< 0.001< 0.0010.97
In-hospital treatment (days)0.19< 0.001< 0.001
Pre-existing CKD (%)0.810.0190.48
Arterial hypertension (%)0.550.0630.04
Diabetes mellitus (%)0.440.740.87
Coronary artery disease (%)0.180.10.12
Pre-existing heart failure (%)0.080.180.28
COPD (%)0.490.350.76
History of neoplasia (%)0.640.260.09