Journal of Clinical Medicine Research, ISSN 1918-3003 print, 1918-3011 online, Open Access
Article copyright, the authors; Journal compilation copyright, J Clin Med Res and Elmer Press Inc
Journal website https://www.jocmr.org

Original Article

Volume 14, Number 11, November 2022, pages 466-473


Effect of Omega-3 Polyunsaturated Fatty Acids Intake on Eosinophil Airway Inflammation in University Athletes

Figure

Figure 1.
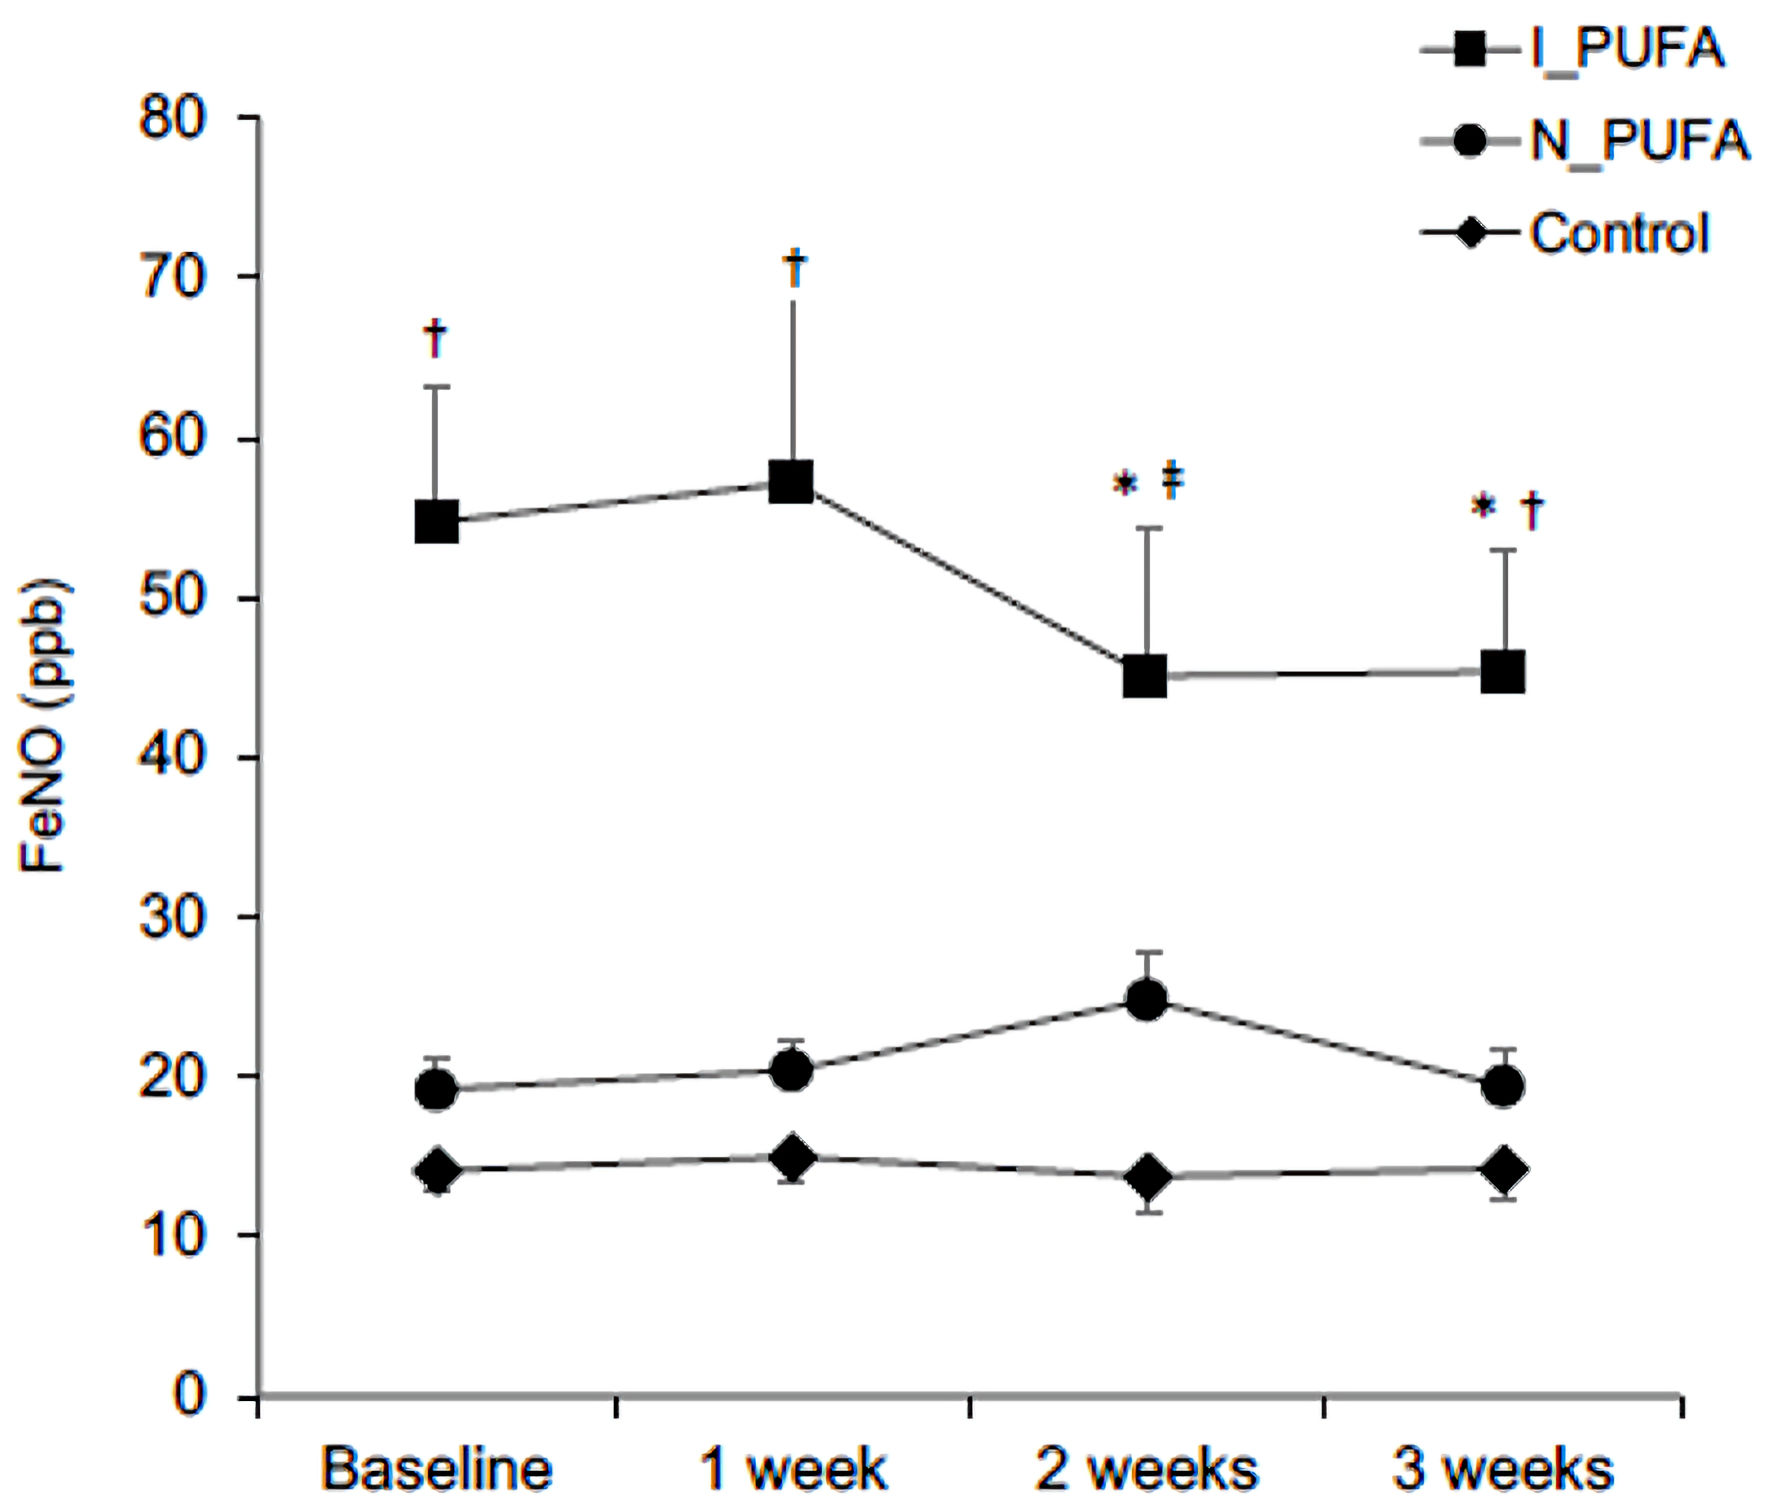
Figure 1. Comparison of FeNO levels at baseline and after 1, 2, and 3 weeks of PUFA supplementation between the three groups. Error bars represent standard deviations. *P < 0.05 vs. baseline and 1 week. P<0.05 vs. N_PUFA and control. P < 0.05 vs. control. PUFA: polyunsaturated fatty acids; I: airway inflammation; N: non-airway inflammation; I_PUFA: intake of PUFA and FeNO ≥ 25 ppb; N_PUFA: intake of PUFA and FENO < 25 ppb and eCO ≥ 3.6 ppm; FeNO: fractional exhaled nitric oxide.

Tables

Table 1. Respiratory Function at Baseline and After 3 Weeks
 
I_PUFA (n = 10)N_PUFA (n = 5)Control (n = 8)
Baseline3 weeksBaseline3 weeksBaseline3 weeks
Data are presented as mean ± SD. PUFA: polyunsaturated fatty acid; I_PUFA: intake of PUFA and FeNO ≥ 25 ppb; N_PUFA: intake of PUFA and FENO < 25 ppb and eCO ≥ 3.6 ppm; FeNO: fractional exhaled nitric oxide; eCO: exhaled carbon dioxide; FVC: forced vital capacity; FEV1: forced expiratory volume in the first second; PEF: peak expiratory flow; SD: standard deviation.
Age (years)21.0 ± 1.420.0 ± 2.120.0 ± 1.7
Weight (kg)82.5 ± 15.279.9 ± 13.874.4 ± 13.0
FVC (L)4.4 ± 0.74.6 ± 0.64.4 ± 0.84.7 ± 0.74.0 ± 0.74.6 ± 0.4
FVC (% predicted)98.7 ± 16.0104.5 ± 11.2101.1 ± 15.4106.7 ± 13.192.7 ± 16.5105.7 ± 8.9
FEV1 (L)3.9 ± 0.84.0 ± 0.73.9 ± 0.64.1 ± 0.53.4 ± 0.63.9 ± 0.4
FEV1 (% predicted)89.8 ± 17.293.9 ± 14.690.8 ± 11.395.1 ± 8.281.1 ± 14.192.3 ± 6.9
FEV1/FVC (%)89.0 ± 8.686.1 ± 7.588.0 ± 6.087.5 ± 5.885.1 ± 6.384.7 ± 2.6
PEF (L/s)9.4 ± 2.19.9 ± 1.68.5 ± 2.19.0 ± 1.67.2 ± 2.08.6 ± 1.0


Table 2. Changes in eCO and Blood Eosinophils Levels Over 3 Weeks
 
Baseline1 week2 weeks3 weeks
Data are presented as mean ± SD. aP < 0.05: compared to baseline. bP < 0.05 compared to I_PUFA and PUFA. PUFA: polyunsaturated fatty acid; I_PUFA: intake of PUFA and FeNO ≥ 25 ppb; N_PUFA: intake of PUFA and FENO < 25 ppb and eCO ≥ 3.6 ppm; eCO: exhaled carbon monoxide; SD: standard deviation.
CO (ppm)
  I_PUFA3.7 ± 0.73.5 ± 1.42.8 ± 0.5a2.4 ± 0.5a
  N_PUFA4.7 ± 0.93.7 ± 0.92.9 ± 0.4a2.4 ± 0.6a
  Control2.9 ± 0.4b2.7 ± 0.52.3 ± 0.32.5 ± 0.6
Eosinophilic (%)
  I_PUFA5.7 ± 1.75.9 ± 1.94.8 ± 1.05.4 ± 2.0
  N_PUFA2.9 ± 1.52.8 ± 1.12.7 ± 1.83.1 ± 1.3
  Control1.8 ± 0.52.2 ± 0.52.3 ± 1.02.0 ± 0.6


Table 3. Changes in Respiratory Impedance Markers Over 3 Weeks
 
I_PUFA group (n = 10)Control group (n = 8)
Baseline1 week2 weeks3 weeksBaseline1 week2 weeks3 weeks
Data are presented as mean ± SD. PUFA: polyunsaturated fatty acid; I_PUFA: intake of PUFA and FeNO ≥ 25 ppb; R5: 5 Hz; R20: 20 Hz; X5: reactance at 5 Hz; Fres: resonant frequency; SD: standard deviation.
R5 (cm H2O/L/s)2.29 ± 1.12.26 ± 1.01.92 ± 0.71.75 ± 0.62.13 ± 0.62.25 ± 0.71.92 ± 0.41.84 ± 0.3
R20 (cm H2O/L/s)2.14 ± 0.82.03 ± 0.62.03 ± 0.61.84 ± 0.32.14 ± 0.62.00 ± 0.22.00 ± 0.21.83 ± 0.2
R5 - R20 (cm H2O/L/s)0.12 ± 0.5-0.10 ± 0.5-0.10 ± 0.5-0.09 ± 0.50.11 ± 0.5-0.08 ± 0.3-0.08 ± 0.30.01 ± 0.3
X5 (cm H2O/L/s)-0.14 ± 0.4-0.21 ± 0.2-0.28 ± 0.3-0.08 ± 0.3-0.10 ± 0.1-0.25 ± 0.3-0.11 ± 0.1-0.19 ± 0.2
Fres (Hz)6.47 ± 3.05.99 ± 1.57.85 ± 3.27.50 ± 4.95.84 ± 1.17.39 ± 3.86.10 ± 1.27.21 ± 2.0


Table 4. Dietary Intake as Assessed by the Food Frequency Questionnaire at Baseline and 3 Weeks
 
I_PUFA group (n = 10)N_PUFA group (n = 5)Control group (n = 8)
Baseline3 weeksBaseline3 weeksBaseline3 weeks
Data are presented as mean ± SD. PUFA: polyunsaturated fatty acid; I_PUFA: intake of PUFA and FeNO ≥ 25 ppb; N_PUFA: intake of PUFA and FENO < 25 ppb and eCO ≥ 3.6 ppm; eCO: exhaled carbon monoxide; SD: standard deviation.
Energy (kcal)2,517 ± 332.52,305 ± 344.52,607.2 ± 316.82,312.0 ± 152.22,408.3 ± 162.02,290.4 ± 133.0
Lipid (g)68.0 ± 6.466.7 ± 8.069.8 ± 5.264.8 ± 2.266.05 ± 2.165.1 ± 2.4
Protein (g)92.31 ± 7.488.56 ± 7.795.3 ± 7.389.2 ± 4.490.3 ± 3.188.2 ± 2.9
Carbohydrate (g)376.8 ± 65.0312.7 ± 61.5388.3 ± 63.3330.8 ± 36.2355.0 ± 49.5322.4 ± 34.2


Table 5. Changes in Blood n-3 PUFA Over 3 Weeks
 
I_PUFA group (n = 10)N_PUFA group (n = 5)Control group (n = 8)
Baseline3 weeksBaseline3 weeksBaseline3 weeks
Data are presented as mean ± SD. *P < 0.05, compared to baseline. n-3: omega-3; PUFA: polyunsaturated fatty acid; I_PUFA: intake of PUFA and FeNO ≥ 25 ppb; N_PUFA: intake of PUFA and FENO < 25 ppb and eCO ≥ 3.6 ppm; SD: standard deviation EPA: eicosatetraenoic acid; DHA: docosahexaenoic acid; AA: arachidonic acid.
EPA (μg/mL)27.7 ± 16.952.1 ± 12.3*20.8 ± 8.770.4 ± 36.1*31.6 ± 19.726.9 ± 17.7
DHA (µg/mL)73.8 ± 23.976.6 ± 17.370.8 ± 24.186.8 ± 27.580.5 ± 28.579.0 ± 16.7
AA (µg/mL)198.4 ± 46.9183.5 ± 28.9212.1 ± 34.3198.0 ± 36.7208.7 ± 33.8221.2 ± 36.8
EPA/AA0.14 ± 0.10.29 ± 0.1*0.10 ± 0.00.36 ± 0.2*0.15 ± 0.10.12 ± 0.1