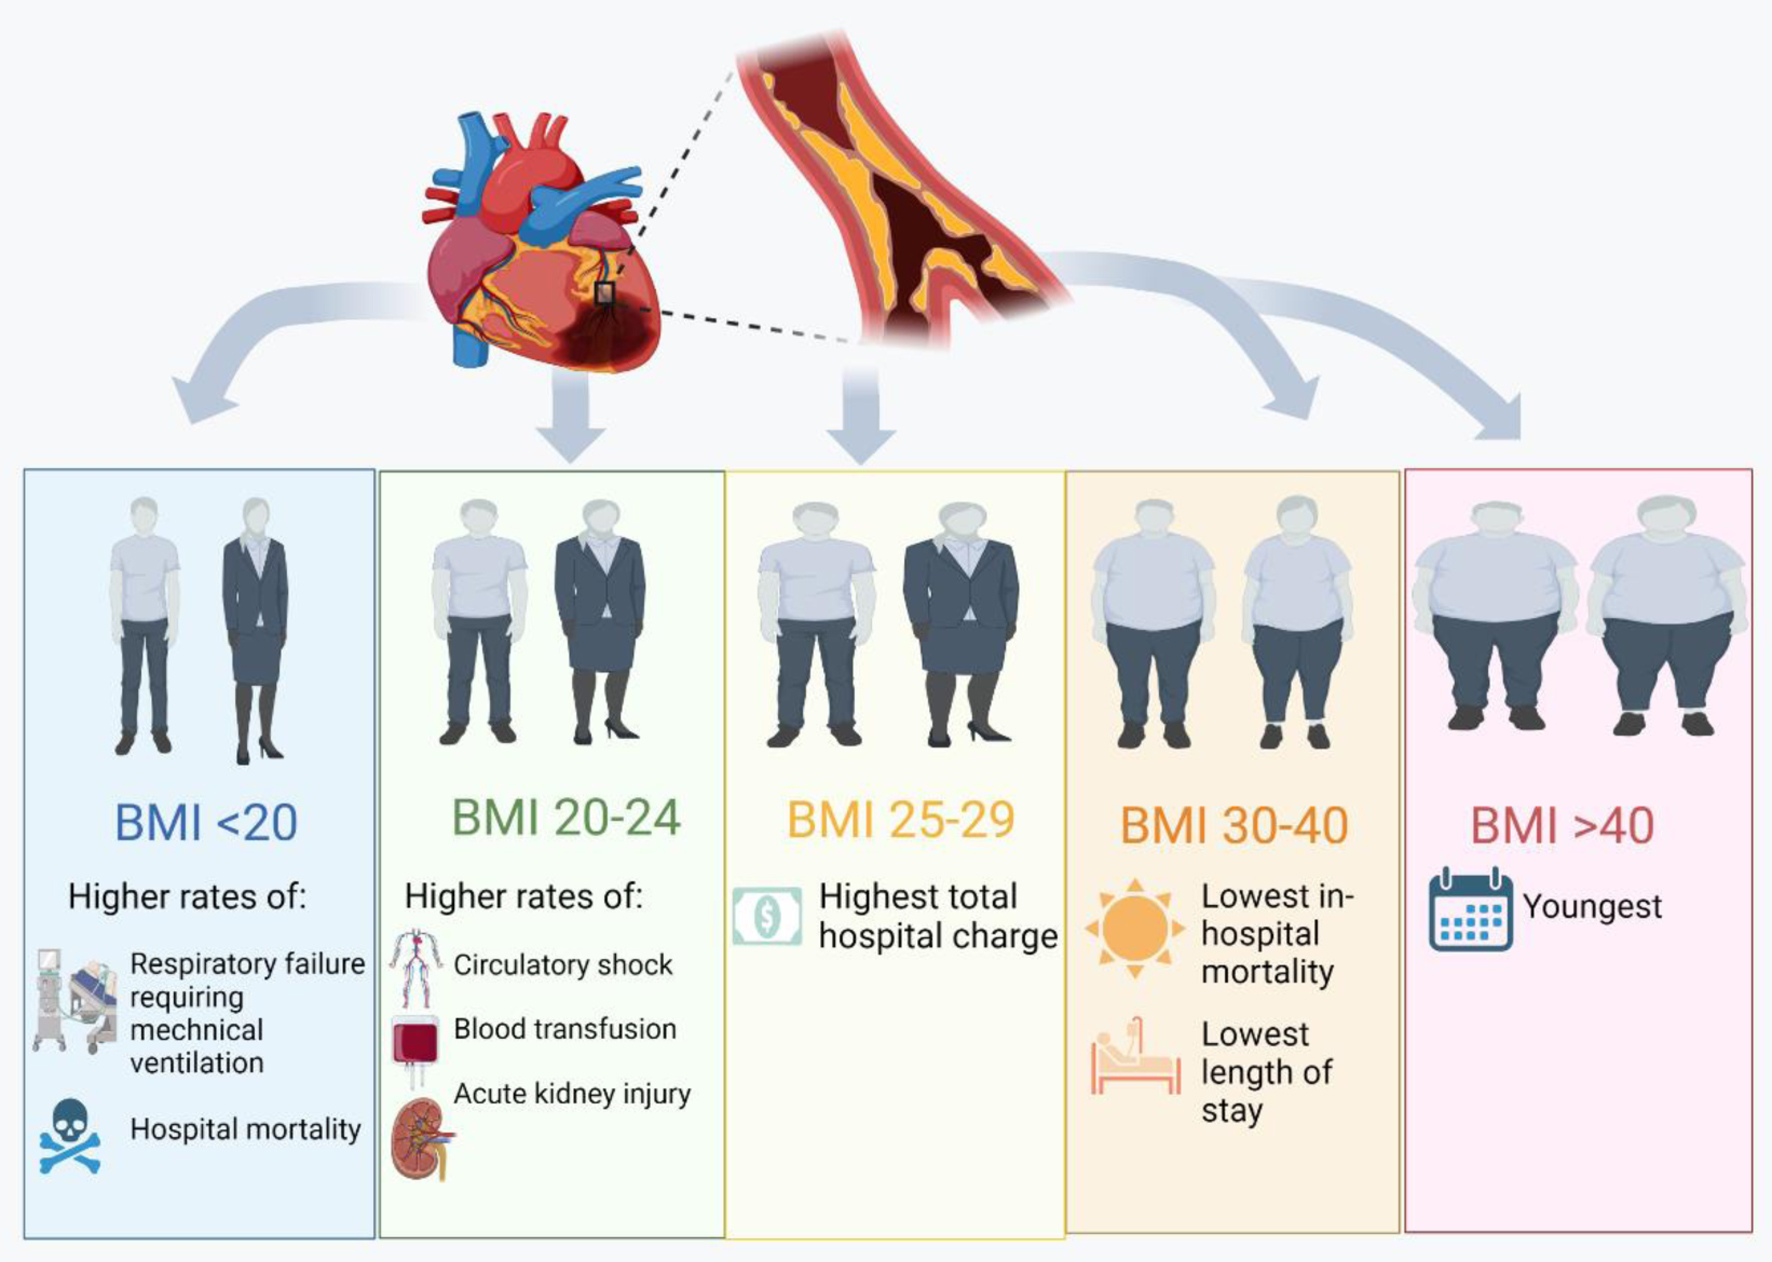
Figure 1. Differences in patient characteristics, resource utilization and in-hospital outcomes among those admitted for acute myocardial infarction based on body mass index [12].
| Journal of Clinical Medicine Research, ISSN 1918-3003 print, 1918-3011 online, Open Access |
| Article copyright, the authors; Journal compilation copyright, J Clin Med Res and Elmer Press Inc |
| Journal website https://www.jocmr.org |
Original Article
Volume 14, Number 11, November 2022, pages 458-465
Relationship Between Body Mass Index and Outcomes in Acute Myocardial Infarction
Figure
Tables
| Characteristics | Overall (n = 561,520a) | Body mass index | P-valueb | ||||
|---|---|---|---|---|---|---|---|
| < 20 (n = 34,705a) | 20 - 24 (n = 20,475a) | 25 - 29 (n = 51,690a) | 30 - 39 (n = 294,365a) | > 40 (n = 160,285a) | |||
| aMean (SD); n (%). b Wilcoxon rank-sum test for complex survey samples; Chi-squared test with Rao and Scott’s second-order correction. SD: standard deviation. | |||||||
| Age | 63 (SD 13) | 75 (SD 12) | 74 (SD 12) | 67 (SD 13) | 63(SD 12) | 60 (SD 12) | < 0.001 |
| Gender | 233,115 (42%) | 20,365 (59%) | 9,240 (45%) | 18,495 (36%) | 105,770 (36%) | 79,245 (49%) | < 0.001 |
| Race | < 0.001 | ||||||
| White | 397,085 (73%) | 24,660 (73%) | 13,630 (69%) | 34,805 (69%) | 211,250 (74%) | 112,740 (73%) | |
| Black | 71,005 (13%) | 4,760 (14%) | 2,640 (13%) | 5,680 (11%) | 32,815 (12%) | 25,110 (16%) | |
| Hispanic | 47,795 (8.8%) | 2,035 (6.0%) | 2,080 (10%) | 6,110 (12%) | 26,475 (9.3%) | 11,095 (7.2%) | |
| Asian or Pacific Islander | 9,530 (1.8%) | 1,385 (4.1%) | 840 (4.2%) | 1,515 (3.0%) | 4,425 (1.6%) | 1,365 (0.9%) | |
| Native American | 3,595 (0.7%) | 235 (0.7%) | 90 (0.5%) | 290 (0.6%) | 1,885 (0.7%) | 1,095 (0.7%) | |
| Other | 14,020 (2.6%) | 810 (2.4%) | 615 (3.1%) | 1,760 (3.5%) | 7,340 (2.6%) | 3,495 (2.3%) | |
| Insurance | < 0.001 | ||||||
| Medicare | 284,825 (51%) | 27,710 (80%) | 1 5,235 (74%) | 28,950 (56%) | 137,940 (47%) | 74,990 (47%) | |
| Medicaid | 62,325 (11%) | 2,635 (7.6%) | 1,795 (8.8%) | 5,125 (9.9%) | 30,550 (10%) | 22,220 (14%) | |
| Private insurance | 167,735 (30%) | 3,055 (8.8%) | 2,355 (12%) | 13,505 (26%) | 99,550 (34%) | 49,270 (31%) | |
| Self-pay | 27,230 (4.9%) | 585 (1.7%) | 570 (2.8%) | 2,390 (4.6%) | 15,255 (5.2%) | 8,430 (5.3%) | |
| No charge | 2,630 (0.5%) | 60 (0.2%) | 60 (0.3%) | 275 (0.5%) | 1,540 (0.5%) | 695 (0.4%) | |
| Other | 16,010 (2.9%) | 620 (1.8%) | 450 (2.2%) | 1,365 (2.6%) | 9,135 (3.1%) | 4,440 (2.8%) | |
| Hospital bed size | < 0.001 | ||||||
| Small | 99,380 (18%) | 6,695 (19%) | 3,865 (19%) | 8,660 (17%) | 50,820 (17%) | 29,340 (18%) | |
| Medium | 166,950 (30%) | 10,470 (30%) | 6,165 (30%) | 15,500 (30%) | 87,910 (30%) | 46,905 (29%) | |
| Large | 295,190 (53%) | 17,540 (51%) | 10,445 (51%) | 27,530 (53%) | 155,635 (53%) | 84,040 (52%) | |
| Total charges | 105,172 (121,538) | 89,245 (117,306) | 110,480 (147,366) | 116,281 (132,570) | 105,114 (110,906) | 104,445 (132,798) | < 0.001 |
| Hospital region | < 0.001 | ||||||
| Northeast | 89,830 (16%) | 6,510 (19%) | 3,390 (17%) | 7,785 (15%) | 45,955 (16%) | 26,190 (16%) | |
| Midwest | 146,100 (26%) | 8,380 (24%) | 5,130 (25%) | 11,270 (22%) | 77,825 (26%) | 43,495 (27%) | |
| South | 224,075 (40%) | 13,300 (38%) | 7,765 (38%) | 21,635 (42%) | 115,915 (39%) | 65,460 (41%) | |
| West | 101,515 (18%) | 6,515 (19%) | 4,190 (20%) | 11,000 (21%) | 54, 670 (19%) | 25,140 (16%) | |
| Median household income | < 0.001 | ||||||
| 0-25th | 173,455 (31%) | 11,685 (34%) | 6,520 (32%) | 15,495 (31%) | 86,490 (30%) | 53,265 (34%) | |
| 26th-50th | 154,445 (28%) | 9,010 (27%) | 5,445 (27%) | 13,520 (27%) | 80,715 (28%) | 45,755 (29%) | |
| 51st-75th | 131,890 (24%) | 7,370 (22%) | 4,670 (23%) | 12,205 (24%) | 70, 685 (24%) | 36,960 (23%) | |
| 75th-100th | 91,930 (17%) | 5,925 (17%) | 3,495 (17%) | 9,455 (19%) | 51,330 (18%) | 21,725 (14%) | |
| Characteristics | Overall (n = 561,520a) | Body mass index | P-valueb | ||||
|---|---|---|---|---|---|---|---|
| < 20 (n = 34,705a) | 20 - 24 (n = 20,475a) | 25 - 29 (n = 51,690a) | 30 - 40 (n = 294,365a) | > 40 (n = 160,285a) | |||
| an (%). bChi-squared test with Rao and Scott’s second-order correction. SD: standard deviation. | |||||||
| Hypertension | 486,270 (87%) | 25,995 (75%) | 16,620 (81%) | 43,735 (85%) | 257,195 (87%) | 142,725 (89%) | < 0.001 |
| Diabetes mellitus | 296,520 (53%) | 7,305 (21%) | 7,230 (35%) | 24,855 (48%) | 158,845 (54%) | 98,285 (61%) | < 0.001 |
| Chronic kidney disease | 143,585 (26%) | 9,750 (28%) | 6,815 (33%) | 13,320 (26%) | 68,720 (23%) | 44,980 (28%) | < 0.001 |
| Heart failure | 214,075 (38%) | 17,205 (50%) | 10,320 (50%) | 18,985 (37%) | 98,010 (33%) | 69,555 (43%) | < 0.001 |
| Stroke | 5,730 (1.0%) | 565 (1.6%) | 360 (1.8%) | 650 (1.3%) | 2,615 (0.9%) | 1,540 (1.0%) | < 0.001 |
| Transient ischemic attack | 1,570 (0.3%) | 165 (0.5%) | 100 (0.5%) | 105 (0.2%) | 745 (0.3%) | 455 (0.3%) | < 0.001 |
| Atrial fibrillation | 115,670 (21%) | 10,180 (29%) | 6,175 (30%) | 10,530 (20%) | 55,015 (19%) | 33,770 (21%) | < 0.001 |
| Charleston comorbidity index | 3.2 (SD 4.6) | 3.9 (SD 4.8) | 4.0 (SD 5.1) | 3.2 (SD 4.6) | 3.0 (SD 4.2) | 3.4 (SD 5.1) | < 0.001 |
| Characteristics | Overall (n = 561,520a) | Body mass index | P-valueb | ||||
|---|---|---|---|---|---|---|---|
| < 20 (n = 34,705a) | 20 - 24 (n = 20,475a) | 25 - 29 (n = 51,690a) | 30 - 40 (n = 294,365a) | > 40 (n = 160,285a) | |||
| an (%). bChi-squared test with Rao and Scott’s second-order correction. STEMI: ST-elevation myocardial infarction; NSTEMI: non-ST-elevation myocardial infarction; PCI: percutaneous coronary intervention; CABG: coronary artery bypass graft. | |||||||
| STEMI | 119,885 (21%) | 5,240 (15%) | 3,300 (16%) | 12,680 (25%) | 68,935 (23%) | 29,730 (19%) | < 0.001 |
| NSTEMI | 397,565 (71%) | 24,660 (71%) | 14,435 (71%) | 35,165 (68%) | 206,515 (70%) | 116,790 (73%) | < 0.001 |
| Other MI (not MI/NSTEMI) | 17,340 (3.1%) | 2,215 (6.4%) | 1,330 (6.5%) | 1,590 (3.1%) | 6,845 (2.3%) | 5,360 (3.3%) | < 0.001 |
| Ventricular tachycardia | 37,030 (6.6%) | 2,315 (6.7%) | 1,265 (6.2%) | 3,650 (7.1%) | 19,060 (6.5%) | 10,740 (6.7%) | 0.14 |
| Ventricular fibrillation | 16,735 (3.0%) | 765 (2.2%) | 540 (2.6%) | 1,785 (3.5%) | 8,355 (2.8%) | 5,290 (3.3%) | < 0.001 |
| PCI | 258,650 (46%) | 7,380 (21%) | 5,635 (28%) | 23,935 (46%) | 149,550 (51%) | 72,150 (45%) | < 0.001 |
| CABG | 72,465 (13%) | 1,530 (4.4%) | 1,725 (8.4%) | 7,780 (15%) | 44,935 (15%) | 16,495 (10%) | < 0.001 |
| Systemic thrombolysis | 10,085 (1.8%) | 1,350 (3.9%) | 640 (3.1%) | 675 (1.3%) | 3,665 (1.2%) | 3,755 (2.3%) | < 0.001 |
| Characteristics | Overall (n = 561,520a) | Body mass index | P- valueb | ||||
|---|---|---|---|---|---|---|---|
| < 20 (n = 34,705a) | 20 - 24 (n = 20,475a) | 25 - 29 (n = 51,690a) | 30 - 40 (n = 294,365a) | > 40 (n = 160,285a) | |||
| aMean (SD); n (%). bWilcoxon rank-sum test for complex survey samples; Chi-squared test with Rao and Scott’s second-order correction. GI: gastrointestinal; PRBC: packed red blood cell. | |||||||
| Length of hospital | 5.0 (SD 5.7) | 6.6 (SD 7.5) | 6.7 (SD 7.0) | 5.3 (SD 6.2) | 4.6 (SD 4.9) | 5.2 (SD 6.3) | < 0.001 |
| Total charges | 105,172 (SD 121,538) | 89,245 (SD 117,306) | 110,480 (SD 147,366) | 116,281 (SD 132,570) | 105,114 (SD 110,906) | 104,445 (SD 132,798) | < 0.001 |
| Mechanical ventilation | 27,785 (4.9%) | 2,495 (7.2%) | 1,260 (6.2%) | 1,960 (3.8%) | 11,615 (3.9%) | 10,455 (6.5%) | < 0.001 |
| Upper GI bleeding | 8,900 (1.6%) | 1,380 (4.0%) | 830 (4.1%) | 1,015 (2.0%) | 3,345 (1.1%) | 2,330 (1.5%) | < 0.001 |
| Acute kidney injury | 122,995 (22%) | 9,675 (28%) | 6,345 (31%) | 11,940(23%) | 55,805 (19%) | 39,230 (24%) | < 0.001 |
| PRBC transfusion | 20,505 (3.7%) | 2,220 (6.4%) | 1,585 (7.7%) | 2,505 (4.8%) | 9,150 (3.1%) | 5,045 (3.1%) | < 0.001 |
| Circulatory shock | 36,945 (6.6%) | 2,940 (8.5%) | 1,985 (9.7%) | 4,200 (8.1%) | 17,360 (5.9%) | 10,460 (6.5%) | < 0.001 |
| Mortality | 19,910 (3.5%) | 3,220 (9.3%) | 1,615 (7.9%) | 1,890 (3.7%) | 7,105 (2.4%) | 6,080 (3.8%) | < 0.001 |
| Characteristics | Univariate | Multivariate | ||
|---|---|---|---|---|
| OR (95% CI) | P-value | OR (95% CI) | P-value | |
| BMI: body mass index; OR: odds ratio; CI: confidence interval. | ||||
| BMI groups | ||||
| < 20 | Ref | Ref | Ref | Ref |
| 20 - 24 | 0.87 (0.75 - 1.00) | 0.057 | 0.84 (0.73 - 0.96) | 0.013 |
| 25 - 29 | 0.56 (0.48 - 0.64) | < 0.001 | 0.37 (0.33 - 0.42) | < 0.001 |
| 30 - 40 | 0.44 (0.39 - 0.49) | < 0.001 | 0.24 (0.22 - 0.27) | < 0.001 |
| > 40 | 0.73 (0.65 - 0.82) | < 0.001 | 0.39 (0.35 - 0.43) | < 0.001 |
| Age | 1.03 (1.03 - 1.04) | < 0.001 | 1.05 (1.04 - 1.05) | < 0.001 |
| Gender (female) | 0.88 (0.82 - 0.94) | < 0.001 | 1.13 (1.06 - 1.21) | < 0.001 |
| Atrial fibrillation | 1.26 (1.17 - 1.36) | < 0.001 | 1.93 (1.80 - 2.06) | < 0.001 |
| Heart failure | 2.03 (1.89 - 2.18) | < 0.001 | 2.55 (2.38 - 2.72) | < 0.001 |
| Hypertension | 0.51 (0.47 - 0.55) | < 0.001 | 0.59 (0.54 - 0.64) | < 0.001 |
| Diabetes mellitus | 1.00 (0.93 - 1.08) | > 0.9 | 0.90 (0.85 - 0.96) | 0.002 |