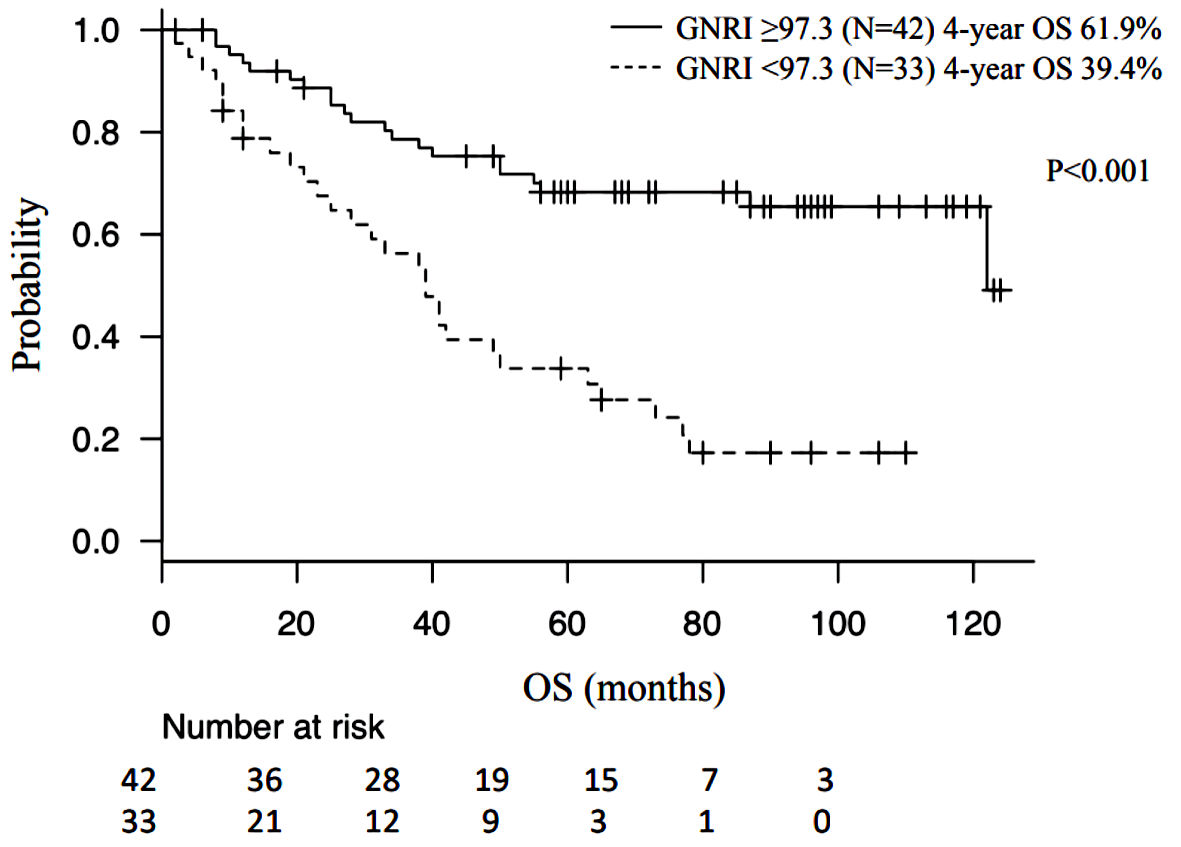
Figure 1. Kaplan-Meier curve and log-rank test. GNRI: geriatric nutritional risk index; OS: overall survival.
| Journal of Clinical Medicine Research, ISSN 1918-3003 print, 1918-3011 online, Open Access |
| Article copyright, the authors; Journal compilation copyright, J Clin Med Res and Elmer Press Inc |
| Journal website https://www.jocmr.org |
Original Article
Volume 14, Number 10, October 2022, pages 409-415
Clinical Utility of the Geriatric Nutritional Risk Index Before Surgical Intervention for Epithelial Ovarian Cancer Patients: A Retrospective Study
Figures

Tables
| Variables | Low GNRI group (n = 33) | High GNRI group (n = 42) | P value |
|---|---|---|---|
| BMI: body mass index; CA-125: cancer antigen-125; FIGO: International Federation of Gynecology and Obstetrics; GNRI: geriatric nutritional risk index. | |||
| Median age in years (range) | 60.0 (26 - 87) | 58.5 (30 - 86) | 0.478 |
| BMI (kg/m2) | 0.0113 | ||
| < 22 | 24 | 18 | |
| ≥ 22 | 9 | 24 | |
| Albumin (g/dL) | < 0.01 | ||
| < 3.5 | 19 | 4 | |
| ≥ 3.5 | 14 | 38 | |
| Disease stage (FIGO classification) | 0.166 | ||
| I, II | 11 | 21 | |
| III, IV | 22 | 21 | |
| Ascites | 0.626 | ||
| + | 1 | 3 | |
| - | 32 | 39 | |
| Residual tumor | 0.0217 | ||
| Complete, optimal | 13 | 28 | |
| Suboptimal | 20 | 14 | |
| Fibrinogen (mg/dL) | 463 (236 - 808) | 355 (190 - 722) | < 0.05 |
| CA-125 (U/mL) | 1.00 | ||
| < 35 | 5 | 6 | |
| ≥ 35 | 28 | 34 | |
| Histological type | 0.41 | ||
| Serous adenocarcinoma | 9 | 14 | |
| Mucus adenocarcinoma | 3 | 5 | |
| Endometrium adenocarcinoma | 7 | 14 | |
| Clear cell adenocarcinoma | 10 | 7 | |
| Others | 4 | 2 | |
| HR (95% CI) | P value | HR (95% CI) | P value | |
|---|---|---|---|---|
| BMI: body mass index; CA: cancer antigen; FIGO: International Federation of Gynecology and Obstetrics; GNRI: geriatric nutritional risk index; HR: hazard ratio; CI: confidence interval. | ||||
| Age ≥ 60 (years) | 0.92 (0.518 - 1.64) | 0.777 | ||
| Albumin < 3.5 (g/dL) | 2.04 (1.14 - 3.68) | 0.0171 | 1.26 (0.651 - 2.44) | 0.492 |
| BMI < 22 (kg/m2) | 1.04 (0.578 - 1.86) | 0.904 | ||
| Ascites + | 1.03 (0.307 - 3.47) | 0.960 | ||
| CA-125 ≥ 35 (U/L) | 2.00 (0.840 - 4.75) | 0.117 | ||
| GNRI < 97.3 | 2.40 (1.33 - 4.31) | < 0.01 | 1.93 (1.01 - 3.70) | 0.0481 |
| Histological subtype | 1.08 (0.855 - 1.37) | 0.513 | ||
| Residual tumor ≥ optimal | 2.40 (1.33 - 4.31) | < 0.01 | 1.84 (0.910 - 3.70) | 0.09 |
| FIGO classification ≥ stage III | 1.72 (0.939 - 3.15) | 0.0789 | ||