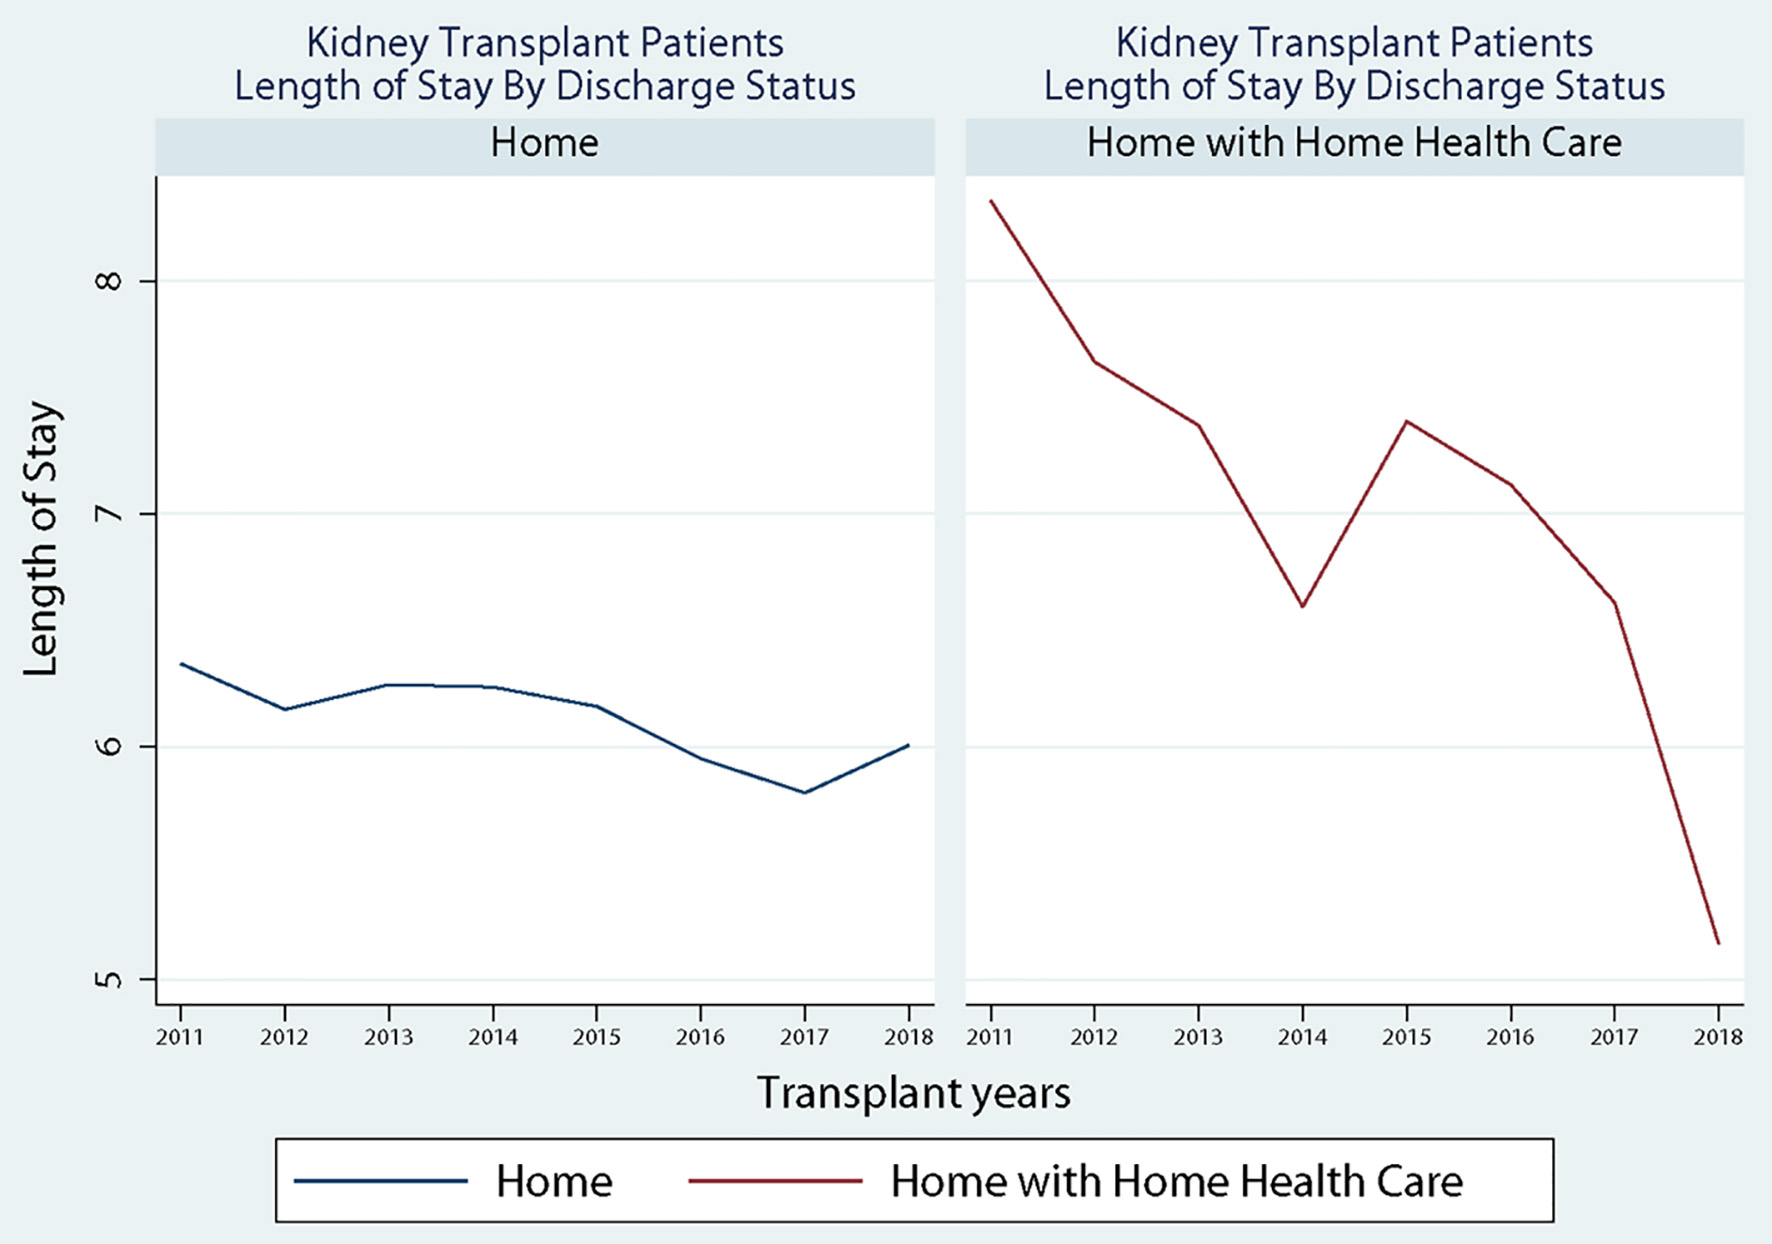
Figure 1. Discharged status across study period.
| Journal of Clinical Medicine Research, ISSN 1918-3003 print, 1918-3011 online, Open Access |
| Article copyright, the authors; Journal compilation copyright, J Clin Med Res and Elmer Press Inc |
| Journal website https://www.jocmr.org |
Original Article
Volume 14, Number 3, March 2022, pages 111-118
Impact of Change in Allocation Score Methodology on Post Kidney Transplant Average Length of Stay
Figure
Tables
| Allocation score change | Significance | ||||
|---|---|---|---|---|---|
| Prior | Post | ||||
| Frequency | % | Frequency | % | ||
| Prior to allocation score change was from 2011 to 2014. Post to allocation score change was from 2015 to 2018. SD: standard deviation. | |||||
| Year | 0.000 | ||||
| 2011 | 895 | 25.42% | 0 | 0.00% | |
| 2012 | 850 | 24.14% | 0 | 0.00% | |
| 2013 | 887 | 25.19% | 0 | 0.00% | |
| 2014 | 889 | 25.25% | 0 | 0.00% | |
| 2015 | 0 | 0.00% | 988 | 23.12% | |
| 2016 | 0 | 0.00% | 1,006 | 23.54% | |
| 2017 | 0 | 0.00% | 1,030 | 24.10% | |
| 2018 | 0 | 0.00% | 1,250 | 29.25% | |
| Transferred to | 0.000 | ||||
| Home | 2,698 | 76.63% | 3,421 | 80.04% | |
| Home with home health | 823 | 23.37% | 853 | 19.96% | |
| Gender | 0.016 | ||||
| Male | 2,106 | 59.81% | 2,668 | 62.42% | |
| Female | 1,415 | 40.19% | 1,606 | 37.58% | |
| Dialysis | 0.000 | ||||
| No | 2,942 | 83.56% | 3,246 | 75.95% | |
| Yes | 579 | 16.44% | 1,028 | 24.05% | |
| Race/ethnicity | |||||
| Non-Hispanic white | 1,641 | 46.61% | 1,653 | 38.68% | 0.000 |
| Non-Hispanic black | 1,015 | 28.83% | 1,375 | 32.17% | |
| Hispanic | 643 | 18.26% | 937 | 21.92% | |
| Other | 222 | 6.31% | 309 | 7.23% | |
| Elixhauser Comorbidity | |||||
| Diabetes | 1,118 | 31.75% | 1,489 | 34.84% | 0.005 |
| Cardiovascular disease | 984 | 27.95% | 1,244 | 29.11% | 0.272 |
| Cancer | 17 | 0.48% | 25 | 0.58% | 0.542 |
| Hypertension | 3,353 | 95.23% | 4,061 | 95.02% | 0.582 |
| Neurological disorders | 119 | 3.38% | 135 | 3.16% | 0.579 |
| Psychiatric illness | 296 | 8.41% | 320 | 7.49% | 0.131 |
| Anemia | 100 | 2.84% | 99 | 2.32% | 0.143 |
| Mean | SD | Mean | SD | ||
| Length of stay | 6.52 | 4.36 | 6.08 | 4.17 | 0.000 |
| Age | 50.78 | 16.02 | 51.06 | 15.99 | 0.449 |
| Elixhauser Comorbidity Index | 3.89 | 1.60 | 4.00 | 1.56 | 0.006 |
| Elixhauser Comorbidity Index without diabetes | 3.58 | 1.45 | 3.64 | 1.42 | 0.043 |
| All (N = 6,119) | Prior to allocation score change (N = 2,698) | PS unmatched effect size* | PS unmatched P-value | Matched prior to allocation score change (N = 1,592) | Post to allocation score change (N = 3,421) | PS matched effect size* | PS matched P-value | |
|---|---|---|---|---|---|---|---|---|
| Data from The Agency for Health Care Administration from 2011 to 2018. Prior to allocation score change was from 2011 to 2014. Post to allocation score change was from 2015 to 2018. *Absolute standardized mean difference (Magnet-matched)/(pooled standard deviation) < 0.1. PS: propensity score. | ||||||||
| Hospital number | - | - | 0.07 | 0.003 | - | - | 0.01 | 0.775 |
| Age | 50.17 | 50.29 | 0.14 | 0.584 | 50.14 | 50.07 | 0.01 | 0.846 |
| Elixhauser Comorbidity Index | 3.62 | 3.57 | 0.06 | 0.011 | 3.61 | 3.67 | 0.05 | 0.141 |
| Gender | 0.047 | 0.379 | ||||||
| Male | 61.99 | 60.6 | 64.1 | 63.08 | ||||
| Female | 38.01 | 39.4 | 0.05 | 35.9 | 36.92 | 0.01 | ||
| Race/ethnicity | 0.000 | 0.689 | ||||||
| Non-Hispanic White | 44.93 | 51.07 | 41.54 | 40.08 | ||||
| Non-Hispanic Black | 29.11 | 26.83 | 0.08 | 31.13 | 30.9 | 0.04 | ||
| Hispanic | 18.81 | 14.83 | 0.18 | 18.04 | 21.95 | 0.01 | ||
| Other | 7.16 | 7.26 | 0.01 | 9.3 | 7.07 | 0.01 | ||
| Dialysis | 0.000 | 0.525 | ||||||
| No | 80.7 | 84.43 | 77.11 | 77.76 | ||||
| Yes | 19.3 | 15.57 | 0.17 | 22.8 | 22.24 | 0.03 | ||
| Diabetes | 0.138 | 0.405 | ||||||
| No | 68.92 | 69.9 | 69.07 | 68.14 | ||||
| Yes | 31.08 | 30.1 | 0.04 | 30.93 | 31.86 | 0.01 | ||
| All (N = 1,676) | Prior to allocation score change (N = 823) | PS unmatched effect size* | PS unmatched P-value | Matched prior to allocation score change (N = 437) | Post to allocation score change (N = 852) | PS matched effect size* | PS matched P-value | |
|---|---|---|---|---|---|---|---|---|
| Data from The Agency for Health Care Administration from 2011 to 2018. Prior to allocation score change was from 2011 to 2014. Post to allocation score change was from 2015 to 2018. *Absolute standardized mean difference (Magnet-matched)/(pooled standard deviation) < 0.1. PS: propensity score. | ||||||||
| Age | 53.75 | 52.4 | 0.17 | 0.000 | 55.5 | 55.04 | 0.03 | 0.539 |
| Elixhauser Comorbidity Index | 3.59 | 3.61 | 0.03 | 0.557 | 3.65 | 3.57 | 0.02 | 0.239 |
| Gender | 0.288 | 0.372 | ||||||
| Male | 58.53 | 57.23 | 61.9 | 59.79 | ||||
| Female | 41.47 | 42.77 | 0.05 | 40.21 | 0.07 | |||
| Race/ethnicity | 0.897 | 38.1 | 0.425 | |||||
| Non-Hispanic White | 32.52 | 31.96 | 31.18 | 33.06 | ||||
| Non-Hispanic Black | 36.34 | 35.36 | 0.04 | 39.04 | 37.28 | 0.02 | ||
| Hispanic | 25.6 | 29.53 | 0.17 | 27.32 | 21.81 | 0.03 | ||
| Other | 5.55 | 3.16 | 0.2 | Oct-76 | 7.85 | 0.02 | ||
| Dialysis | 0.000 | 0.795 | ||||||
| No | 74.58 | 80.68 | 68.11 | 68.7 | ||||
| Yes | 25.42 | 19.32 | 0.28 | 31.89 | 31.3 | 0.03 | ||
| Diabetes | 0.001 | 0.922 | ||||||
| No | 61.34 | 65.25 | 57.8 | 57.63 | ||||
| Yes | 28.66 | 34.75 | 0.16 | 42.2 | 42.37 | 0.03 | ||
| Length of stay | Kidney Transplant Allocation Score (0 = Prior, 1 = Post) | ||
|---|---|---|---|
| N | Coefficient | 95% CI | |
| *P < 0.05, **P < 0.01, ***P < 0.001. Prior to allocation score change was from 2011 to 2014. Post to allocation score change was from 2015 to 2018. CI: confidence interval. | |||
| Transplant patients transferred to home | 5,013 | -0.68*** | -0.95, -0.42 |
| Transplant patients transferred to home with home health | 1,289 | -1.90*** | -2.69, -1.11 |