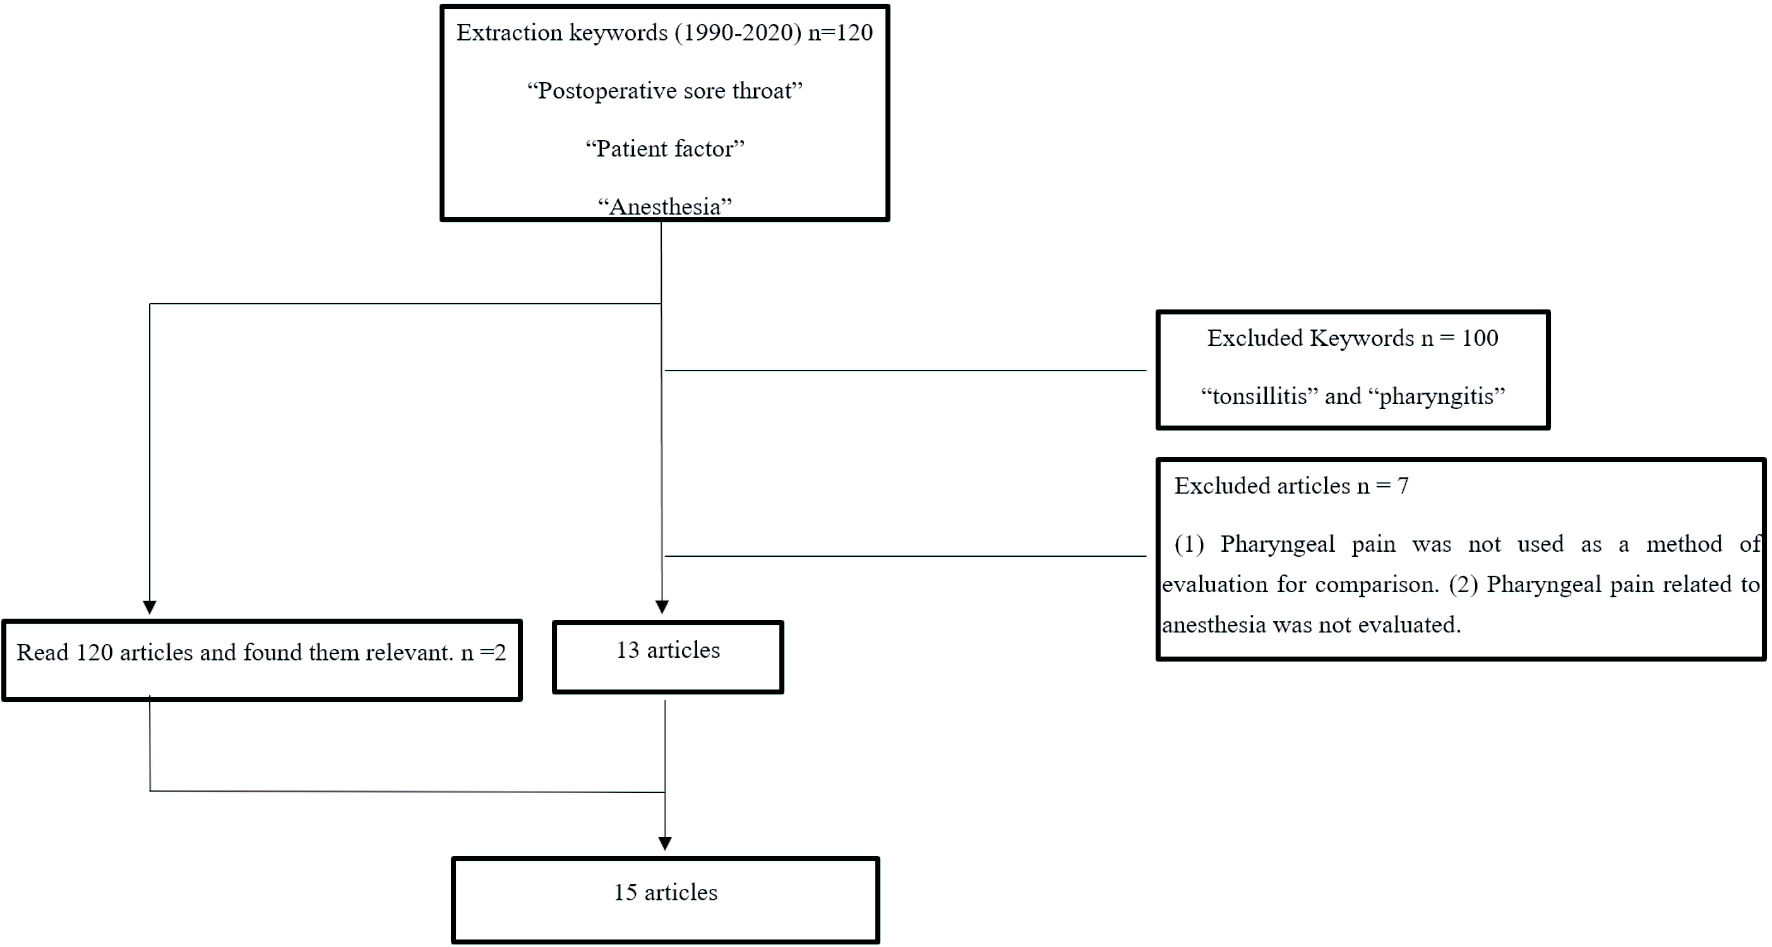
Figure 1. Flowchart of literature review.
| Journal of Clinical Medicine Research, ISSN 1918-3003 print, 1918-3011 online, Open Access |
| Article copyright, the authors; Journal compilation copyright, J Clin Med Res and Elmer Press Inc |
| Journal website https://www.jocmr.org |
Review
Volume 14, Number 2, February 2022, pages 88-94
A Literature Review of Factors Related to Postoperative Sore Throat
Figure
Tables
| Author | Number of patients | Comparison groups (POST incidence rate, median) | Results |
|---|---|---|---|
| POST: postoperative sore throat; ASA-PS: American Society of Anesthesiologists physical status; LMA: laryngeal mask airway; AWS: airway scope; ILM: intubating laryngeal mask; FAST: Foley Airway Stylet Tool; IT: introducer tool; ETT: endotracheal tube; FM: facemask; RLT: reusable laryngeal tube; DLT: disposable laryngeal tube; PLA: Cobra perilaryngeal airway; LM-BL: blind intubation through the intubating laryngeal mask; ILM-LW: light wand-guided intubation through the intubating laryngeal mask; RAE: right angle endotracheal; BMI: body mass index; PONV: postoperative nausea and vomiting. | |||
| Shariffuddin et al, 2017 [24] | 147 patients | Ambu®AuraGain™ (10%) | There was a significant reduction in the incidence of POST in the Ambu®AuraGain™ group |
| ASA-PS = I - III | LMA Supreme™ (38%) | ||
| Tan et al, 2005 [20] | 135 patients | LMA Classic™ (41%) | SoftSeal™ group had the highest incidence of mucosal trauma; LMAUnique™ group had the lowest incidence of POST |
| ASA-PS = I - II | LMA Unique™ (14%) | ||
| SoftSeal™ (42%) | |||
| Teoh et al, 2009 [30] | 140 patients | Pentax AWS (0%) | Mucosal bleeding, lip bleeding, and POST were significantly more common in the Glidescope group. |
| ASA-PS = I - II | Glidescope (18.6%) | ||
| Bein et al, 2004 [21] | 80 patients | ILM (3, 0 - 6) | The incidences of POST and hoarseness were lower in the Bonfils group. |
| ASA-PS = I - III | Bonfils (0, 0 - 4) | ||
| Chen et al, 2014 [19] | 144 patients | FAST (21.2%) | The incidence of POST was higher in the FAST group. |
| ASA-PS = I - II | IT (6.8%) | ||
| Higgins et al, 2002 [2] | 5,264 patients | ETT (45.5%) | Age, gender, ASA, BMI, duration of surgery, type of airway management, and surgical technique were factors. |
| ASA-PS = I - III | LMA (17.5%) | ||
| FM (3.3%) | |||
| Women: men = 13.4%: 9.1% | |||
| Biro et al, 2005 [29] | 809 patients | POST occurrence (40%) | Female, history of smoking or lung disease, anesthesia for prolonged denture, PONV, and bloodstains on the intubation tube were related factors. |
| No POST occurrence (60%) | |||
| Jaensson et al, 2014 [25] | 297 patients | ETT (32%) | ETT had a higher incidence of POST than LMA; there was no significant difference in the incidence of POST between ETT and LAM. |
| ASA-PS = I - III | LMA (19%) | ||
| Griffiths et al, 2013 [26] | 102 patients | ETT (32.7%) | There was no significant difference in POST occurrence between the two groups. |
| ASA-PS = I - II | LMA ProSeal (23.5%) | ||
| Amini et al, 2007 [27] | 100 patients | RLT (8 patients) | Cuff pressure at the end of surgery was significantly lower in the DLT group. |
| ASA-PS = I - II | DLT (12 patients) | There was no significant difference in POST occurrence between the two groups. | |
| Andrews et al, 2009 [22] | 90 patients | Cobra PLA™ (17 patients) | Insertion time was longer in Cobra PLA. |
| ASA-PS = I - IV | LMA (8 patients) | There was no significant difference in POST occurrence between the two groups. | |
| Kihara et al, 2000 [23] | 120 patients | ILM-BL (5%) | There was no difference in POST incidence and severity or hoarseness in the two groups. |
| ASA-PS = I - II | ILM-LW (6.6%) | ||
| Bennett et al, 2000 [28] | 126 patients | Contents of the cuff | There was no significant difference in the occurrence of POST. |
| ASA-PS = I - II | Air (15.6%) | There was no significant difference between intubation time and cuff pressure and the occurrence of POST. | |
| Saline solution (14.5%) | Gastric tube insertion was a confounding factor in the occurrence of POST. | ||
| Lomax et al, 2011 [31] | 110 patients | GlideRite® (2: 0 - 3) | There was no significant difference in the incidence of POST. |
| ASA-PS = I - II | Pre-rotated RAE™ (2: 0 - 5) | ||
| Schaefer et al, 1994 [32] | 100 patients | Laryngoscopic (16%) | There was no significant difference in complications between the two groups. |
| ASA-PS = I - II | Fiber optic (14%) | ||
| Author | Time to secure airway | POST occurrence status |
|---|---|---|
| POST: postoperative sore throat; FAST: Foley Airway Stylet Tool; IT: introducer tool; LMA: laryngeal mask airway; AWS: airway scope; PLA: Cobra perilaryngeal airway; ILM-BL: blind intubation through the intubating laryngeal mask; ILM-LW: light wand-guided intubation through the intubating laryngeal mask. | ||
| Chen et al, 2014 [19] | FAST: 17.1 ± 6.1 s | FAST (21.2%), IT (6.8%) |
| IT: 12.6 ± 4.7 s | ||
| Tan et al, 2005 [20] | LMA Classic™: 32.9 s (15 - 65 s) | LMA Classic™ (41%) |
| LMA Unique™: 39.6 s (16 - 130 s) | LMA Unique™ (14%) | |
| SoftSeal™: 49.4 s (13 - 300 s) | SoftSeal™ (42%) | |
| Bein et al, 2004 [21] | Bonfils, mean: 40 s | Bonfils, median: 4 (0 - 4) |
| LMA, mean: 28 s | LMA, median: 3 (0 - 6) | |
| Teoh et al, 2009 [30] | Pentax AWS, mean: 18.9 s | Pentax AWS: (0%) |
| Glidescope, mean: 27.8 s | Glidescope: (18.6%) | |
| Andrews et al, 2009 [22] | Cobra PLA™: 39 ± 21 s | Cobra PLA™ (17 patients) |
| LMA: 27 ± 10 s | LMA: (8 patients) | |
| Kihara et al, 2005 [23] | ILM-BL: 66 s | ILM-BL (5%) |
| ILM-LW: 46 s | ILM-LW (6.6%) | |
| Shariffuddin et al, 2017 [24] | Three levels of tube insertion ease (easy, acceptable, and difficult) | Ambu®AuraGain™ (10%) |
| Ambu®AuraGain™ (48%:40%:12%) | LMASupreme™ (38%) | |
| LMASupreme™ (74%:18%:10%) | ||
| Author | Cuff pressure | Occurrence of POST |
|---|---|---|
| POST: postoperative sore throat; LT-R: reusable laryngeal tube; LT-D: disposable laryngeal tube. | ||
| Amini et al, 2007 [27] | LT-R: 55.1 cm H2O | LT-R (8 patients) |
| LT-D: 61.7 cm H2O | LT-D (12 patients) | |
| Bennett et al, 2000 [28] | The air group: in the air group mean intra-cuff pressure increased significantly (start: 14.0 mm Hg, end: 40.9 mm Hg) | Air (15.6%), saline solution (14.5%) |
| The saline solution group: in the saline group there was no significant increase (start: 12.7 mm Hg, end: 14.6 mm Hg). | ||
| Author | Predictors | OR | 95% CI | P value |
|---|---|---|---|---|
| POST: postoperative sore throat; ASA-PS: American Society of Anesthesiologists physical status; ETT: endotracheal tube; FM: facemask; LMA: laryngeal mask airway; PONV: postoperative nausea and vomiting; OR: odds ratio; CI: confidence interval. | ||||
| Higgins et al, 2002 [2] | Age (in 10-year increments) | 0.92 | 0.85 - 0.98 | 0.05 |
| Sex, male/female | 0.76 | 0.59 - 0.99 | 0.05 | |
| ASA-PS III vs. I/II | 0.45 | 0.21 - 0.94 | 0.05 | |
| Postoperative stay, every 30 min | 1.05 | 1.01 - 1.10 | 0.05 | |
| Succinylcholine | 1.67 | 1.25 - 2.23 | 0.0005 | |
| ETT vs. FM | 12.4 | 8.83 - 17.39 | 0.0001 | |
| LMA vs. FM | 5.26 | 3.79 - 7.29 | 0.0001 | |
| Ophthalmic surgery | 0.58 | 0.40 - 0.84 | 0.01 | |
| Gynecologic surgery | 1.52 | 1.14 - 2.03 | 0.01 | |
| Biro et al, 2005 [29] | Female | 1.66 | 0.003 | |
| Bloodstain on intubation tube | 4.81 | 0.001 | ||
| Artificial tooth | 0.46 | 0.001 | ||
| History of respiratory disease | 3.12 | 0.02 | ||
| Young patients (per year) | 0.98 | 0.001 | ||
| Anesthesia time | 1.27 | 0.001 | ||
| History of PONV | 0.29 | 0.001 | ||