Figures
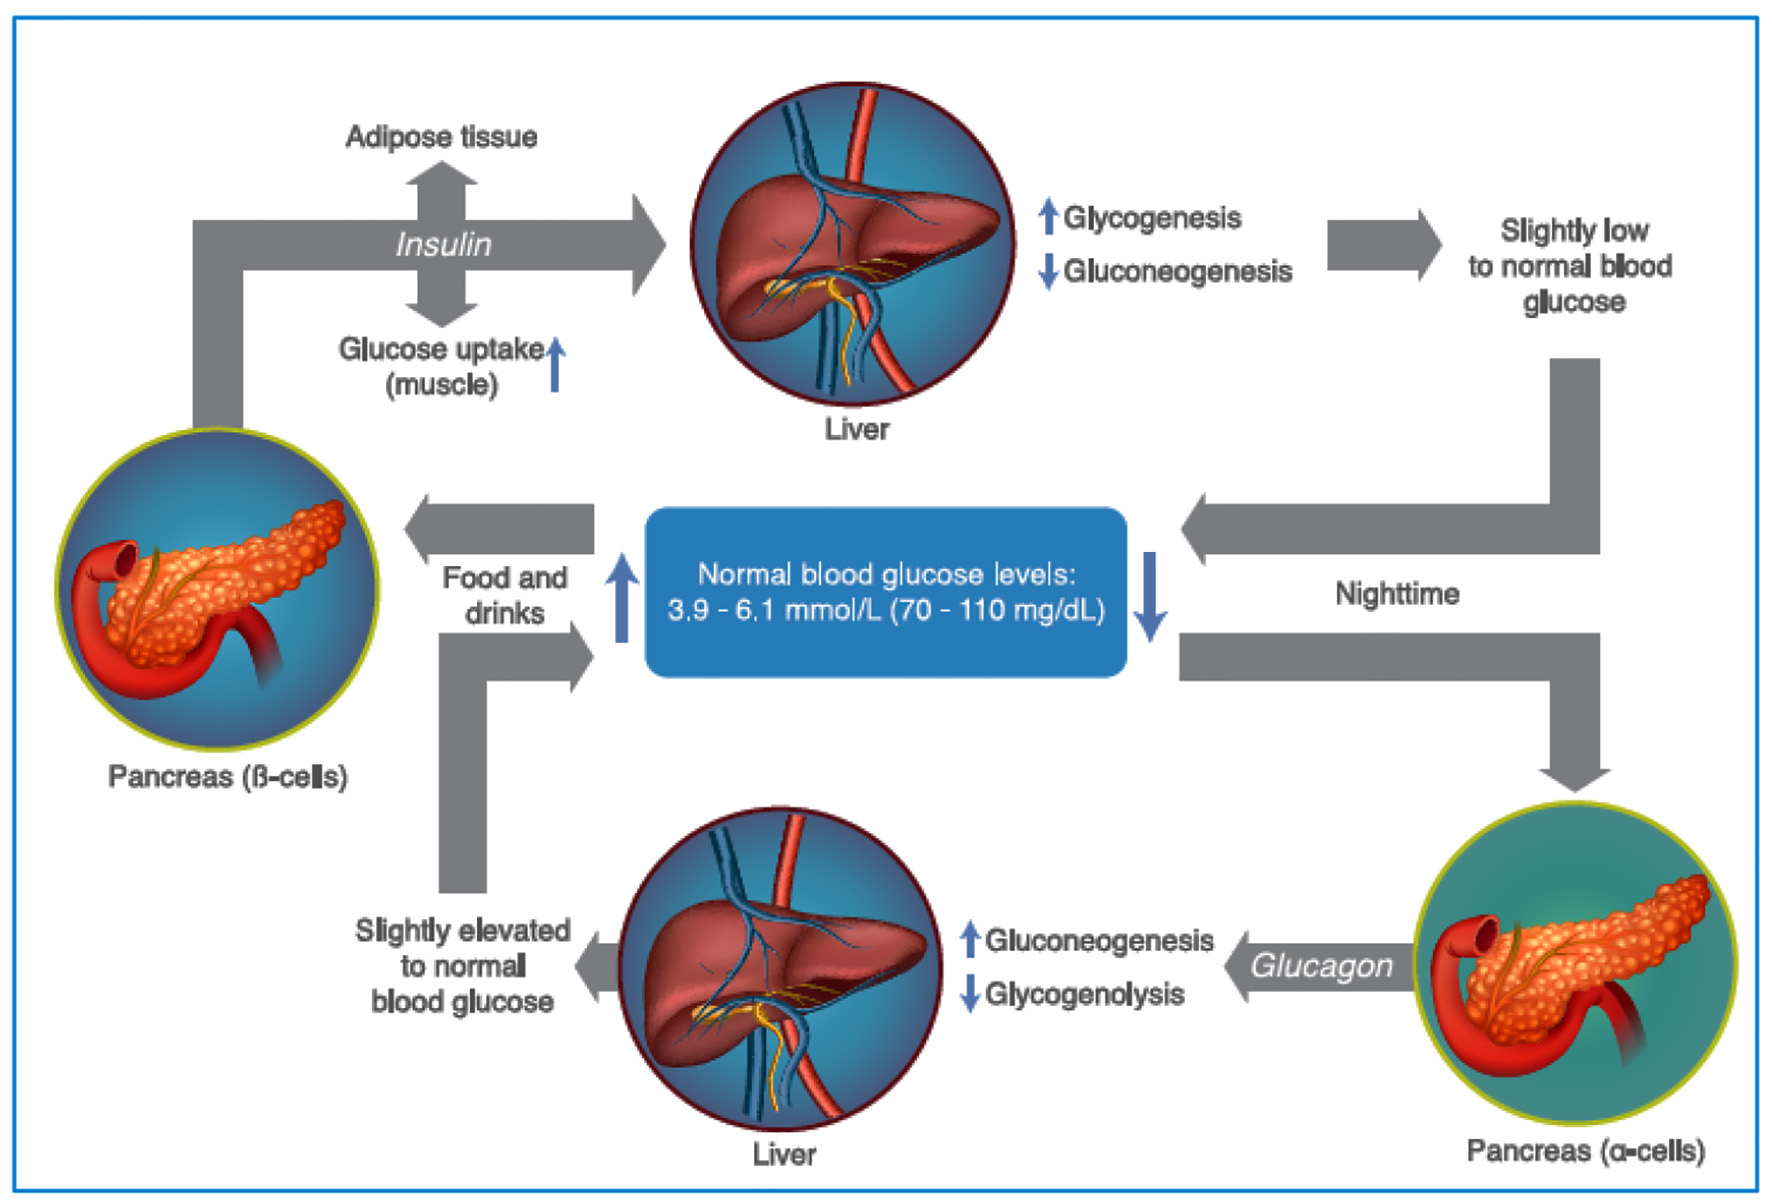
Figure 1. Maintenance of plasma glucose levels, through the regulation of insulin and glucagon. As glycemic levels drop, the pancreatic α cells secrete glucagon, increasing gluconeogenesis and glycogenolysis, increasing the levels of glycemia. After food intake, the levels of glycemia rise promoting insulin release (by the pancreatic β cells) which increase the glucose uptake in the muscle and adipose tissue, in addition to promoting glycogenogenesis and reducing gluconeogenesis (see text for additional details). Source: author’s elaboration.
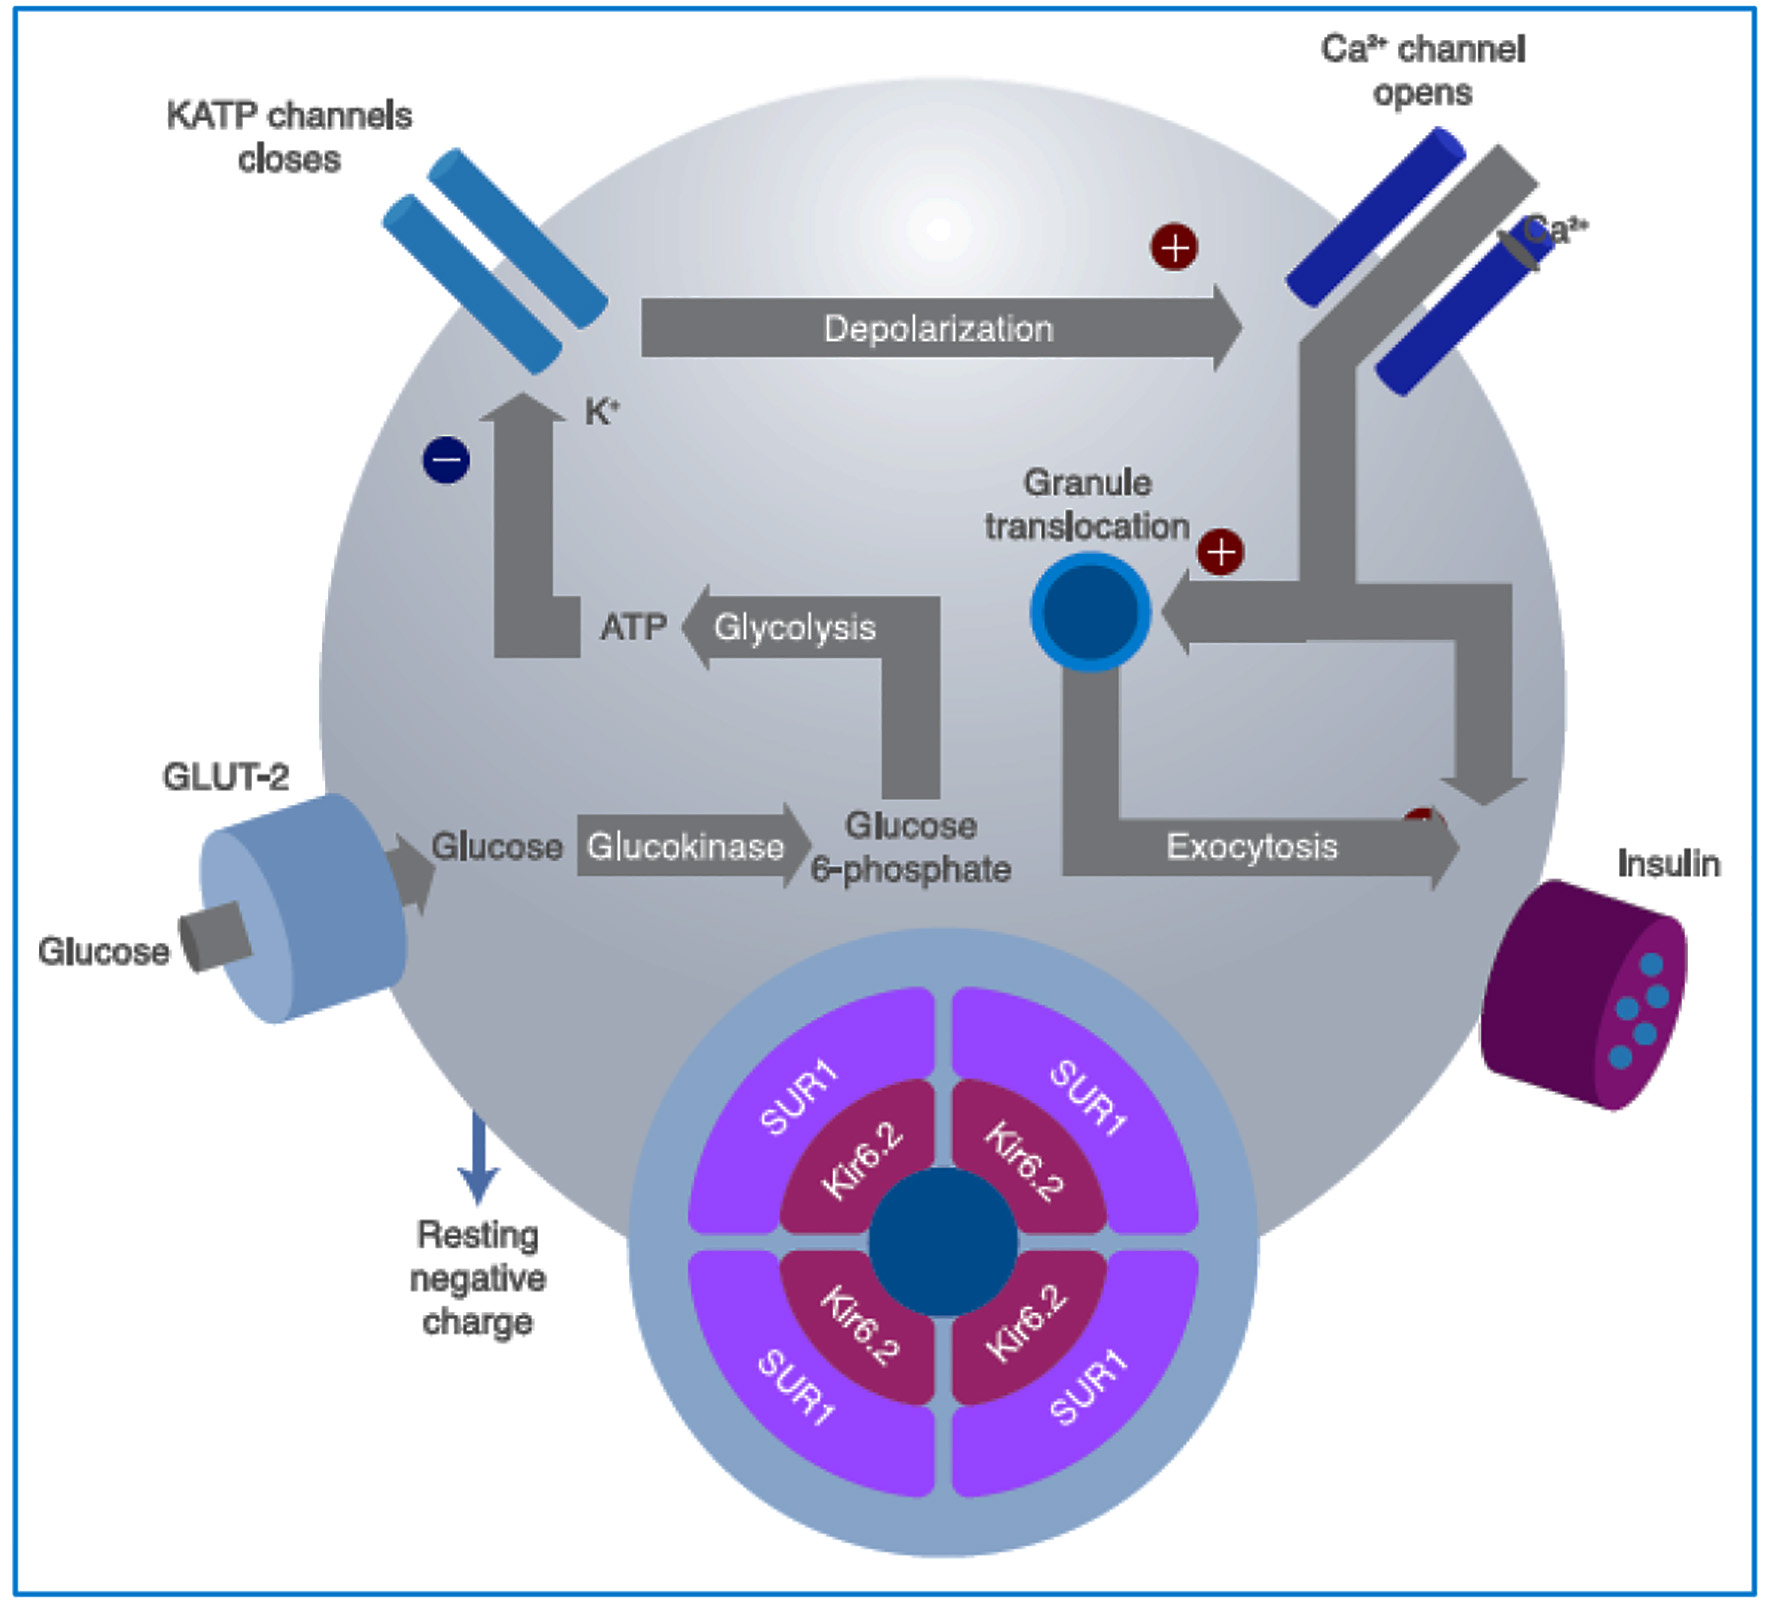
Figure 2. Intracellular mechanisms through which glucose stimulates insulin secretion. Glucose is metabolized inside the β cell for ATP production, closing the ATP-sensitive K+ channels on the cell membrane. This prevents the K+ ions from exiting the cell, causing membrane depolarization, which also leads to opening of the voltage-dependent Ca2+ channels on the membrane, allowing for the entrance of Ca2+ into the cell, increasing its cytosol concentration, and finally inducing granule exocytosis. Sulfonylureas bind to the SUR1 component of the KATP channel (see text for further details). GLUT: glucose transporter; SU: sulfonylureas; SUR1: sulfonylurea receptor subunits; ATP: adenosine triphosphate. Source: author’s elaboration.
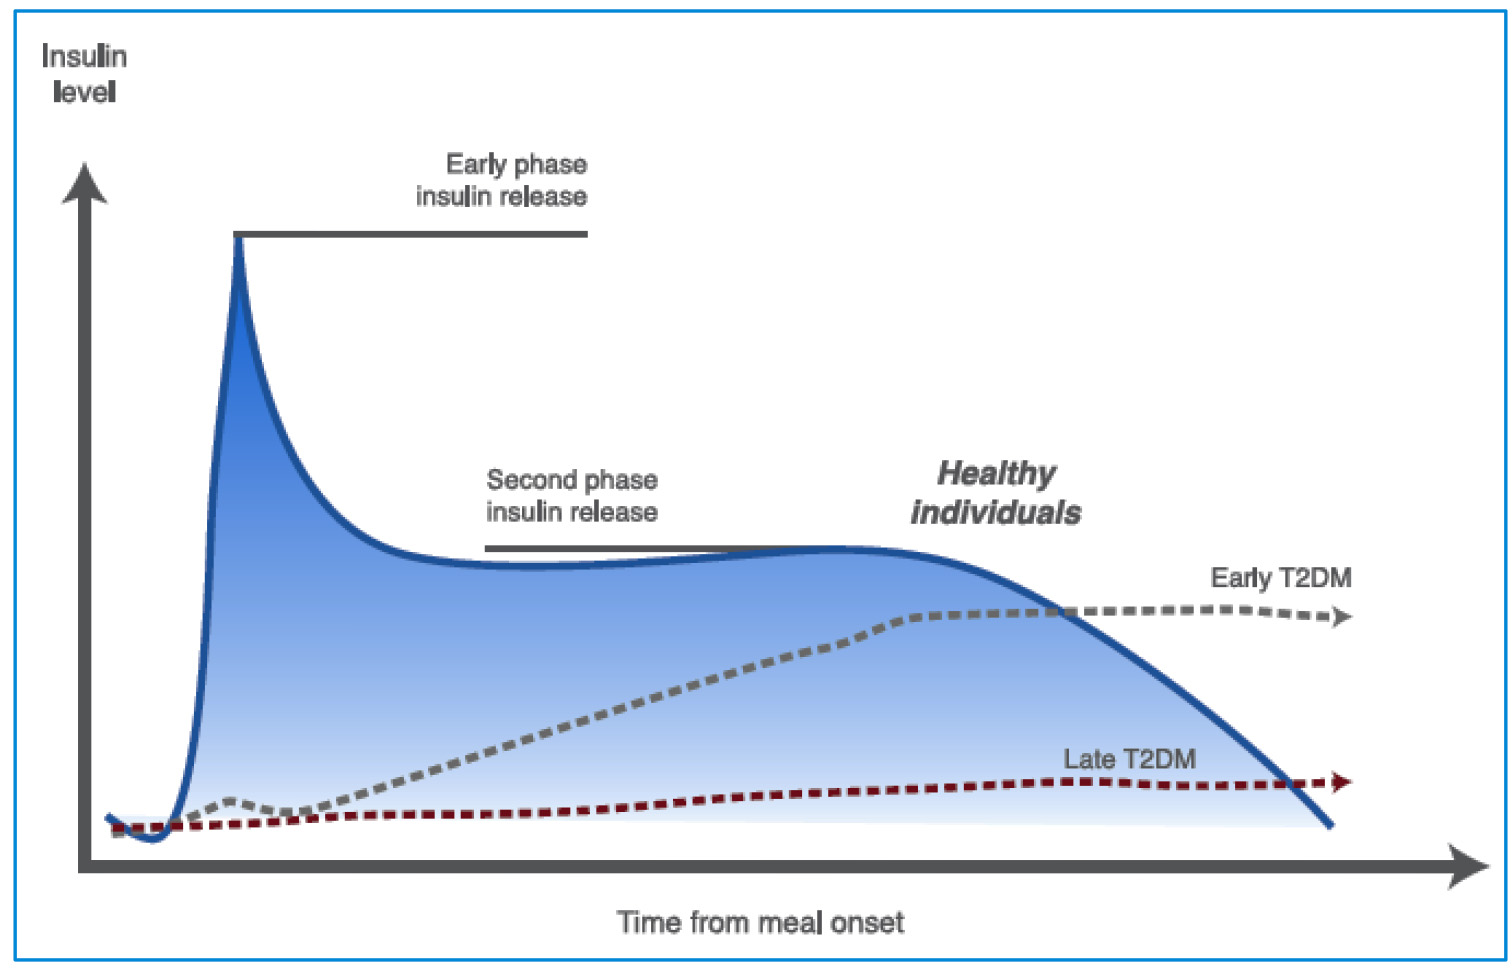
Figure 3. Insulin secretion phases in healthy and T2DM individuals. In early phase insulin release the β cells produce insulin in response to rising glucose levels. Proinsulin (the precursor molecule) is cleaved into C-peptide and insulin. The “early phase insulin release” occurs within 2 min of glucose arriving in the blood stream and continues for about 10 - 15 min. This phase prevents post-prandial hyperglycemia. A second phase of insulin release continues until blood glucose levels return to normal (see text for further details). T2DM: type 2 diabetes mellitus. Source: author’s elaboration.
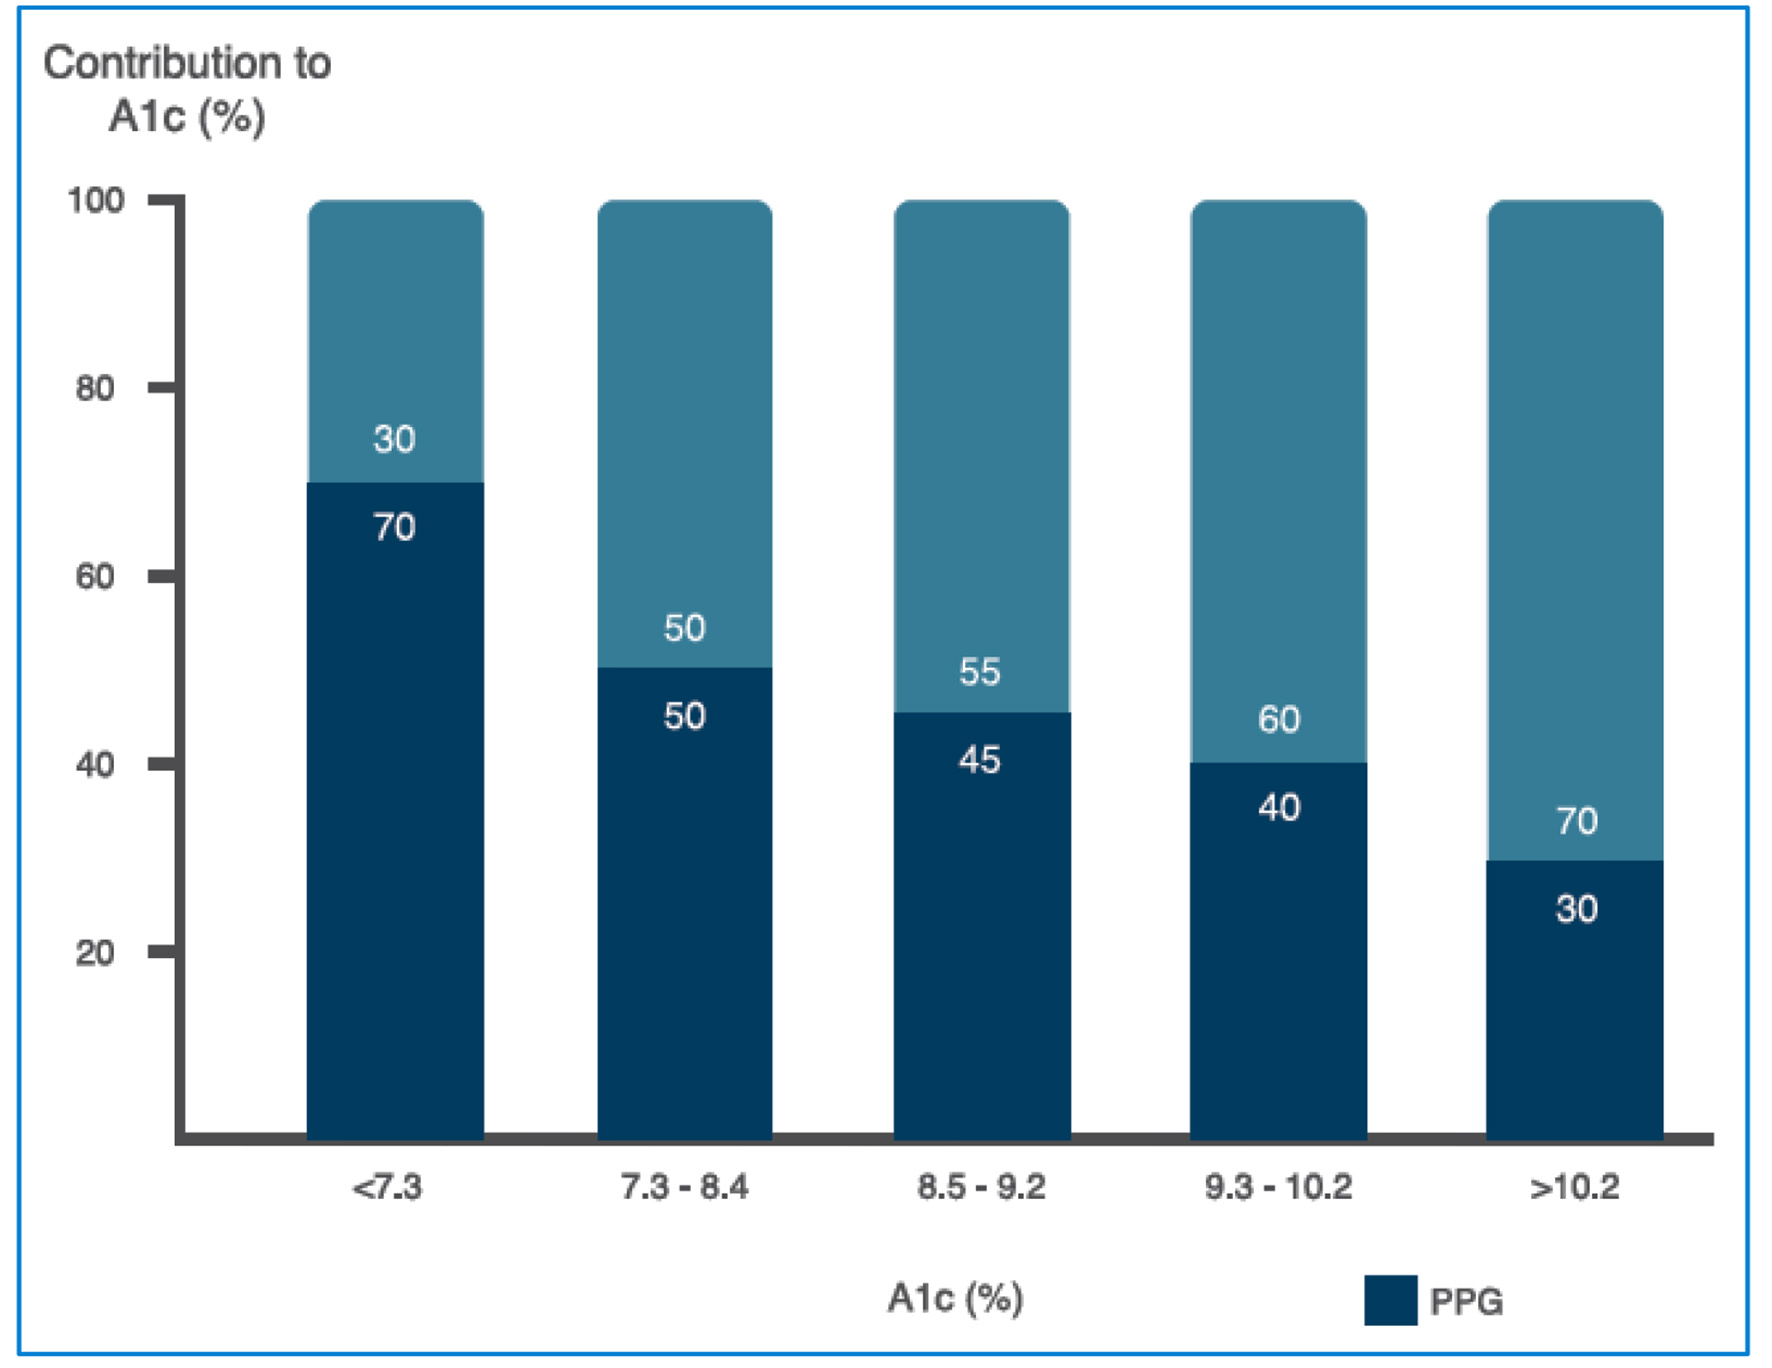
Figure 4. Relative contribution of FPG and PPG across a broad range of A1c levels (see text for further details). FPG: fasting plasma glucosa, PPG: postprandial plasma glucose. Source: adapted from Ref. [29].
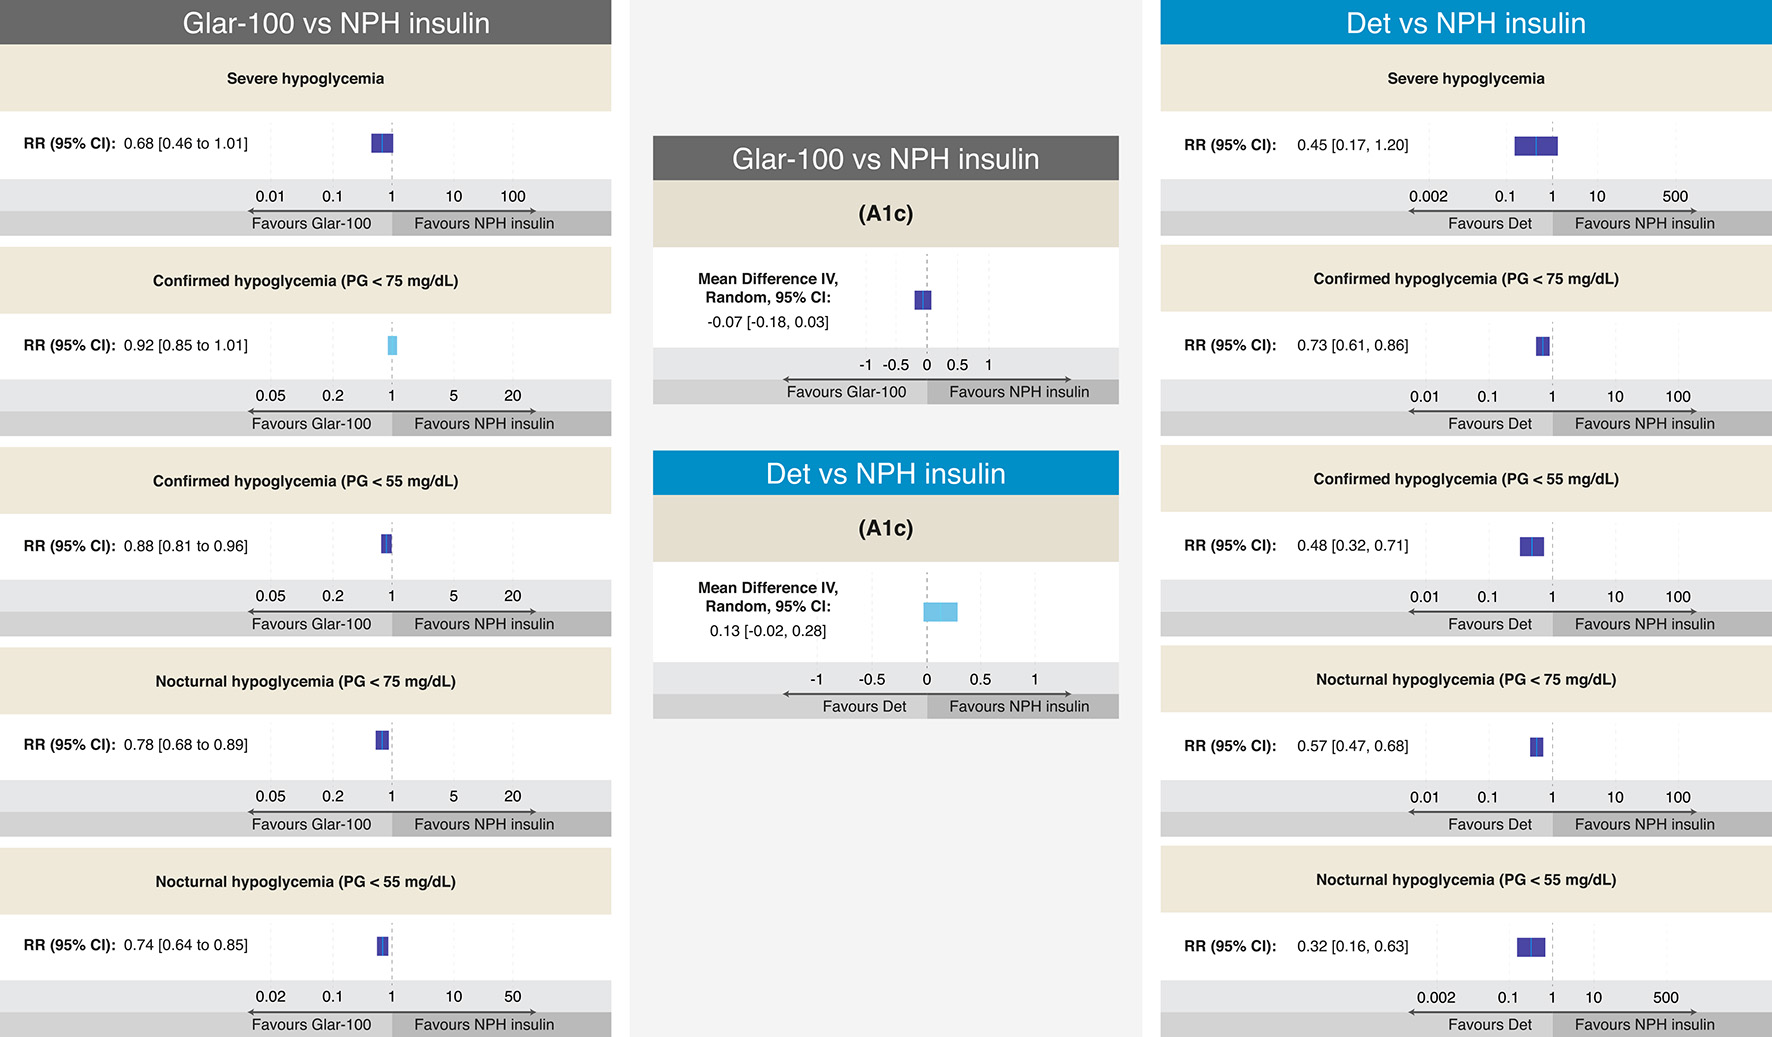
Figure 5. Efficacy and results on different definitions of hypoglycemia from RCTs comparing Glar-100 vs. NPH and Det vs. NPH in T2DM. The figure summarizes the different results of the RCTs that evaluated the safety and efficacy of Glar-100 vs. NPH (data extracted and adapted from Refs. [54] and [55]) and Det vs. NPH (data extracted and adapted from Refs. [40], [43], and [55]). Studies comparing Glar-100 vs. NPH showed differences favoring Glar-100 in three aspects: confirmed hypoglycemia (PG < 55 mg/dL), nocturnal hypoglycemia (PG < 75 mg/dL) and nocturnal hypoglycemia (PG < 55 mg/dL). On the other hand, the studies that compared Det vs. NPH showed differences, favoring Det in four aspects: confirmed hypoglycemia (PG < 75 mg/dL and < 55 mg/dL), nocturnal hypoglycemia (PG < 75 mg/dL and < 55 mg/dL). No differences were found in the A1c value between Glar-100 vs. NPH or between Det vs. NPH. CI: confidence interval; Det: detemir; Glar: glargine; NPH: neutral protamine Hagedorn; PG: plasma glucosa; RCTs: randomized clinical trials; RR: risk ratio; T2DM: type 2 diabetes mellitus. Source: author’s elaboration.
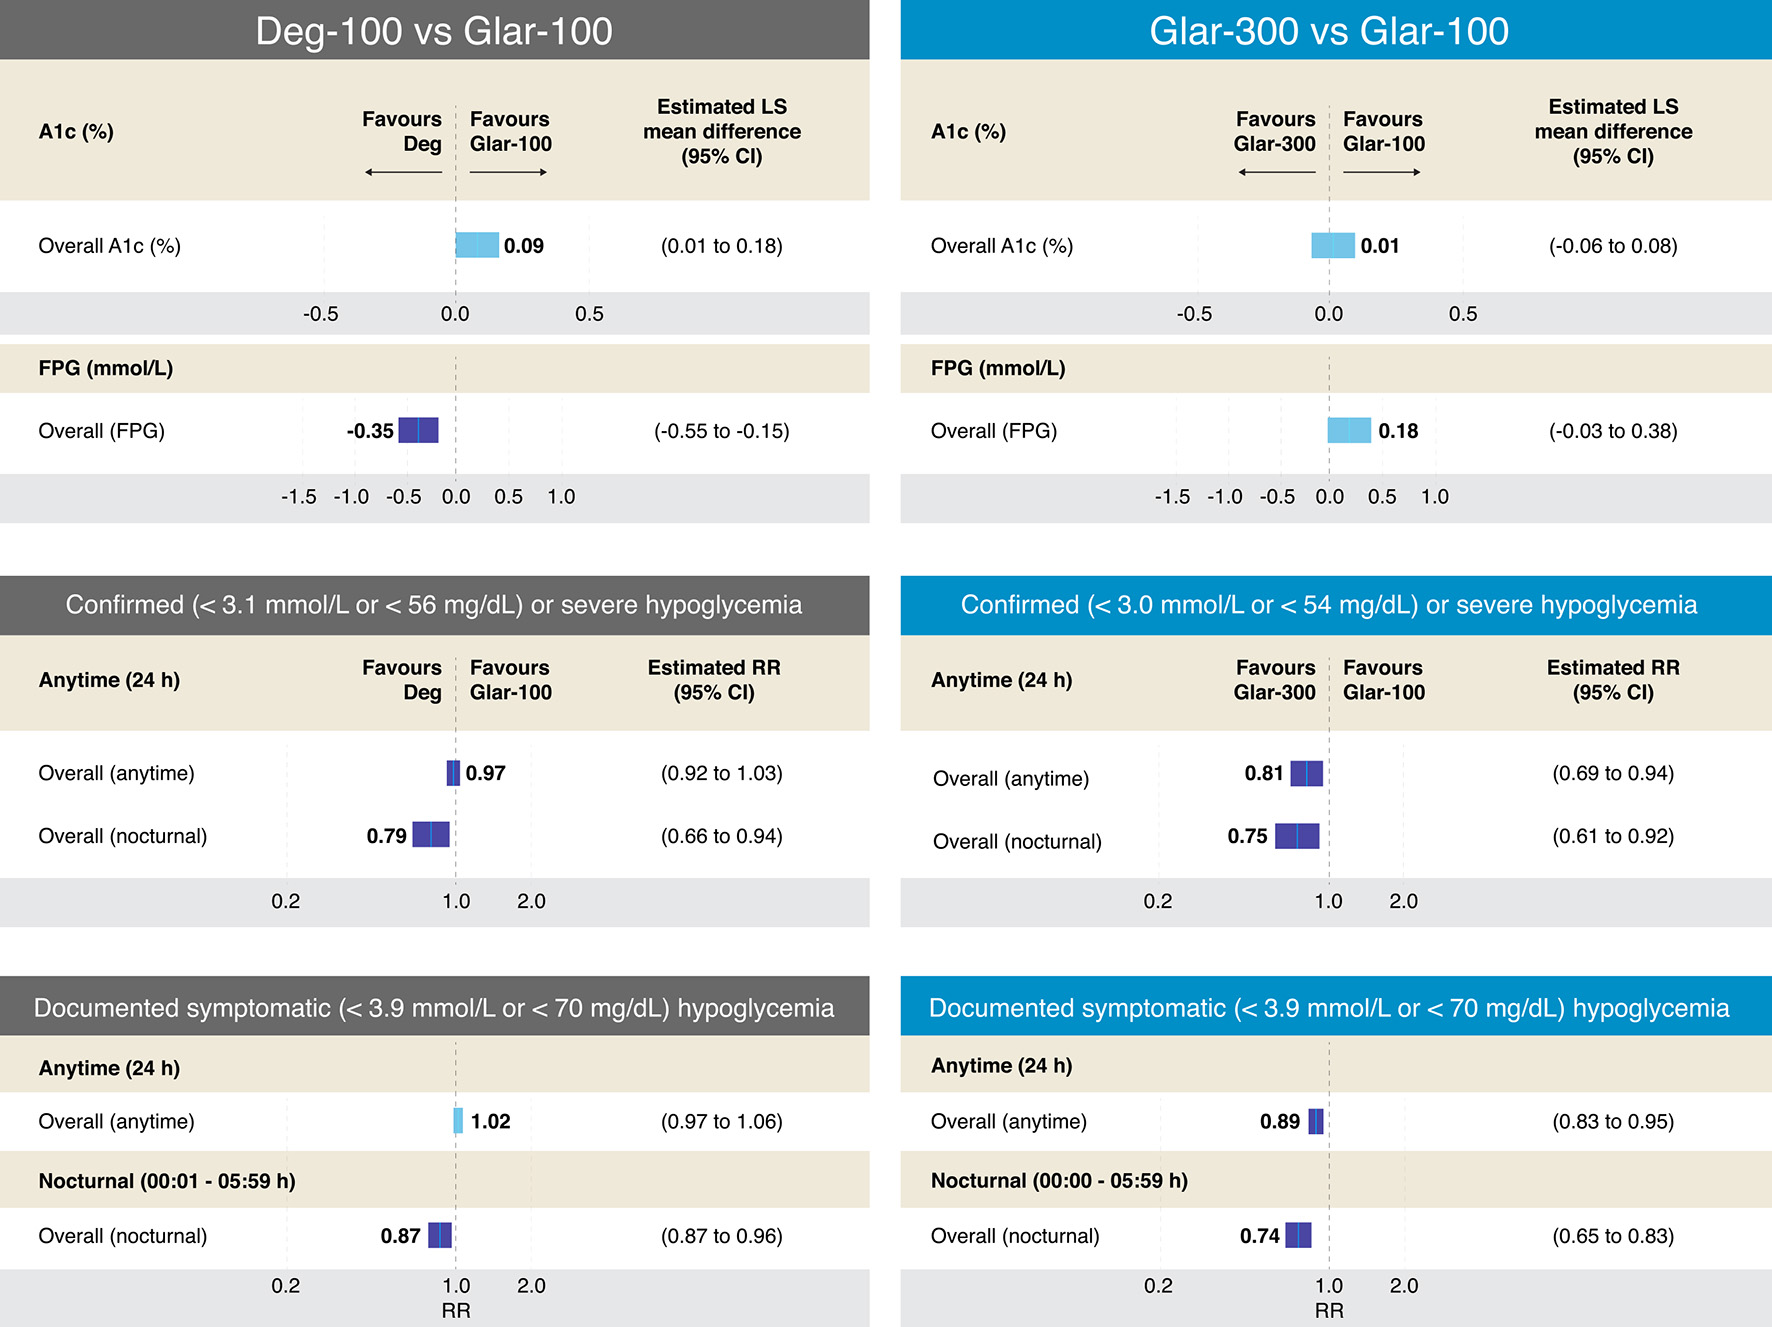
Figure 6. Efficacy and results on different definitions of hypoglycemia from RCTs comparing Deg-100 vs. Glar-100 and Glar-300 vs. Glar-100 in T2DM. The figure summarizes the different results of the RCTs that evaluated the safety and efficacy of Deg-100 vs. Glar-100 (data extracted and adapted from Refs. [57] and [58]) and Glar-300 vs. Glar-100 (data extracted and adapted from Refs. [58] and [59]). The studies that compared Deg-100 vs. Glar-100, showed differences in favor of Glar-100 on the A1c value, while the FPG value was significantly reduced with Deg-100. Differences in favor of Deg-100 were also found in two aspects: confirmed or severe hypoglycemia and documented symptomatic (overall and nocturnal (PG < 56 mg/dL and < 70 mg/dL, respectively). On the other hand, the studies that compared Glar-300 vs. Glar-100 found no differences in the A1c value; however, differences were found in favor of Glar-300 in four aspects: confirmed severe hypoglycemia (< 54 mg/dL, overall (anytime) and overall (nocturnal)), and in documented symptomatic hypoglycemia (< 70 mg/dL, overall (anytime) and overall (nocturnal)). CI: confidence interval; Deg: degludec; FPG: fasting plasma glucosa; Glar: glargine; PG: plasma glucosa; RCTs: randomized clinical trials; RR: risk ratio; T2DM: type 2 diabetes mellitus. Source: author’s elaboration.
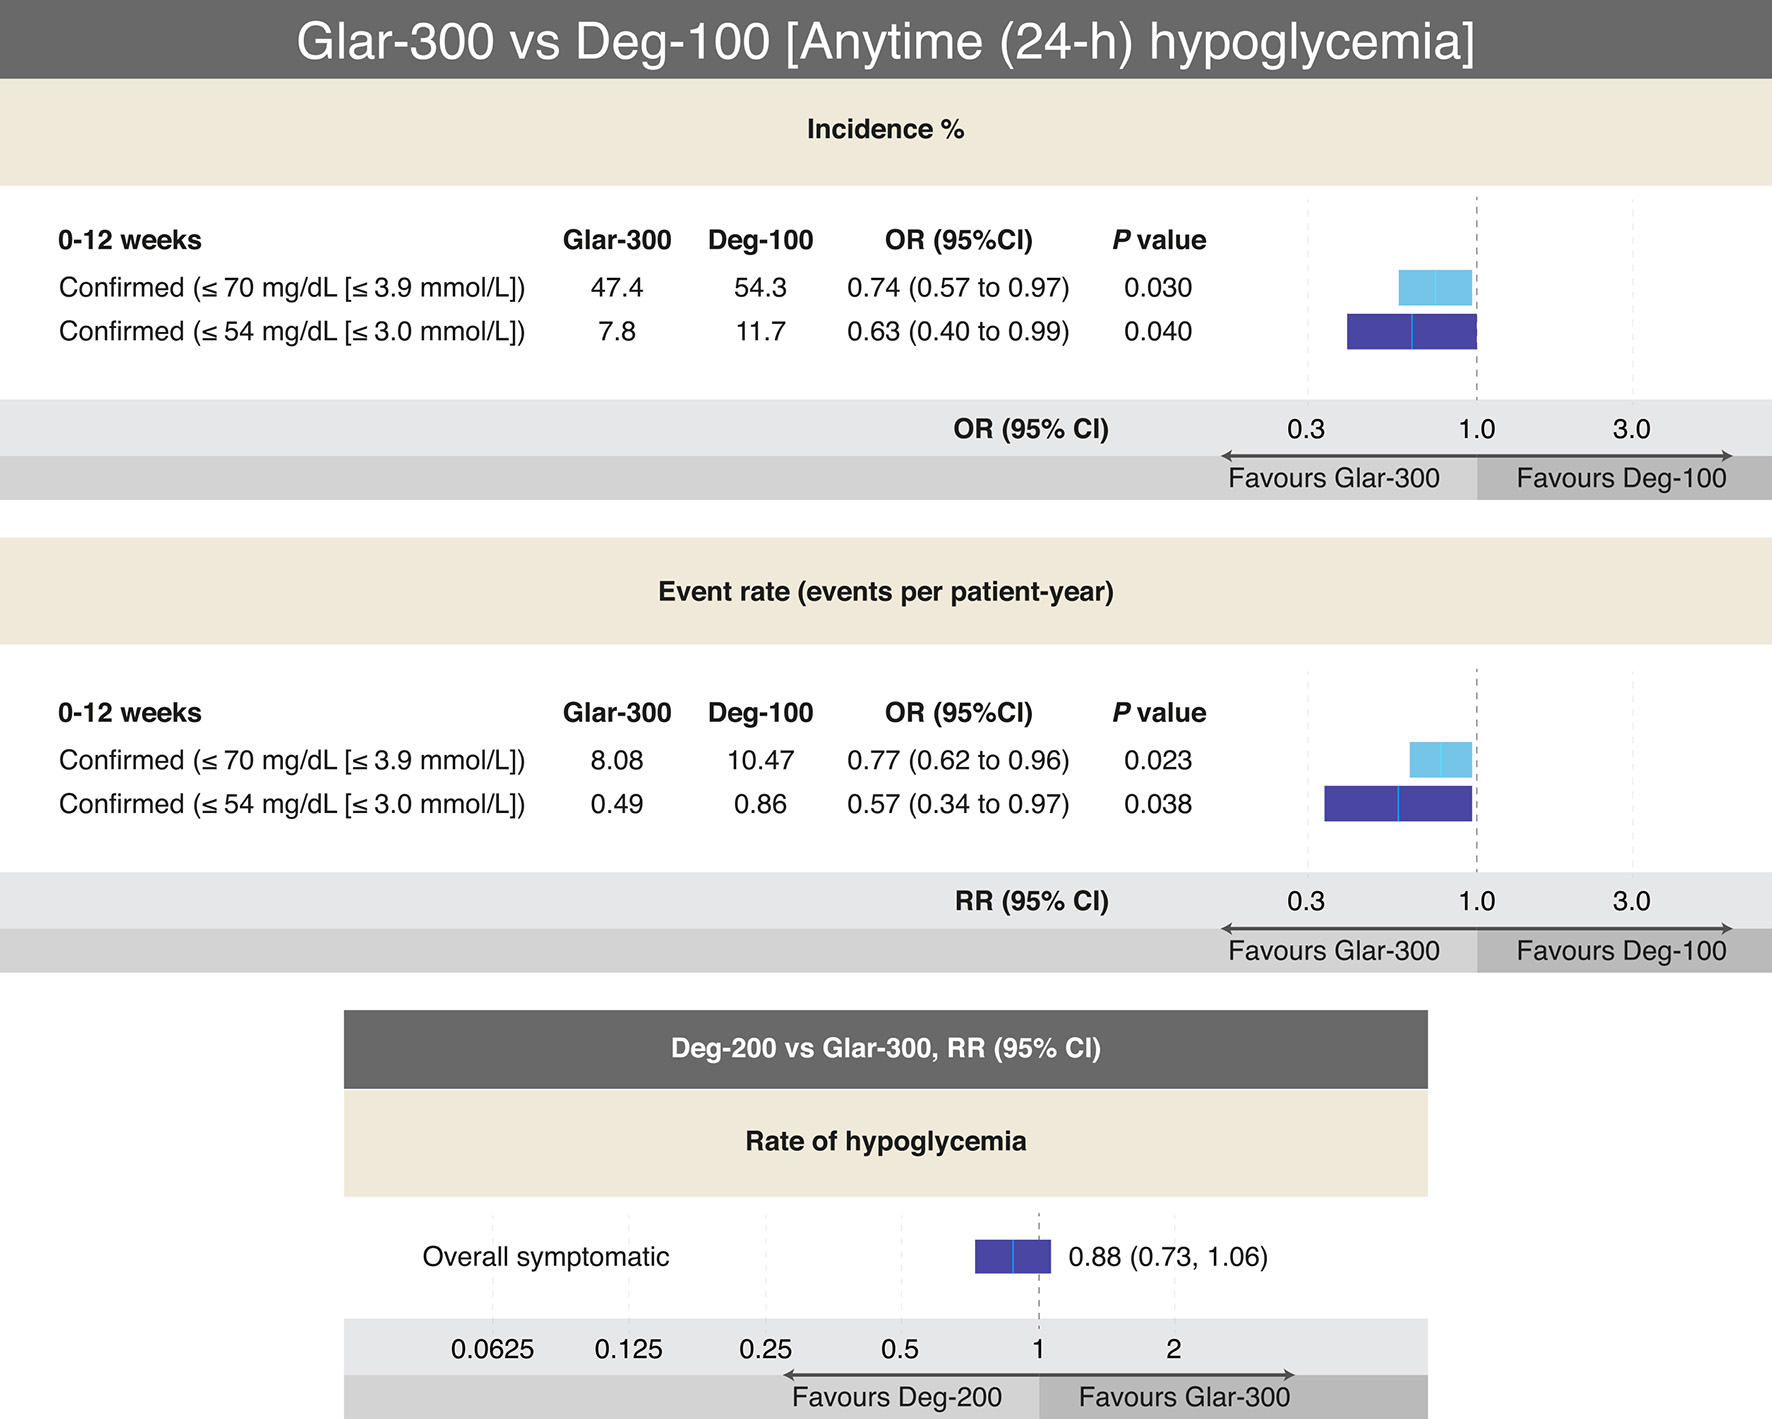
Figure 7. Outcomes on different definitions of hypoglycemia from RCTs comparing Glar-300 to Deg-100 and Deg-200 to Glar-300 in T2DM. The only head-to-head study that has compared Glar-300 vs. Deg-100, showed differences favoring Glar-300 on the risk of confirmed hypoglycemia (≤ 70 mg/dL and ≤ 54 mg/dL) only in the insulin titration period (0 - 12 weeks); data extracted and adapted from Refs. [58] and [60]. On the other hand, the only head-to-head study that compared Deg-200 vs. Glar-300 found no difference in the risk of overall hypoglycemia (data extracted and modified from Refs. [61] and [62]). In both studies no differences were found on the A1c value. CI: confidence interval; Deg: degludec; Glar: glargine; OR: odds ratio; RR: risk ratio; T2DM: type 2 diabetes mellitus. Source: author’s elaboration.
Tables
Table 1. Recommendations for Considering the Initiation of BI Therapy in T2DM
| AACE: American Association of Clinical Endocrinologists and American College of Endocrinology; ADA: American Diabetes Association; BI: basal insulin; C-peptide: connecting peptide; LADA: latent autoimmune diabetes in adults; OADs: oral antihyperglycemic agents; T2DM: type 2 diabetes mellitus. |
| Overall recommendations [26-28] |
| Deterioration of insulin secretion or phenotypical characteristics associated with early insulin requirement (LADA) or autoantibodies positive against any pancreatic islet component |
| Symptomatic hyperglycemia (weight loss, polyuria, polydipsia, polyphagia, tendency to ketosis) |
| Inability to increase C-peptide following glucagon stimulation |
| Inability to maintain acceptable glucose levels despite diet, exercise and maximum doses of ≥ 2 OADs, one of which must be an insulin secretion enhancer |
| Concomitant conditions or diseases (pancreatitis, pancreatic cancer, pancreatectomy, liver cirrhosis, chronic steroid therapy, anti-retroviral therapy, inter alia) |
| Patient preferences |
| Recommendations according to different international organizations |
| AACE, 2019 [27] |
| Individuals receiving dual or triple therapy and A1c ≥ 7.5%, or patients with A1c > 9.0% with associated symptoms |
| ADA, 2022 [26] |
| Individuals with evidence of weight loss, or in the presence of hyperglycemic symptoms, or when the A1c is > 10%, or when glycemia is ≥ 300 mg/dL |
| Diabetes Canada, 2018 [28] |
| Insulin may be used at any time in people not achieving glycemic targets while on noninsulin antihyperglycemic medication(s) |
Table 2. General Recommendations for Starting the BI Dose and for Adjusting When Switching From One Insulin to Another [30-32]
| Recommendations | Det | Glar-100 | Glar-300 | Deg-100 or 200 |
|---|
| BI: basal insulin; Deg: degludec; Det: detemir; FPG: fasting plasma glucose; Glar: glargine; NPH: neutral protamine Hagedorn; OD: once daily; U: units. |
| Starting dose for insulin-naive patients | 10 U or 0.1 - 0.2 U/kg, OD in the evening or twice daily | 10 U or 0.1 - 0.2 U/kg, OD | 10 U or 0.1 - 0.2 U/kg, OD | 10 U OD or 0.1 - 0.2 U/kg |
| Starting dose for insulin-naive patients | 10 U or 0.1 - 0.2 U/kg, OD in the evening or twice daily | 10 U or 0.1 - 0.2 U/kg, OD | 10 U or 0.1 - 0.2 U/kg, OD | 10 U OD or 0.1 - 0.2 U/kg |
| Adjustments and titration should be made according to blood glucose monitoring and metabolic needs | Adjust and titrate over 1 - 2 days | Adjust and titrate over 2 - 3 days | Adjust and titrate over 4 - 5 days | |
| Decrease 2 U if below FPG goal, 0 U if within FPG goal, and increase 2 units if above FPG goal | | | |
Table 3. PK and PD Characteristics of BIs [34-37]
| Characteristic | NPH | Det | Glar-100 | Glar-300 | Deg-100 and Deg-200 |
|---|
| BI: basal insulin; Deg: degludec; Det: detemir; Glar: glargine; NPH: neutral protamine Hagedorn; OD: once daily; PD: pharmacodynamic; PK: pharmacokinetic; TD: twice daily. |
| Peak (h) | 4 - 8 | 4 - 7 (relatively flat) | No pronounced | Close to peakless (flat) | Close to peakless (flat) |
| Duration of action (h) | 10 - 16 | ≤ 24 | Up to 24 | ≥ 24 to ≤ 36 | ≤ 42 |
| Half-life (h) | 4 | 5 - 7 | 12 - 14 | 23 | 25 |
| Dosing frequency | OD or TD | OD or TD | OD | OD | OD |
| Time to steady-state | Unknown | 1 to < 2 days | 2 - 3 days | 4 - 5 days | 4 - 5 days |
Table 4. Efficacy and Risk of Hypoglycemia From RCTs Comparing Det vs. Glar-100 in T2DM [40-43]
| Hypoglycemia, definition | Risk ratio or rate ratio or (95% CI) | Efficacy |
|---|
| Det vs. Glar-100 |
|---|
| CI: confidence interval; Det: detemir; Glar: glargine; NOP: number of participants; OR: odds ratio; RCTs: randomized clinical trials; T2DM: type 2 diabetes mellitus. |
| Participants having at least one hypoglycemic event (%) | Risk ratio: 0.98 (0.92 - 1.05) | For Det, the mean change in A1c was 0.07 higher. For Glar-100, the mean change in A1c ranged from -1.25% to -1.68% |
| Event rate for overall hypoglycemia per patient-year | Rate ratio: 1.00 (0.90 - 1.11) | |
| Percentage of participants having at least one nocturnal hypoglycemic event | Risk ratio: 1.02 (0.90 - 1.16) | |
| Event rate for nocturnal hypoglycemia per patient-year | Rate ratio: 1.00 (0.93 - 1.09) | |
| Percentage of participants having at least one severe hypoglycemic event | Risk ratio: 0.82 (0.51 - 1.32) | |
| Event rate for severe hypoglycemia per patient-year | Rate ratio: 0.88 (0.59 - 1.30) | |
| Nocturnal hypoglycemia | OR: 1.03 (0.88 - 1.21) | |
Table 5. Effects on Body Weight and Differences in the Average Dose of the Different BIs in T2DM
| Comparison | Weight gain |
|---|
| BI: basal insulin; Deg: degludec; Det: detemir; Glar: glargine; NPH: neutral protamine Hagedorn; OAD: oral antihyperglycemic drug; T2DM: type 2 diabetes mellitus. |
| Glar-100 vs. NPH [39, 40] | No differences in weight gain with both insulins |
| Glar-100 vs. Det [56, 57] | The mean difference was -0.91 kg (95% CI -1.21 to -0.61), favors Det |
| Det vs. NPH [38-40] | Less weight gain was consistently across the BI + bolus, and BI + OADs combination therapy studies, favors Det |
| Deg-100 vs. Glar-100 [57, 58] | No differences in weight gain with both insulins |
| Glar-300 vs. Glar-100 [59] | Less weight gain was consistent across the BI + OADs combination therapy studies, favors Glar-300 |
| Glar-300 vs. Deg-100 [60] | No differences in weight gain with both insulins |
| Glar-300 vs. Deg-200 [61] | No differences in weight gain with both insulins |