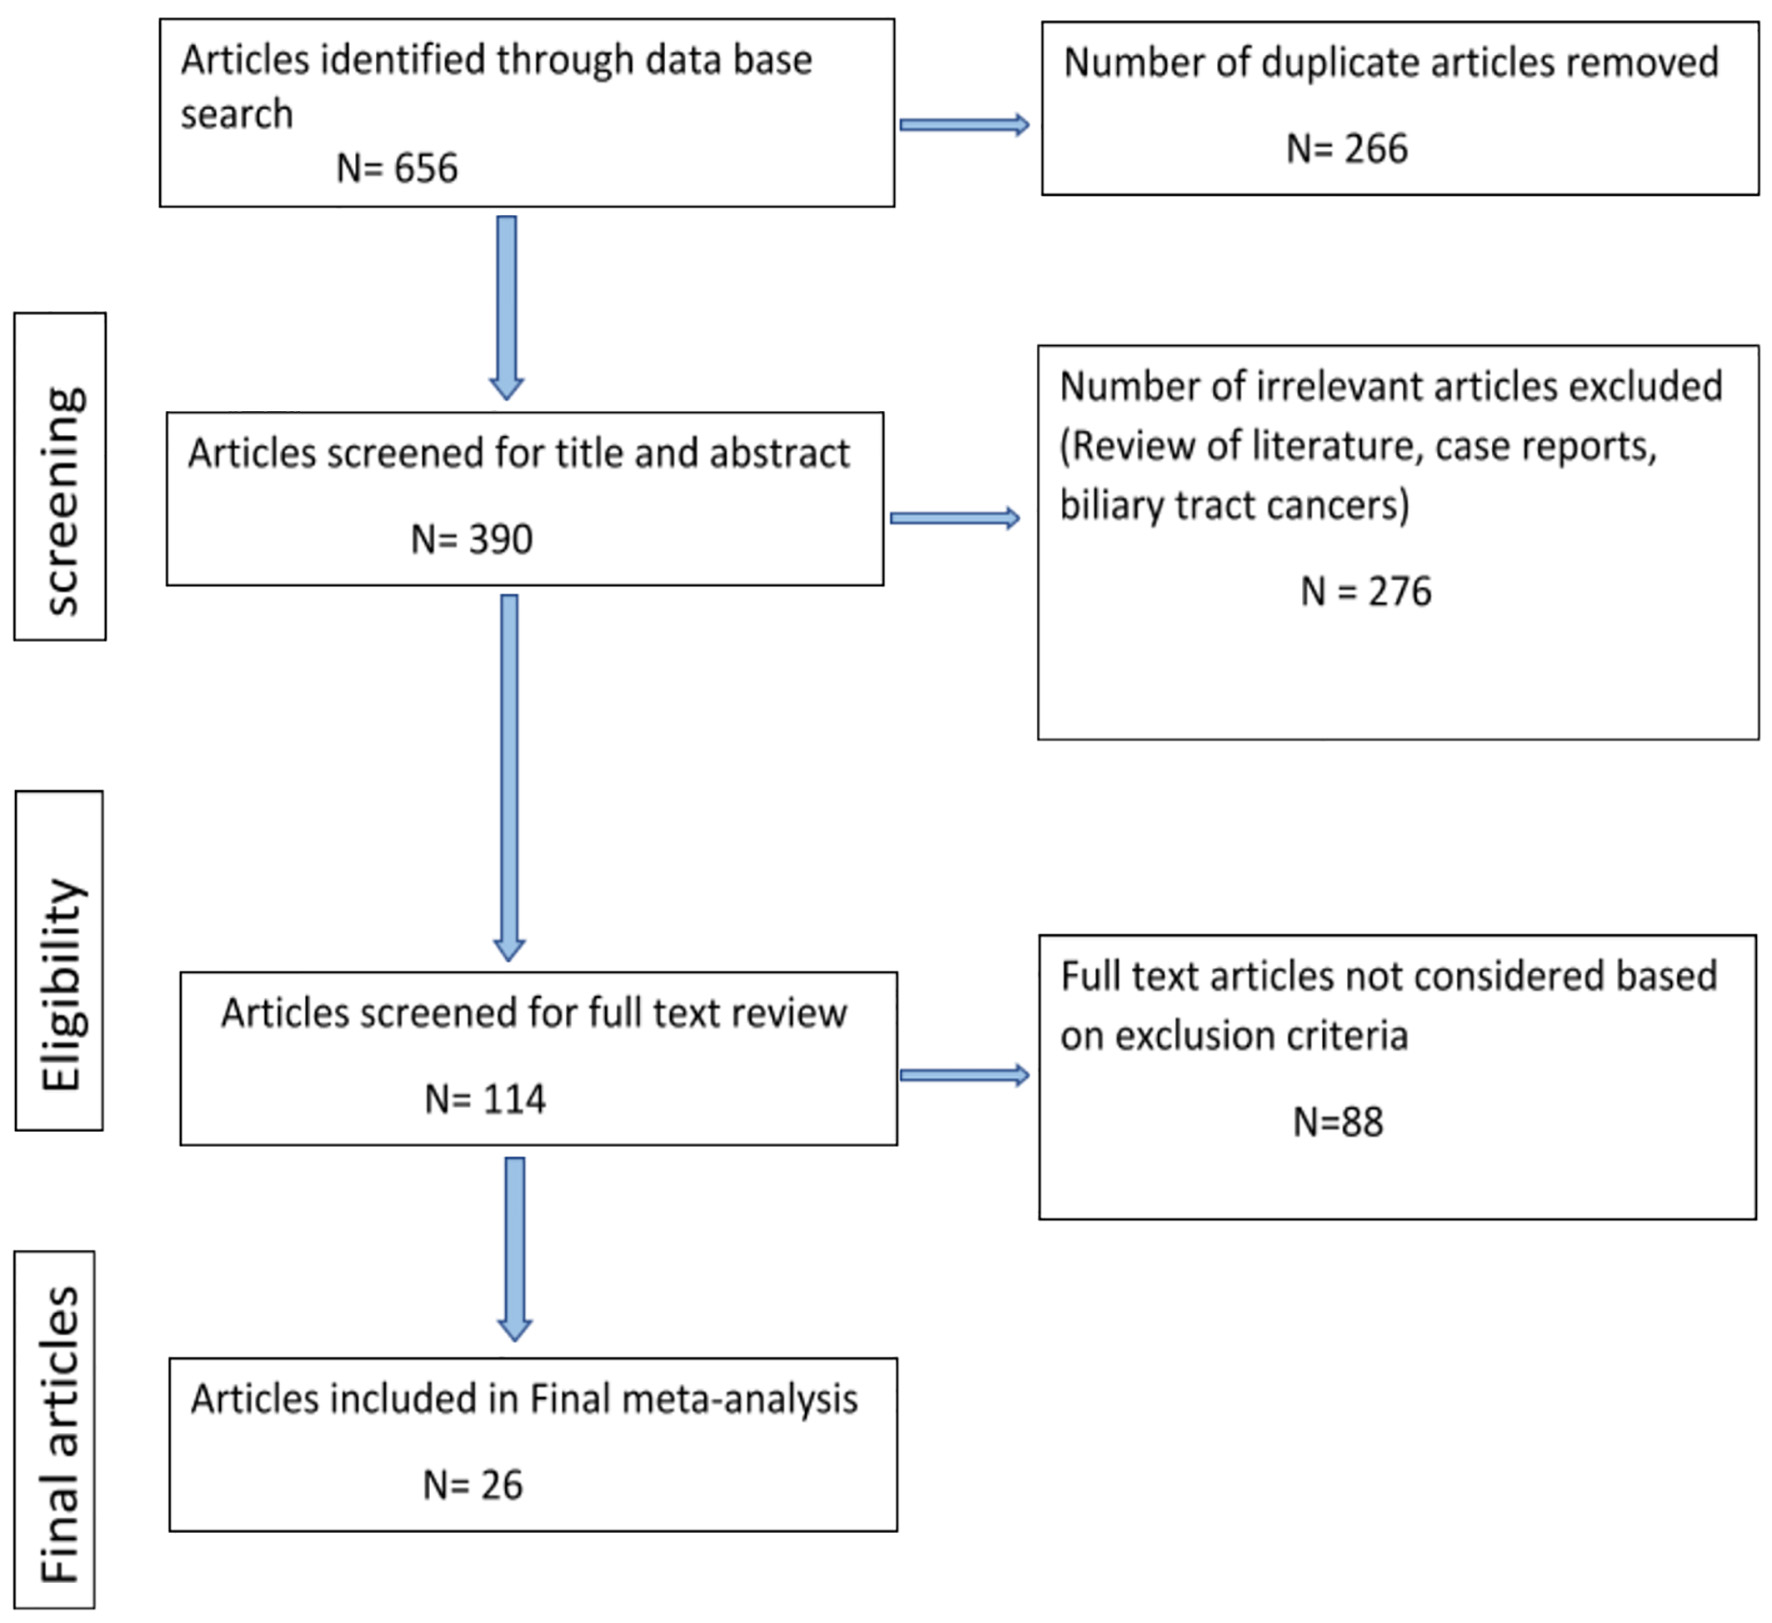
Figure 1. Flowchart of the articles selected from literature search.
| Journal of Clinical Medicine Research, ISSN 1918-3003 print, 1918-3011 online, Open Access |
| Article copyright, the authors; Journal compilation copyright, J Clin Med Res and Elmer Press Inc |
| Journal website https://www.jocmr.org |
Original Article
Volume 13, Number 12, December 2021, pages 530-540
Coinfection of Helicobacter pylori and Hepatitis C Virus in the Development of Hepatocellular Carcinoma: A Systematic Review and Meta-Analysis
Figures
Tables
| HCC positive (cases) | HCC negative (controls) | Random-effect odds ratio (95% confidence interval) | |
|---|---|---|---|
| HCC: hepatocellular carcinoma; HCV: hepatitis C virus; H. pylori: Helicobacter pylori. | |||
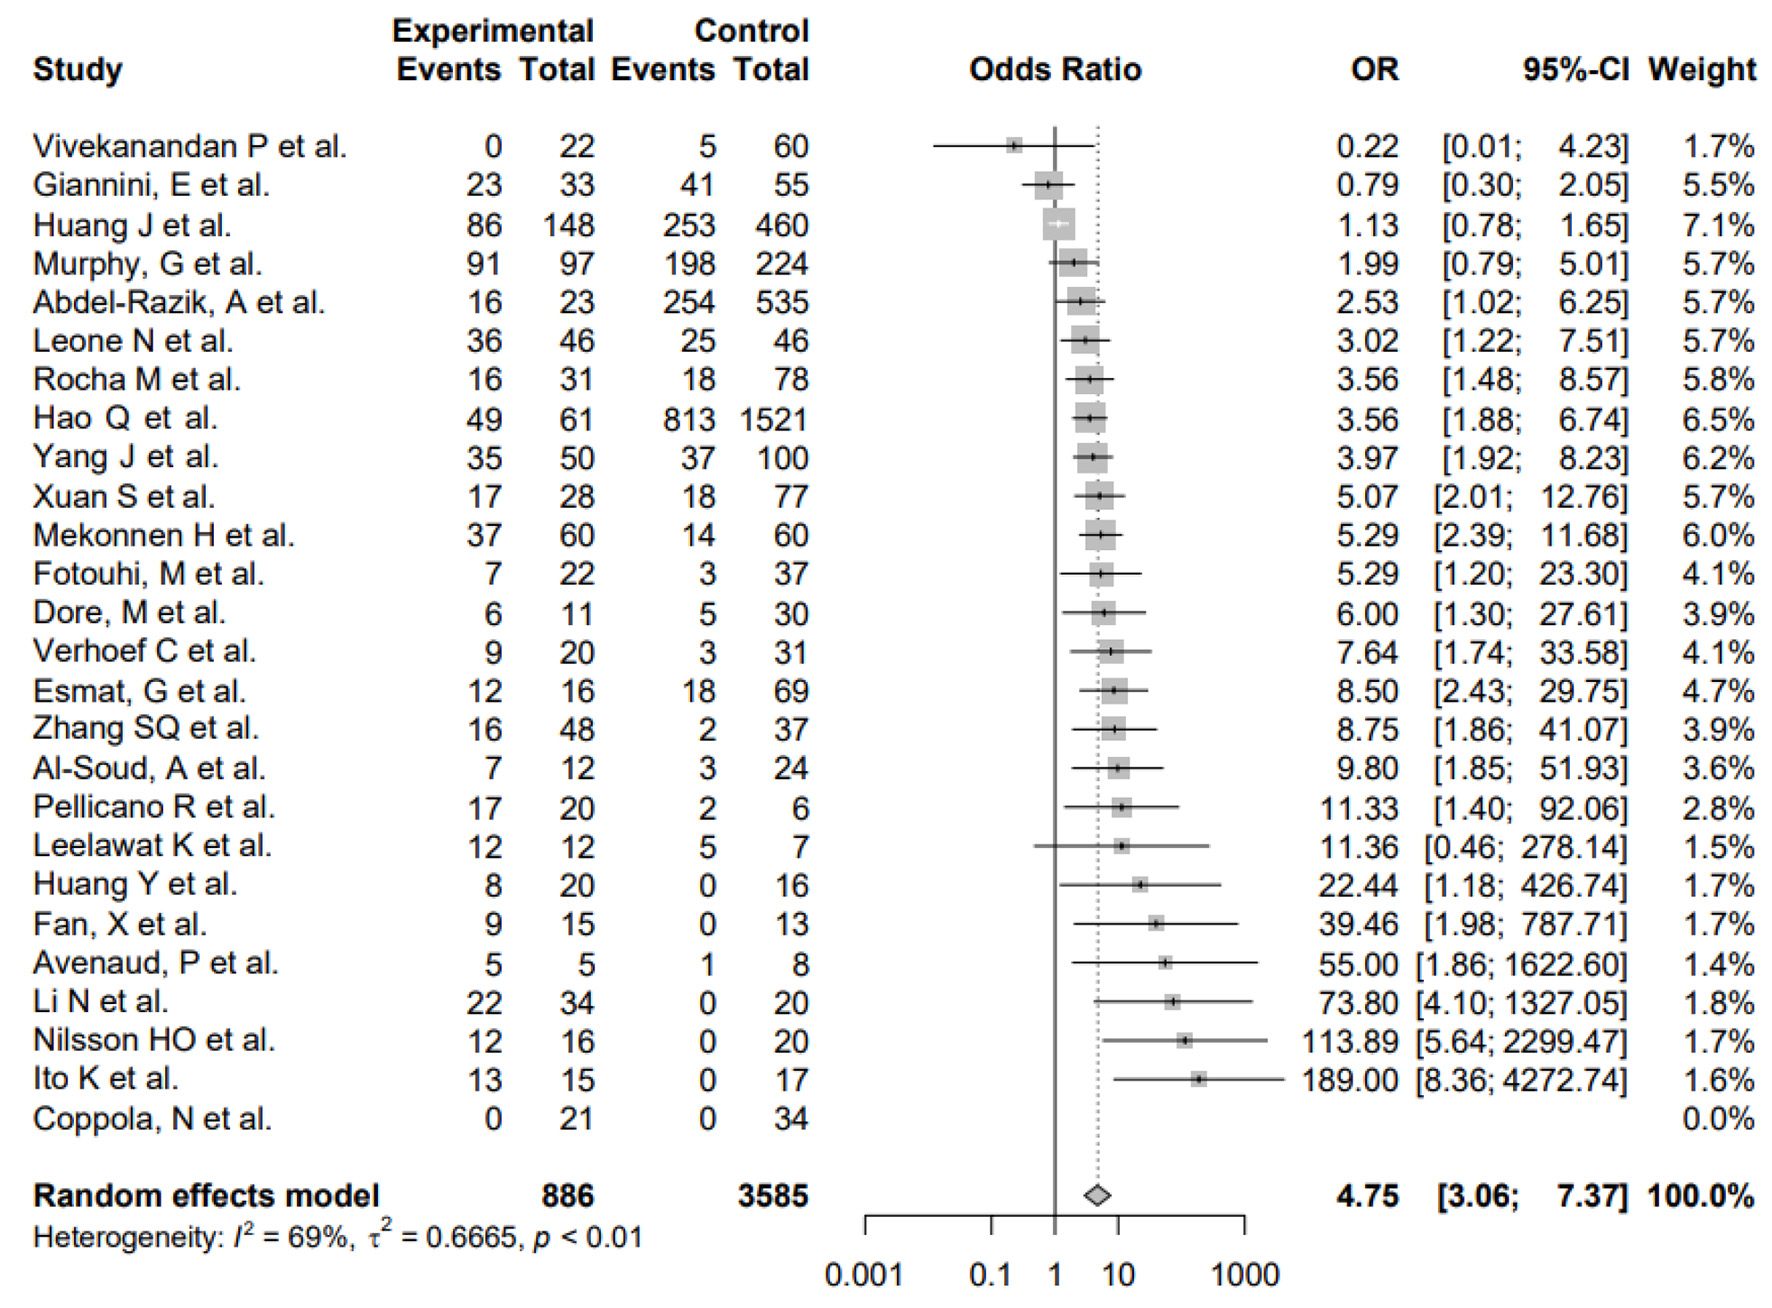
| Primary analysis | |||
| Relationship between H. pylori and HCC | 561/866 (64.78%) | 1,718/3,585 (47.92%) | 4.75 (3.06 - 7.37) |
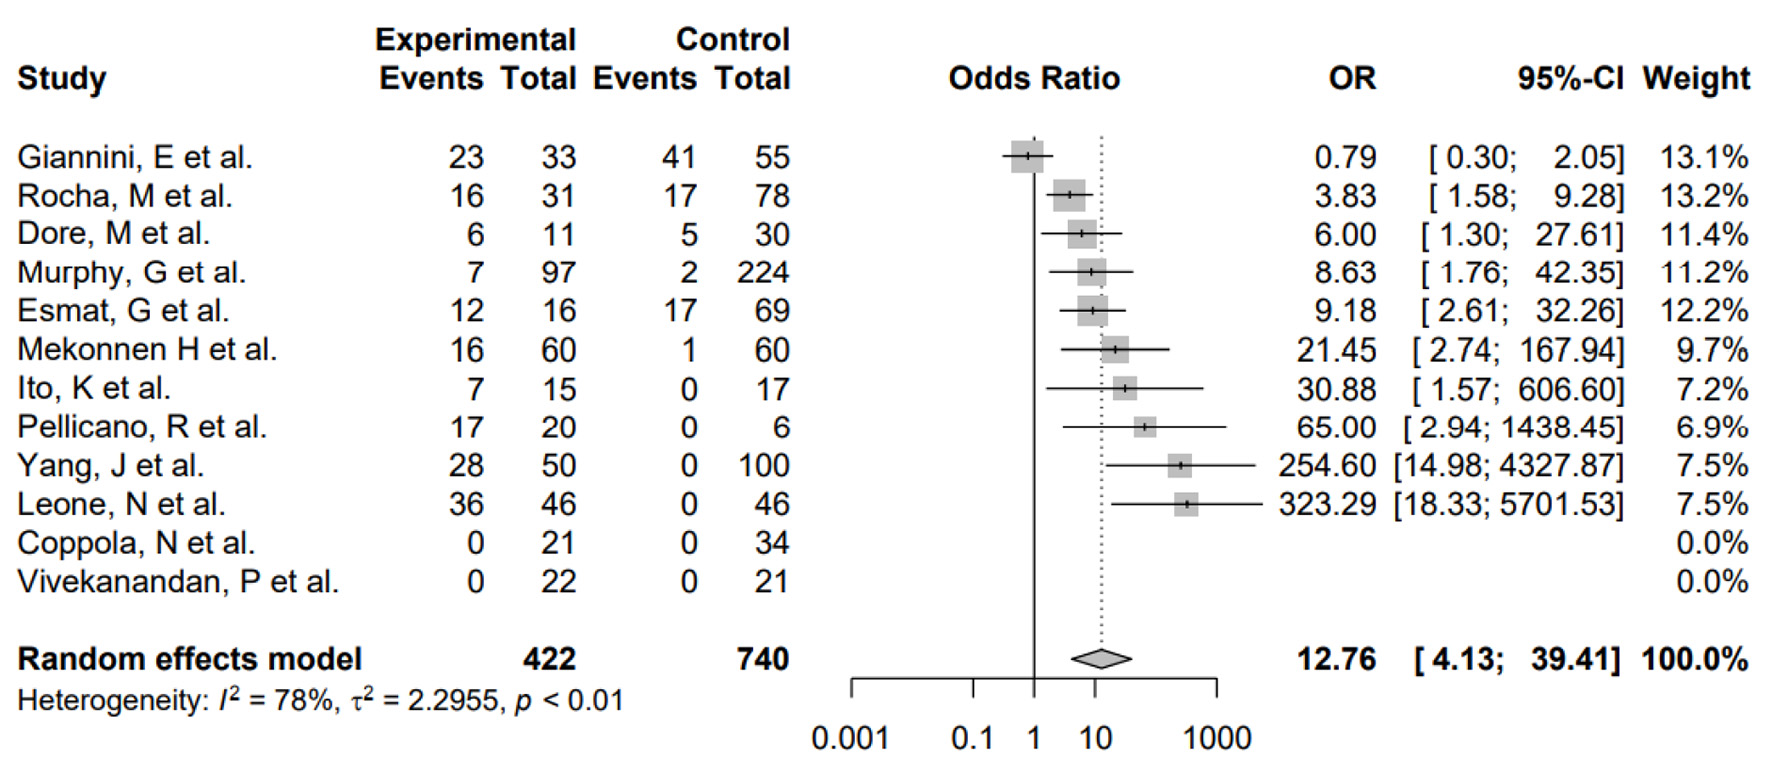
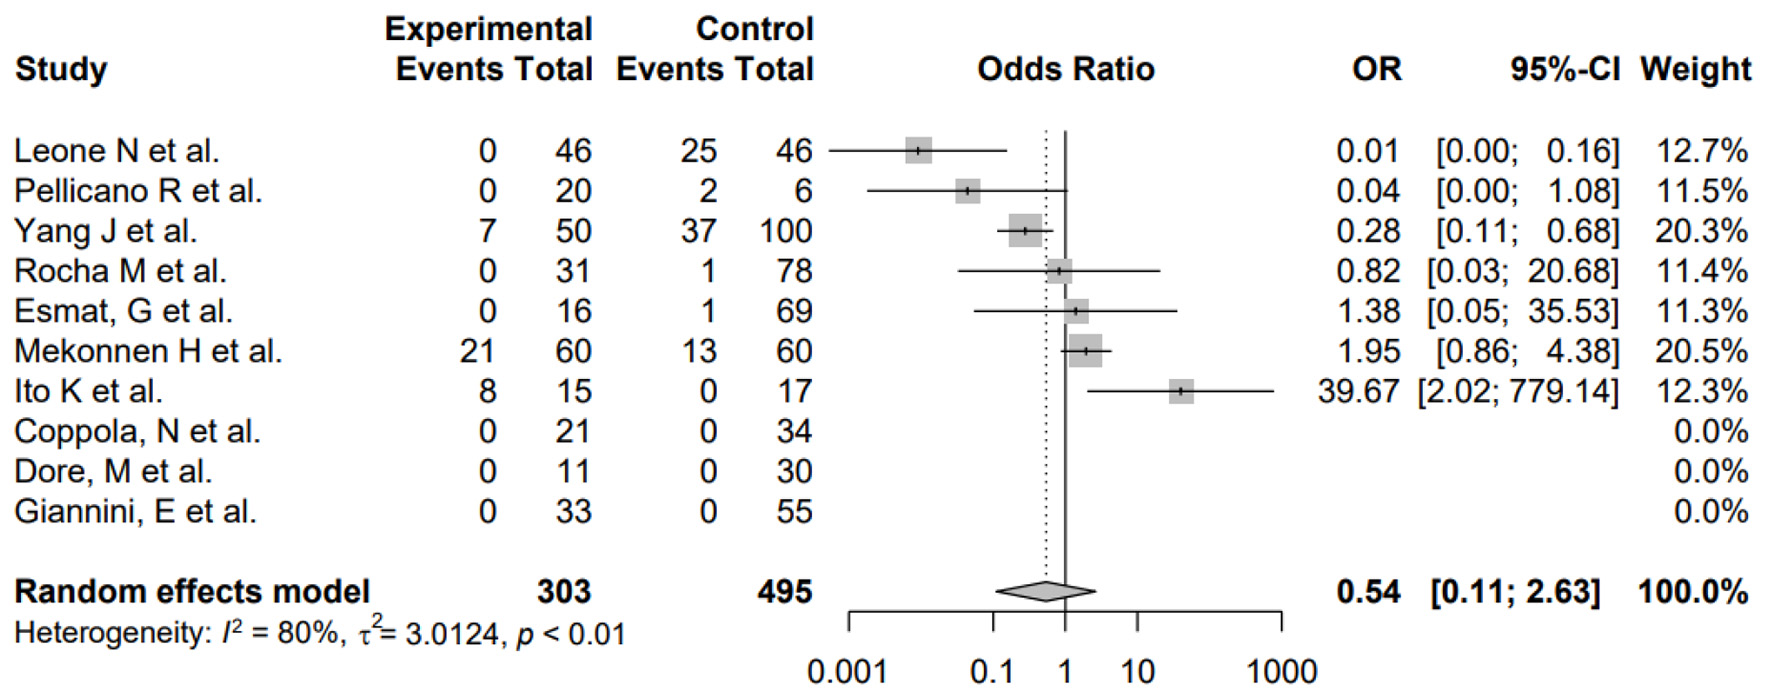
| Subgroup analysis | |||
| H. pylori and HCV coinfection | 168/422 (39.81%) | 83/740 (11.21%) | 12.76 (4.13 - 39.41) |
| H. pylori infection only without HCV | 36/303 (11.88%) | 79/495 (15.95%) | 0.54 (0.11 - 2.63) |
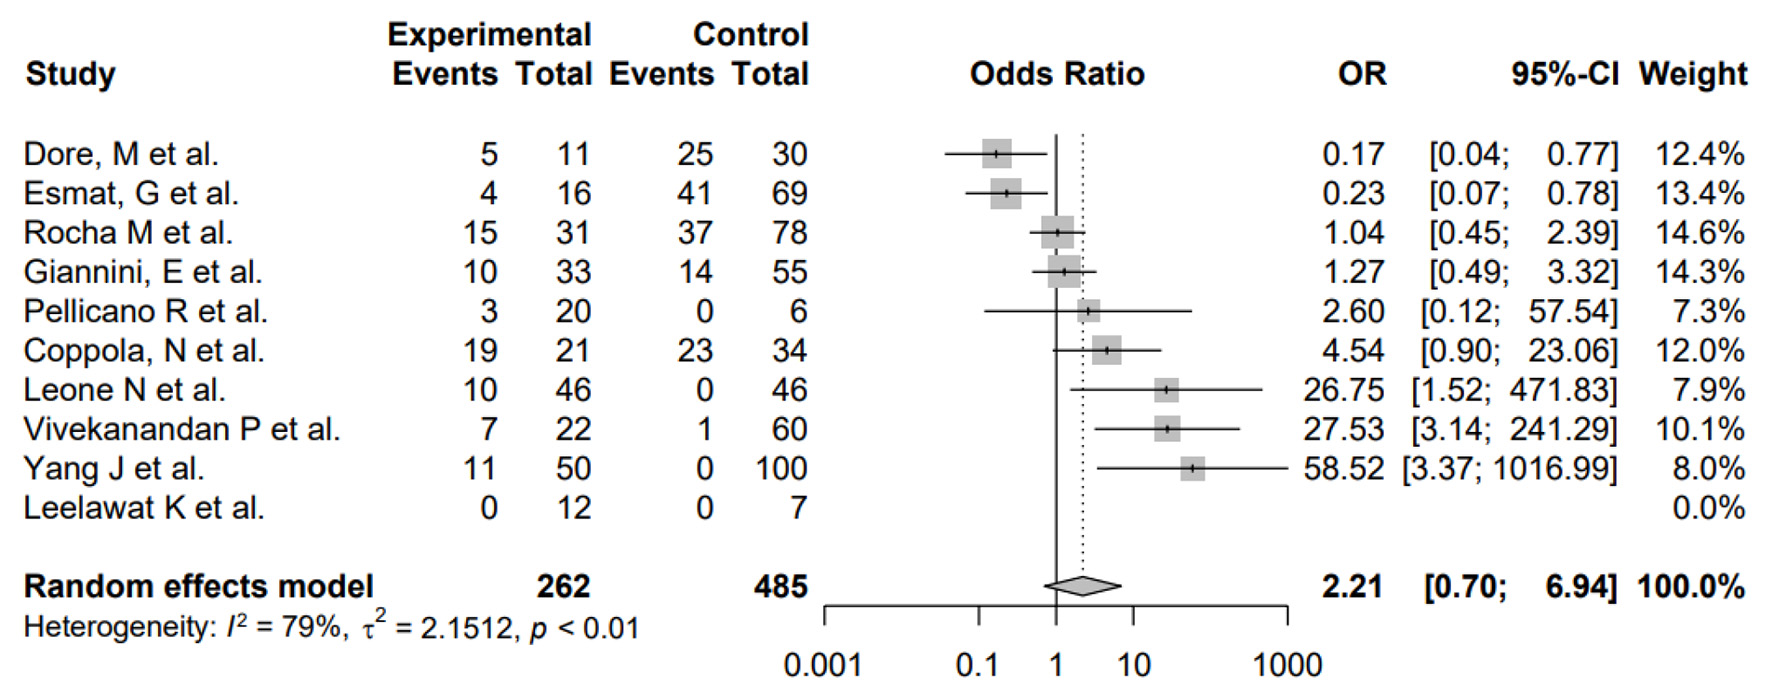
| HCV only without H. pylori | 84/262 (32.06%) | 141/485 (29.07%) | 2.21 (0.70 - 6.94) |
| Study authors | Year of publication | Nature of the study | H. pylori positive | Mean age | ||
|---|---|---|---|---|---|---|
| Cases | Controls | Cases | Controls | |||
| H. pylori: Helicobacter pylori. | ||||||
| Abdel-Razik et al [22] | 2020 | Prospective cohort | 16/23 | 254/535 | 55 | 55 |
| Al-Soud et al [26] | 2008 | Retrospective | 7/12 | 3/24 | 63 | 36.5 |
| Avenaud et al [27] | 2000 | Retrospective | 5/5 | 1/8 | 67.6 | 45.25 |
| Coppola et al [23] | 2003 | Retrospective | 0/21 | 0/34 | 68 | 60.5 |
| Dore et al [28] | 2002 | Retrospective | 6/11 | 5/30 | 65.2 ± 8.8 | 51.2 ± 15 |
| Esmat et al [29] | 2012 | Retrospective | 12/16 | 18/69 | N/A | N/A |
| Fan et al [30] | 2002 | Retrospective | 9/15 | 0/13 | 48.5 | N/A |
| Fotouhi et al [31] | 2011 | Retrospective | 7/22 | 3/37 | N/A | N/A |
| Giannini et al [19] | 2003 | Retrospective | 23/33 | 41/55 | 64.6 ± 9 | 55 |
| Qu et al [20] | 2017 | Case-control | 49/61 | 813/1,521 | 35.3 ± 15.7 | 36.6 ± 14.5 |
| Huang and Cui [32] | 2017 | Retrospective | 86/148 | 253/460 | 52.4 ± 11.6 | 53.7 |
| Huang et al [33] | 2004 | Retrospective | 8/20 | 0/16 | 42 | 36 |
| Ito et al [34] | 2004 | Retrospective | 13/15 | 0/17 | 59.2 | N/A |
| Leelawat et al [35] | 2007 | Retrospective | 12/12 | 5/7 | 54 | 59 |
| Leone et al [21] | 2003 | Case-control | 36/46 | 25/46 | 60 | 69 |
| Rocha et al [36] | 2005 | Cross sectional | 16/31 | 18/78 | 57.8 | 49 |
| Mekonnen et al [37] | 2018 | Prospective case-control | 37/60 | 14/60 | 36 | 51 |
| Murphy et al [38] | 2014 | Case-control | 91/97 | 198/224 | 58 | 57 |
| Pellicano et al [25] | 2004 | Cross-sectional | 17/20 | 2/6 | N/A | N/A |
| Verhoef et al [39] | 2003 | Cross-sectional | 9/20 | 3/31 | 61 | 62 |
| Vivekanandan et al [24] | 2008 | Retrospective | 0/22 | 5/60 | 52.8 ± 14 | N/A |
| Xuan et al [17] | 2006 | Cross-sectional | 17/28 | 18/77 | N/A | N/A |
| Yang et al [18] | 2013 | Cross-sectional | 35/50 | 37/100 | 56.9 ± 9.5 | 54.8 ± 11.4 |
| Nilsson et al [40] | 2001 | Cross-sectional | 12/16 | 0/20 | N/A | N/A |
| Zhang et al [41] | 2004 | Cross-sectional | 16/48 | 2/37 | N/A | N/A |
| Li et al [42] | 2006 | Cross-sectional | 22/34 | 0/20 | N/A | N/A |