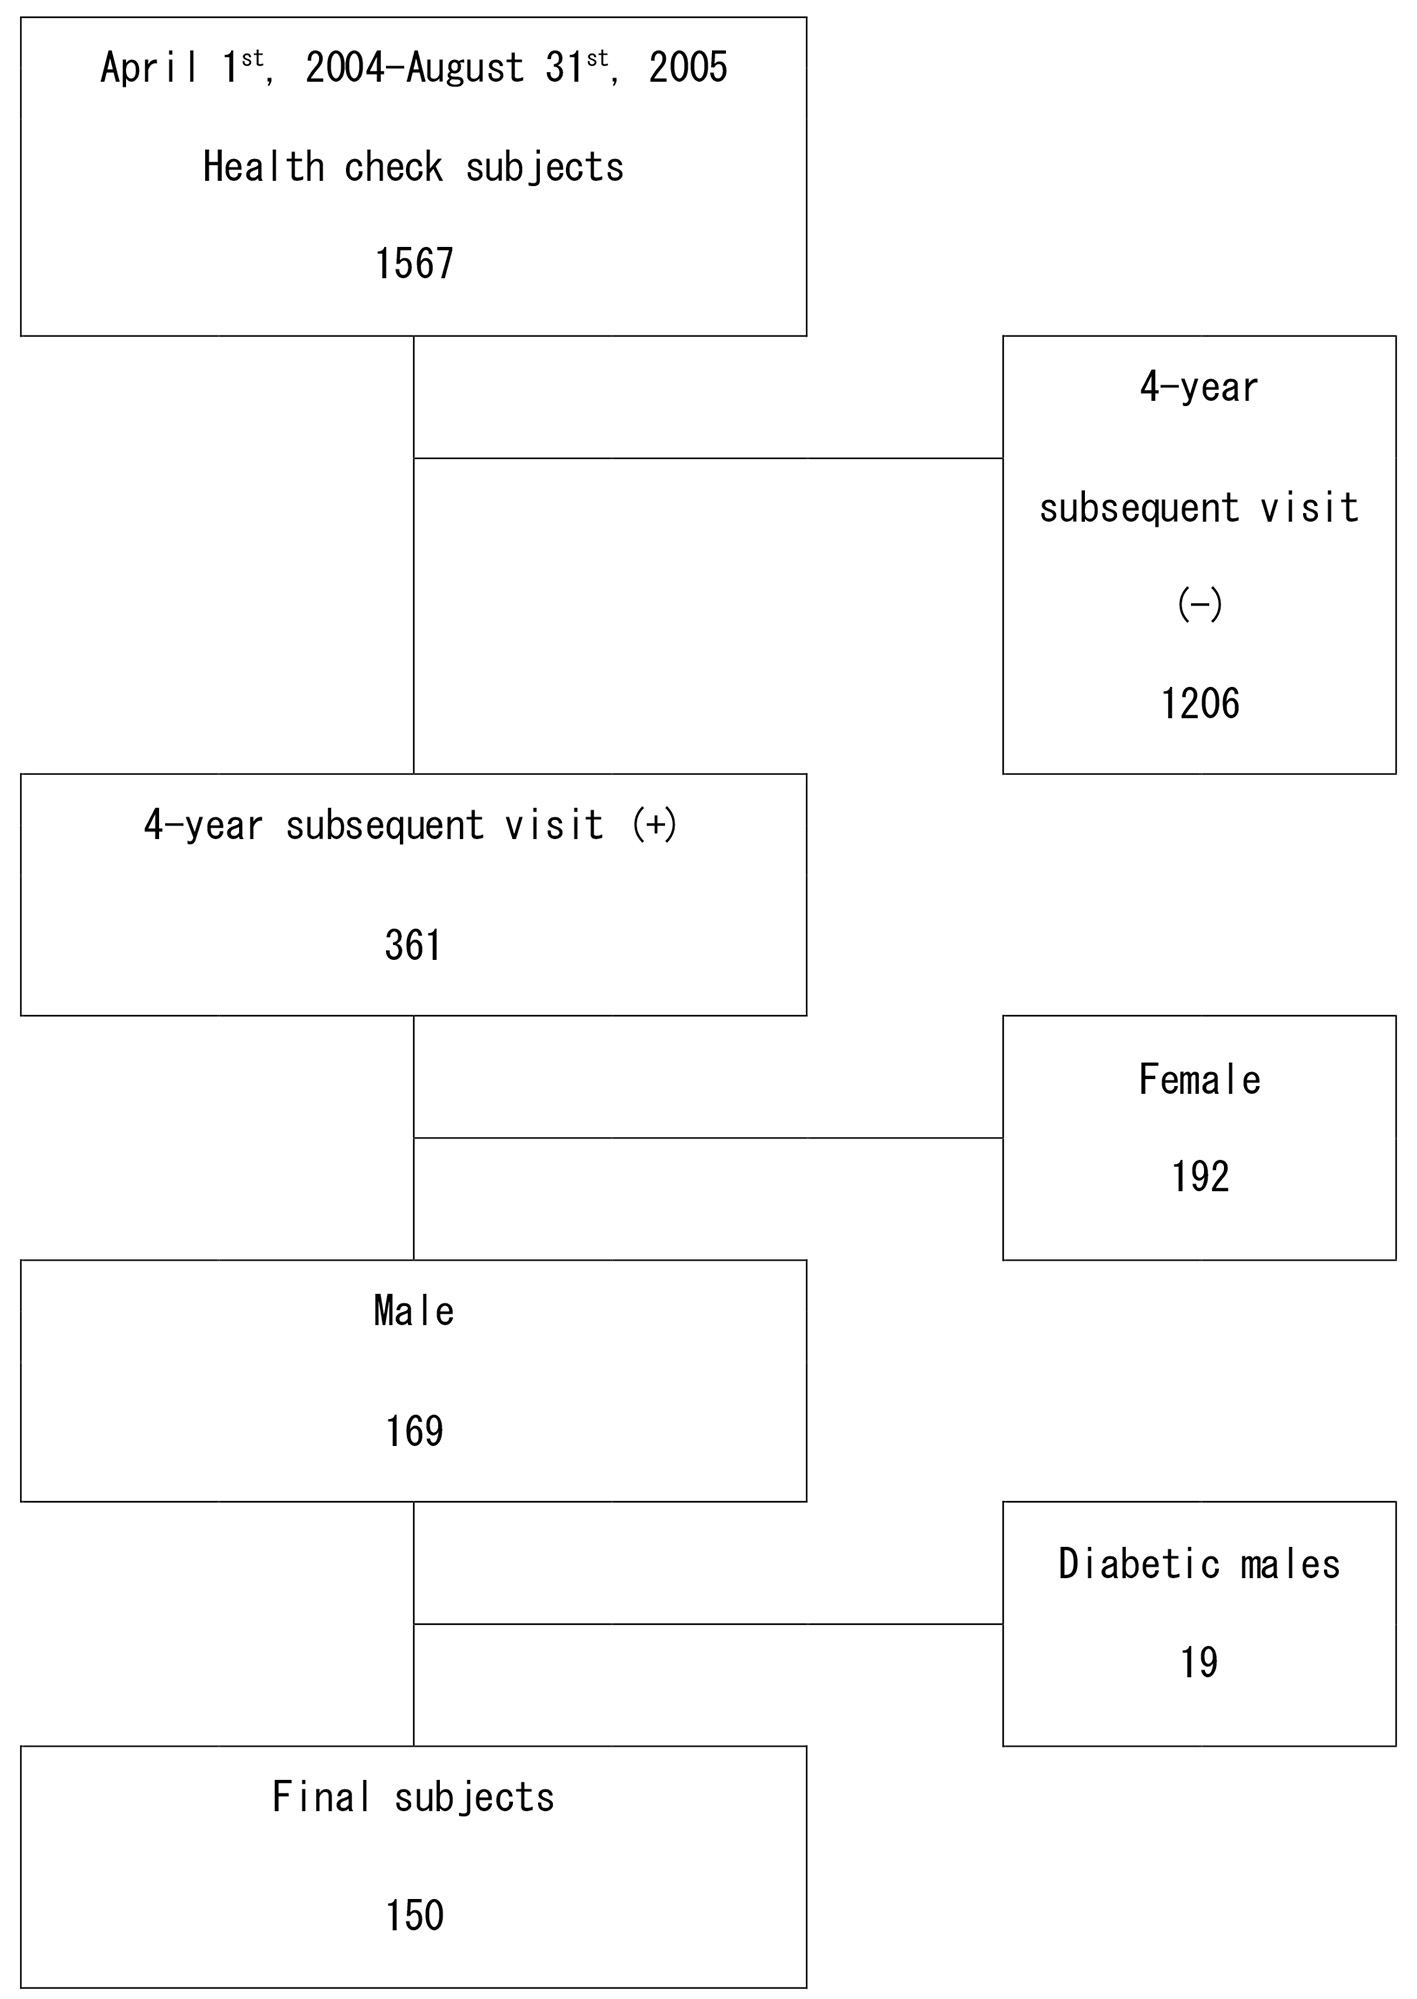
Figure 1. Flow diagram of selection of the subjects at baseline.
| Journal of Clinical Medicine Research, ISSN 1918-3003 print, 1918-3011 online, Open Access |
| Article copyright, the authors; Journal compilation copyright, J Clin Med Res and Elmer Press Inc |
| Journal website https://www.jocmr.org |
Original Article
Volume 13, Number 12, December 2021, pages 541-548
Hyperferritinemia Is a Predictor of Onset of Diabetes in Japanese Males Independently of Decreased Renal Function and Fatty Liver: A Fifteen-Year Follow-Up Study
Figures
Tables
| Parameter | Total | Incident T2D | P value | |
|---|---|---|---|---|
| No | Yes | |||
| Values are means ± SD. T2D: type 2 diabetes; SD: standard deviation; FPG: fasting plasma glucose; PPG: postprandial glucose; HbA1c: hemoglobin A1c; IRI: immunoreactive insulin; CPR: C-peptide immunoreactivity; eGFR: estimated glomerular filtration rate. HOMA-R = FPG × IRI/405; HOMA-β = IRI × 360/(FPG - 63). | ||||
| N | 150 | 122 | 28 | |
| Age (years) | 53.6 ± 8.3 | 53.4 ± 8.4 | 54.6 ± 8.1 | 0.492 |
| Obesity, n (%) | 54 (36%) | 35 (29%) | 19 (68%) | < 0.001 |
| Hypertension, n (%) | 19 (13%) | 14 (11%) | 5 (18%) | 0.354 |
| Dyslipidemia, n (%) | 78 (52%) | 59 (48%) | 19 (68%) | 0.092 |
| Smoking habit, n (%) | 62 (41%) | 49 (40%) | 13 (46%) | 0.671 |
| FPG (mg/dL) | 97.3 ± 8.6 | 95.4 ± 7.3 | 105.6 ± 9.2 | < 0.001 |
| PPG (mg/dL) | 143.7 ± 28.2 | 140.5 ± 27.9 | 157.9 ± 25.1 | 0.003 |
| HbA1c (%) | 5.71 ± 0.35 | 5.64 ± 0.34 | 6.01 ± 0.21 | < 0.001 |
| HOMA-R | 1.28 ± 0.81 | 1.13 ± 0.73 | 1.92 ± 0.82 | < 0.001 |
| HOMA-β | 54.0 ± 24.8 | 52.2 ± 24.5 | 62.1 ± 25.1 | 0.057 |
| IRI (µU/mL) | 5.19 ± 2.93 | 4.71 ± 2.72 | 7.29 ± 2.95 | < 0.001 |
| CPR (ng/mL) | 1.88 ± 1.55 | 1.50 ± 0.61 | 3.40 ± 2.84 | < 0.001 |
| eGFR (mL/min/1.73 m2) | 76.6 ± 12.3 | 77.8 ± 12.1 | 71.0 ± 11.8 | 0.008 |
| Fatty liver | 47 (31%) | 30 (25%) | 17 (61%) | < 0.001 |
| Hemoglobin (g/dL) | 14.9 ± 1.1 | 15.0 ± 1.1 | 14.8 ± 1.3 | 0.650 |
| Variables | Univariate, HR (95% CI) | P value | Multivariate, aHR (95% CI) | P value |
|---|---|---|---|---|
| HR: hazard ratio; CI: confidence interval; aHR: adjusted hazard ratio; BMI: body mass index; SBP: systolic blood pressure; DBP: diastolic blood pressure; TG: triglycerides; HDL: high-density lipoprotein; LDL: low-density lipoprotein; eGFR: estimated glomerular filtration rate; CRP: C-reactive protein; ALT: alanine transaminase. | ||||
| BMI ≥ 25 kg/m2 | 4.28 (1.92 - 9.52) | < 0.001 | 1.14 (0.41 - 3.13) | 0.80 |
| SBP ≥ 130 mm Hg | 2.58 (1.23 - 5.43) | 0.012 | 1.61 (0.64 - 4.09) | 0.32 |
| DBP ≥ 85 mm Hg | 2.89 (1.32 - 6.30) | 0.008 | 1.37 (0.60 - 3.09) | 0.45 |
| TG ≥ 150 mg/dL | 2.42 (1.15 - 5.08) | 0.020 | 1.15 (0.45 - 2.95) | 0.77 |
| HDL < 40 mg/dL | 2.48 (1.08 - 5.67) | 0.031 | 2.40 (1.03 - 5.57) | 0.04 |
| LDL ≥ 140 mg/dL | 1.35 (0.60 - 3.01) | 0.470 | ||
| eGFR < 70 mL/min/1.73 m2 | 4.30 (2.03 - 9.14) | < 0.001 | 2.75 (1.05 - 7.20) | 0.04 |
| Fatty liver | 4.38 (2.06 - 9.30) | < 0.001 | 3.06 (1.23 - 7.61) | 0.02 |
| Uric acid ≥ 7.0 mg/dL | 1.56 (0.71 - 3.41) | 0.270 | ||
| CRP ≥ 0.1 mg/dL | 2.36 (1.13 - 4.91) | 0.022 | 1.07 (0.44 - 2.58) | 0.88 |
| ALT ≥ 50 U/L | 1.78 (0.66 - 4.76) | 0.250 | ||
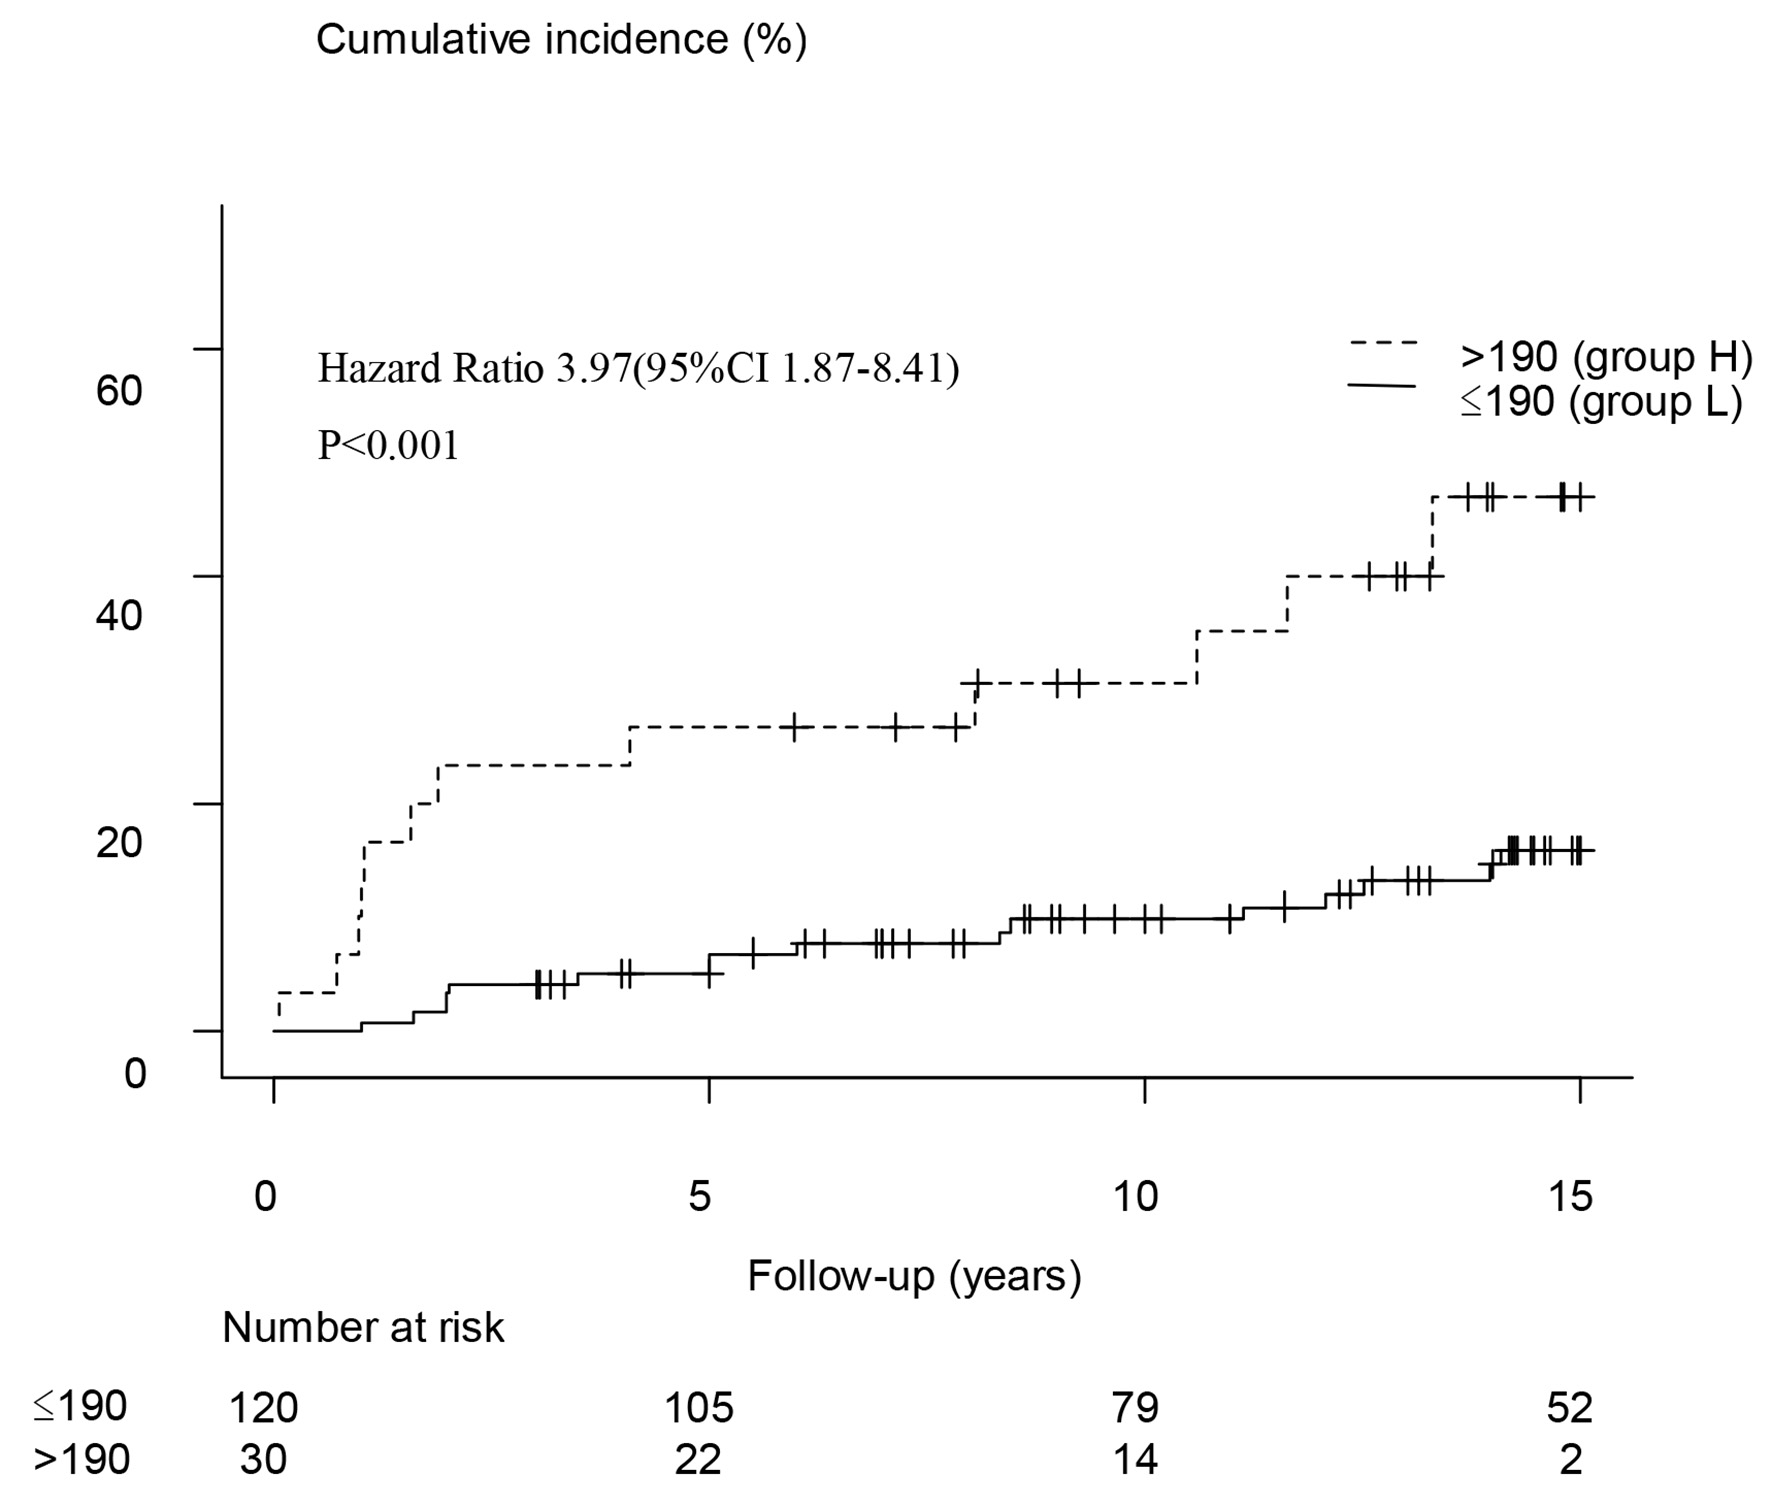
| Ferritin > 190 ng/mL | 3.97 (1.87 - 8.41) | < 0.001 | 2.77 (1.13 - 6.80) | 0.03 |