Figures
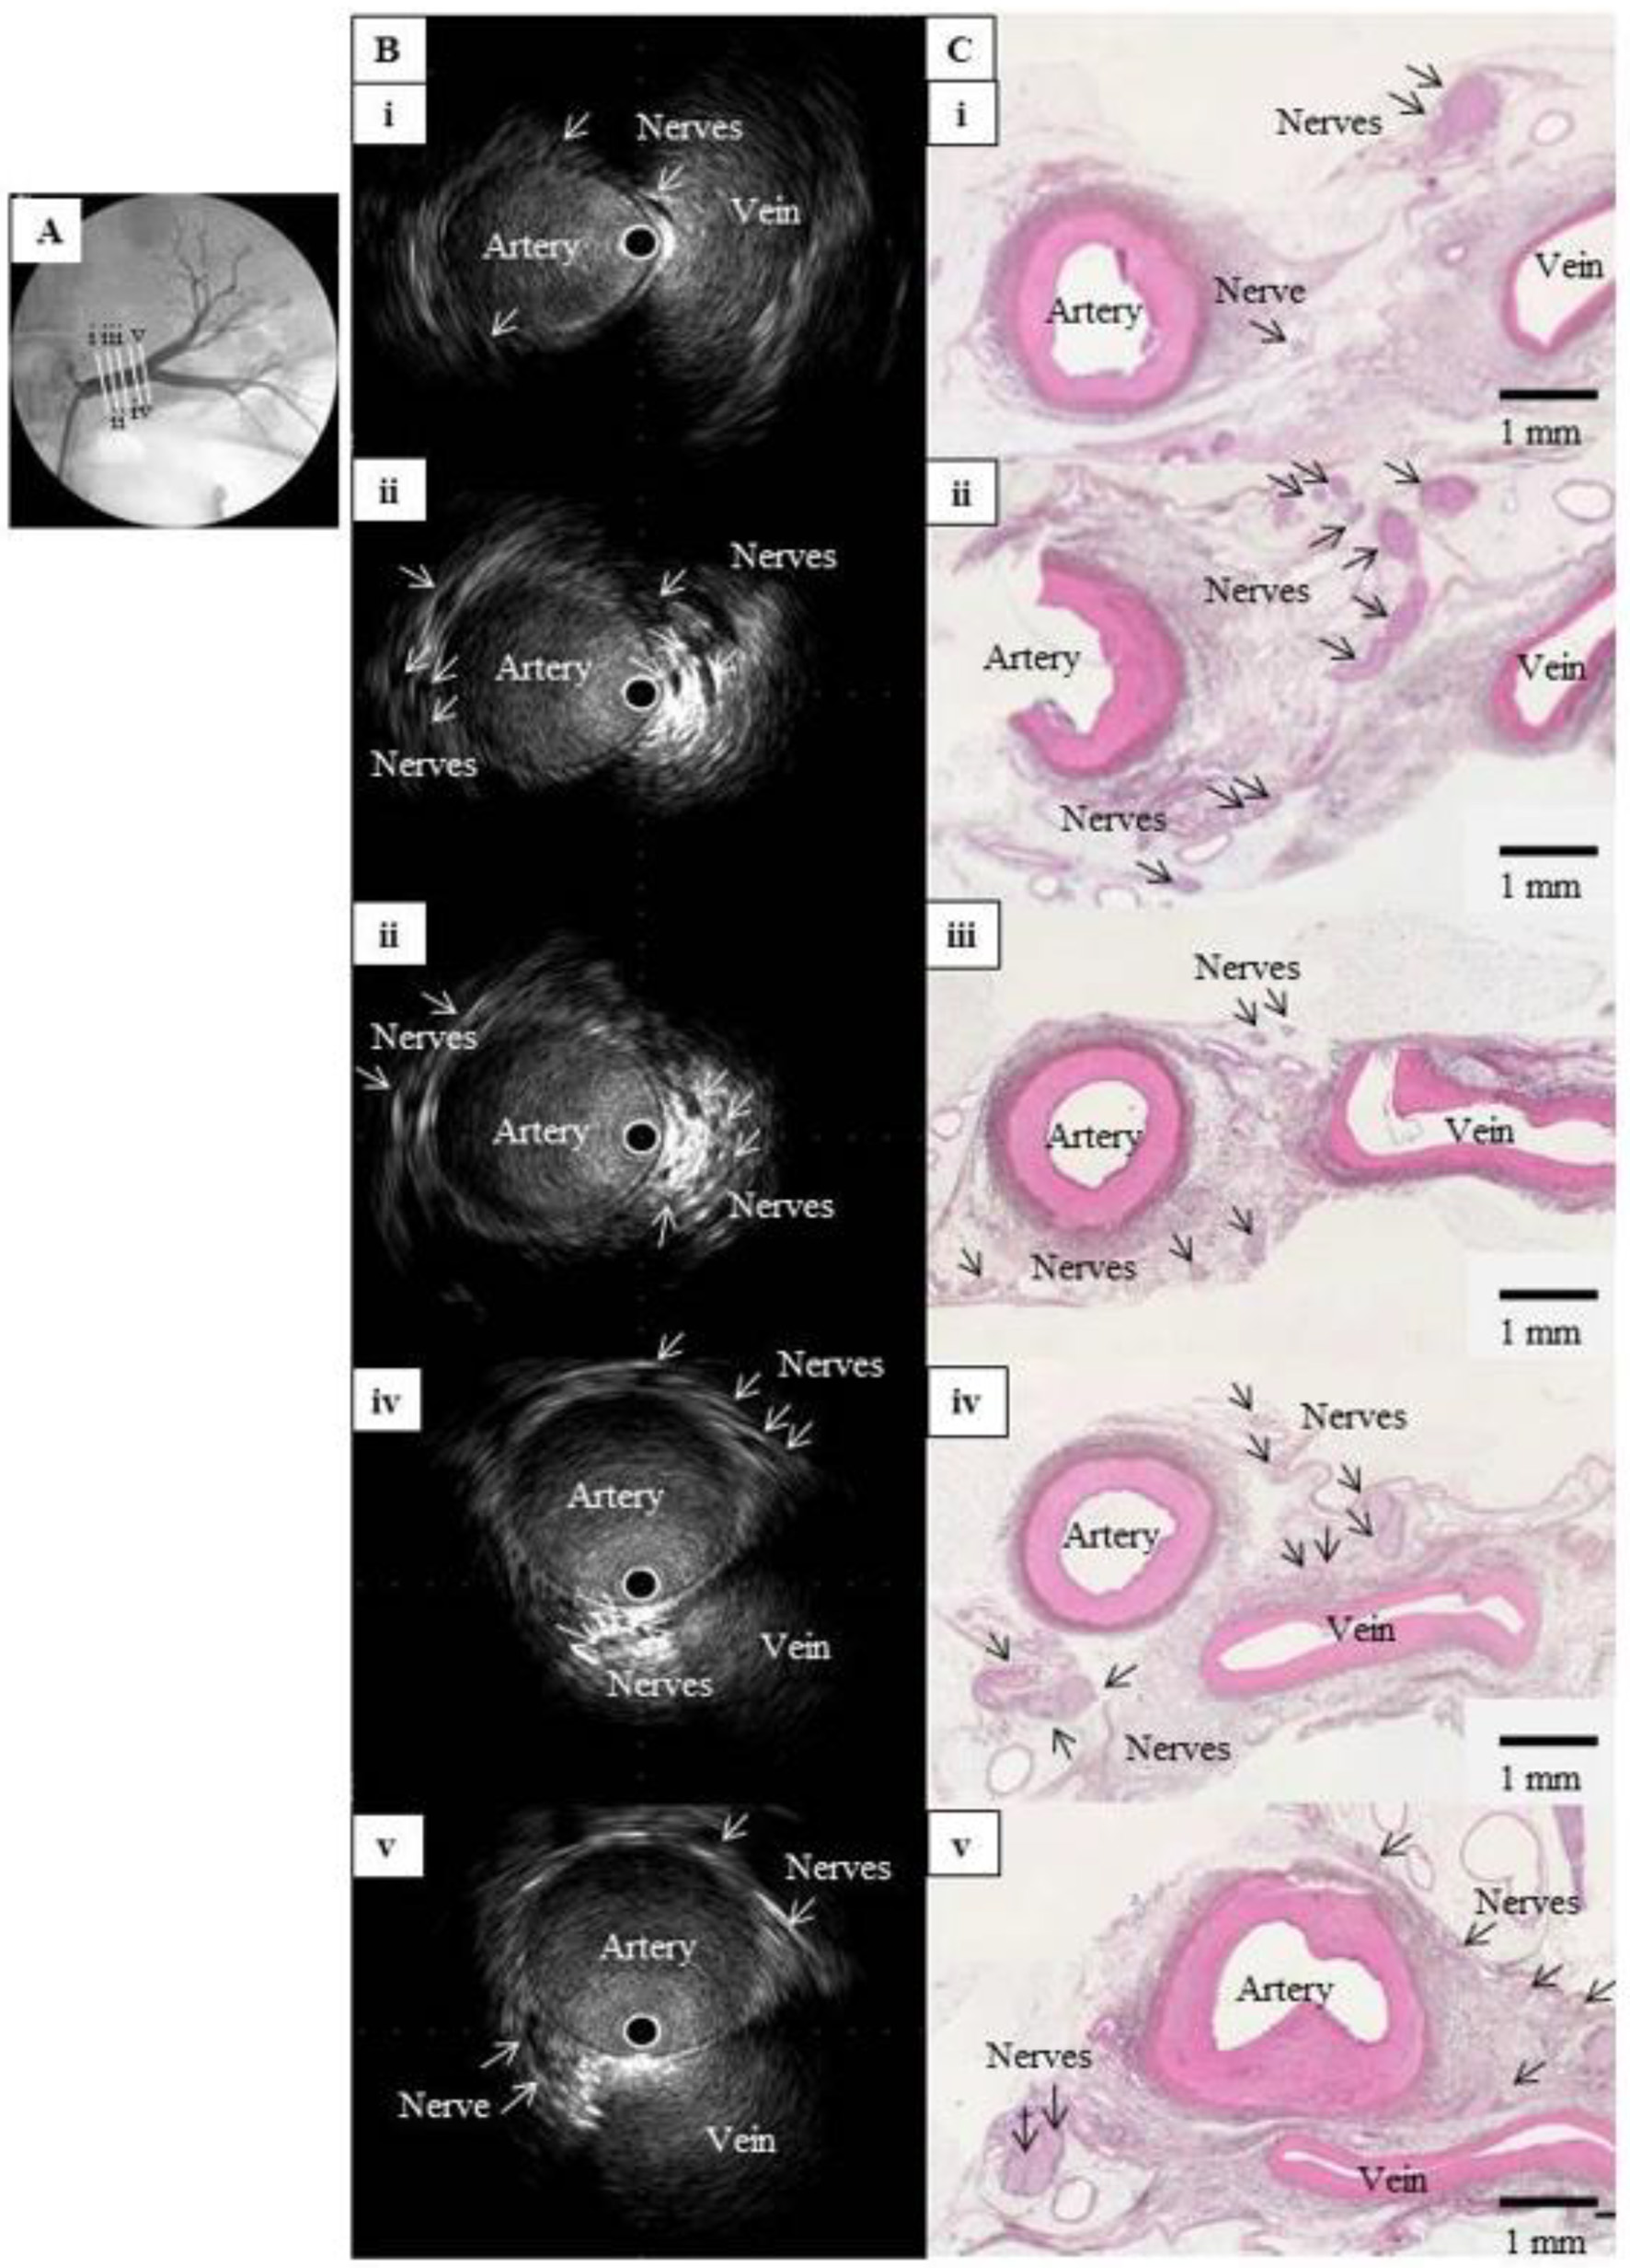
Figure 1. Comparison of IVUS images and histological sections from a normal renal artery in a pig. (A) Left renal angiography with cross-sections of the main renal artery, labeled i (nearest the abdominal aorta) to v (nearest the kidney) and viewed in (B) and (C). (B) Intravascular ultrasound images of the cross-sections in (A), showing multiple hypoechoic regions without luminal structures along the outside of the renal artery. These structures clustered near the junction between the artery and vein. (C) Hematoxylin-eosin-stained histological images of the cross-sections in (A), showing multiple nerve bundles in the connective tissue around the renal artery. The vein appeared considerably atrophied with no blood flow, but the images confirmed that the clustered hypoechoic structures in (B) were nerves. IVUS: intravascular ultrasound;
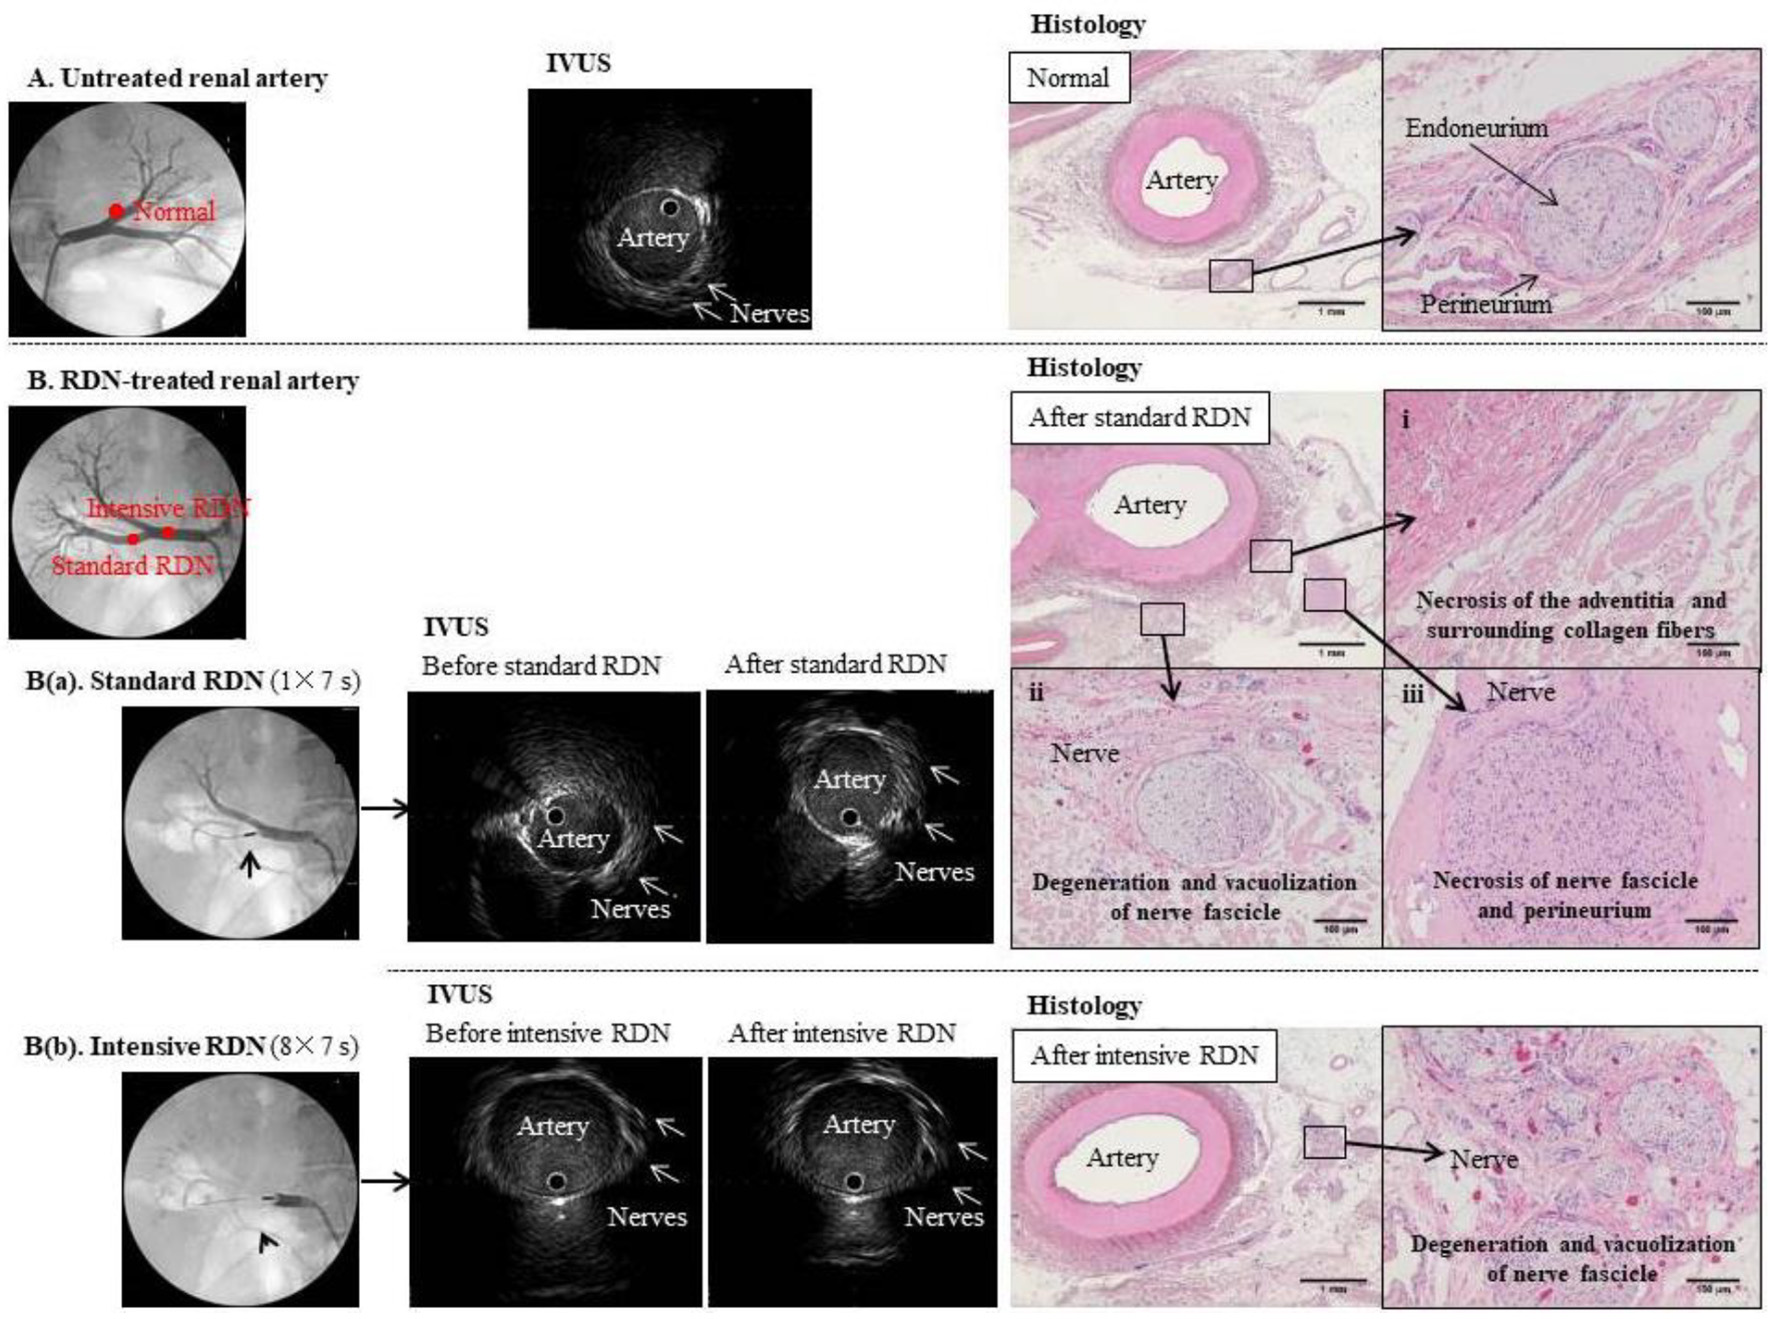
Figure 2. Comparison of IVUS images and tissue specimens before and after RDN. (A) Untreated renal artery. Left panel: Angiogram of normal left renal artery branch. Middle panel: IVUS image of the same artery branch showing hypoechoic structures that appear to be nerves outside the blood vessel. Right panel: hematoxylin-eosin-stained tissue section at the same anatomical level as the IVUS image. Magnified image shows a normal periarterial nerve bundle. Each nerve fiber is covered by the endoneurium (fibrous connective tissue) and gathered into a small bundle, which is surrounded by the perineurium (a sheath of collagenous fibers) and gathered into a fiber bundle. Because the nerve fibers meander inside the perineurium, the cross-sections of individual fibers vary from transverse to almost longitudinal. (B) Renal artery before and after standard (a) and intensive (b) RDN. Left panels: Angiogram showing placement of RDN device in the right renal artery branch. Middle panels: IVUS images showing the artery and surrounding nerves before and after (a) standard RDN (one treatment of 7 s) and (b) intensive RDN (eight treatments of 7 s); multiple hypoechoic structures that appear to be nerves can be seen outside the blood vessels, but no clear changes to these structures were observed even after excessive ablation. Right panels: hematoxylin-eosin-stained sections confirmed ablation after RDN.
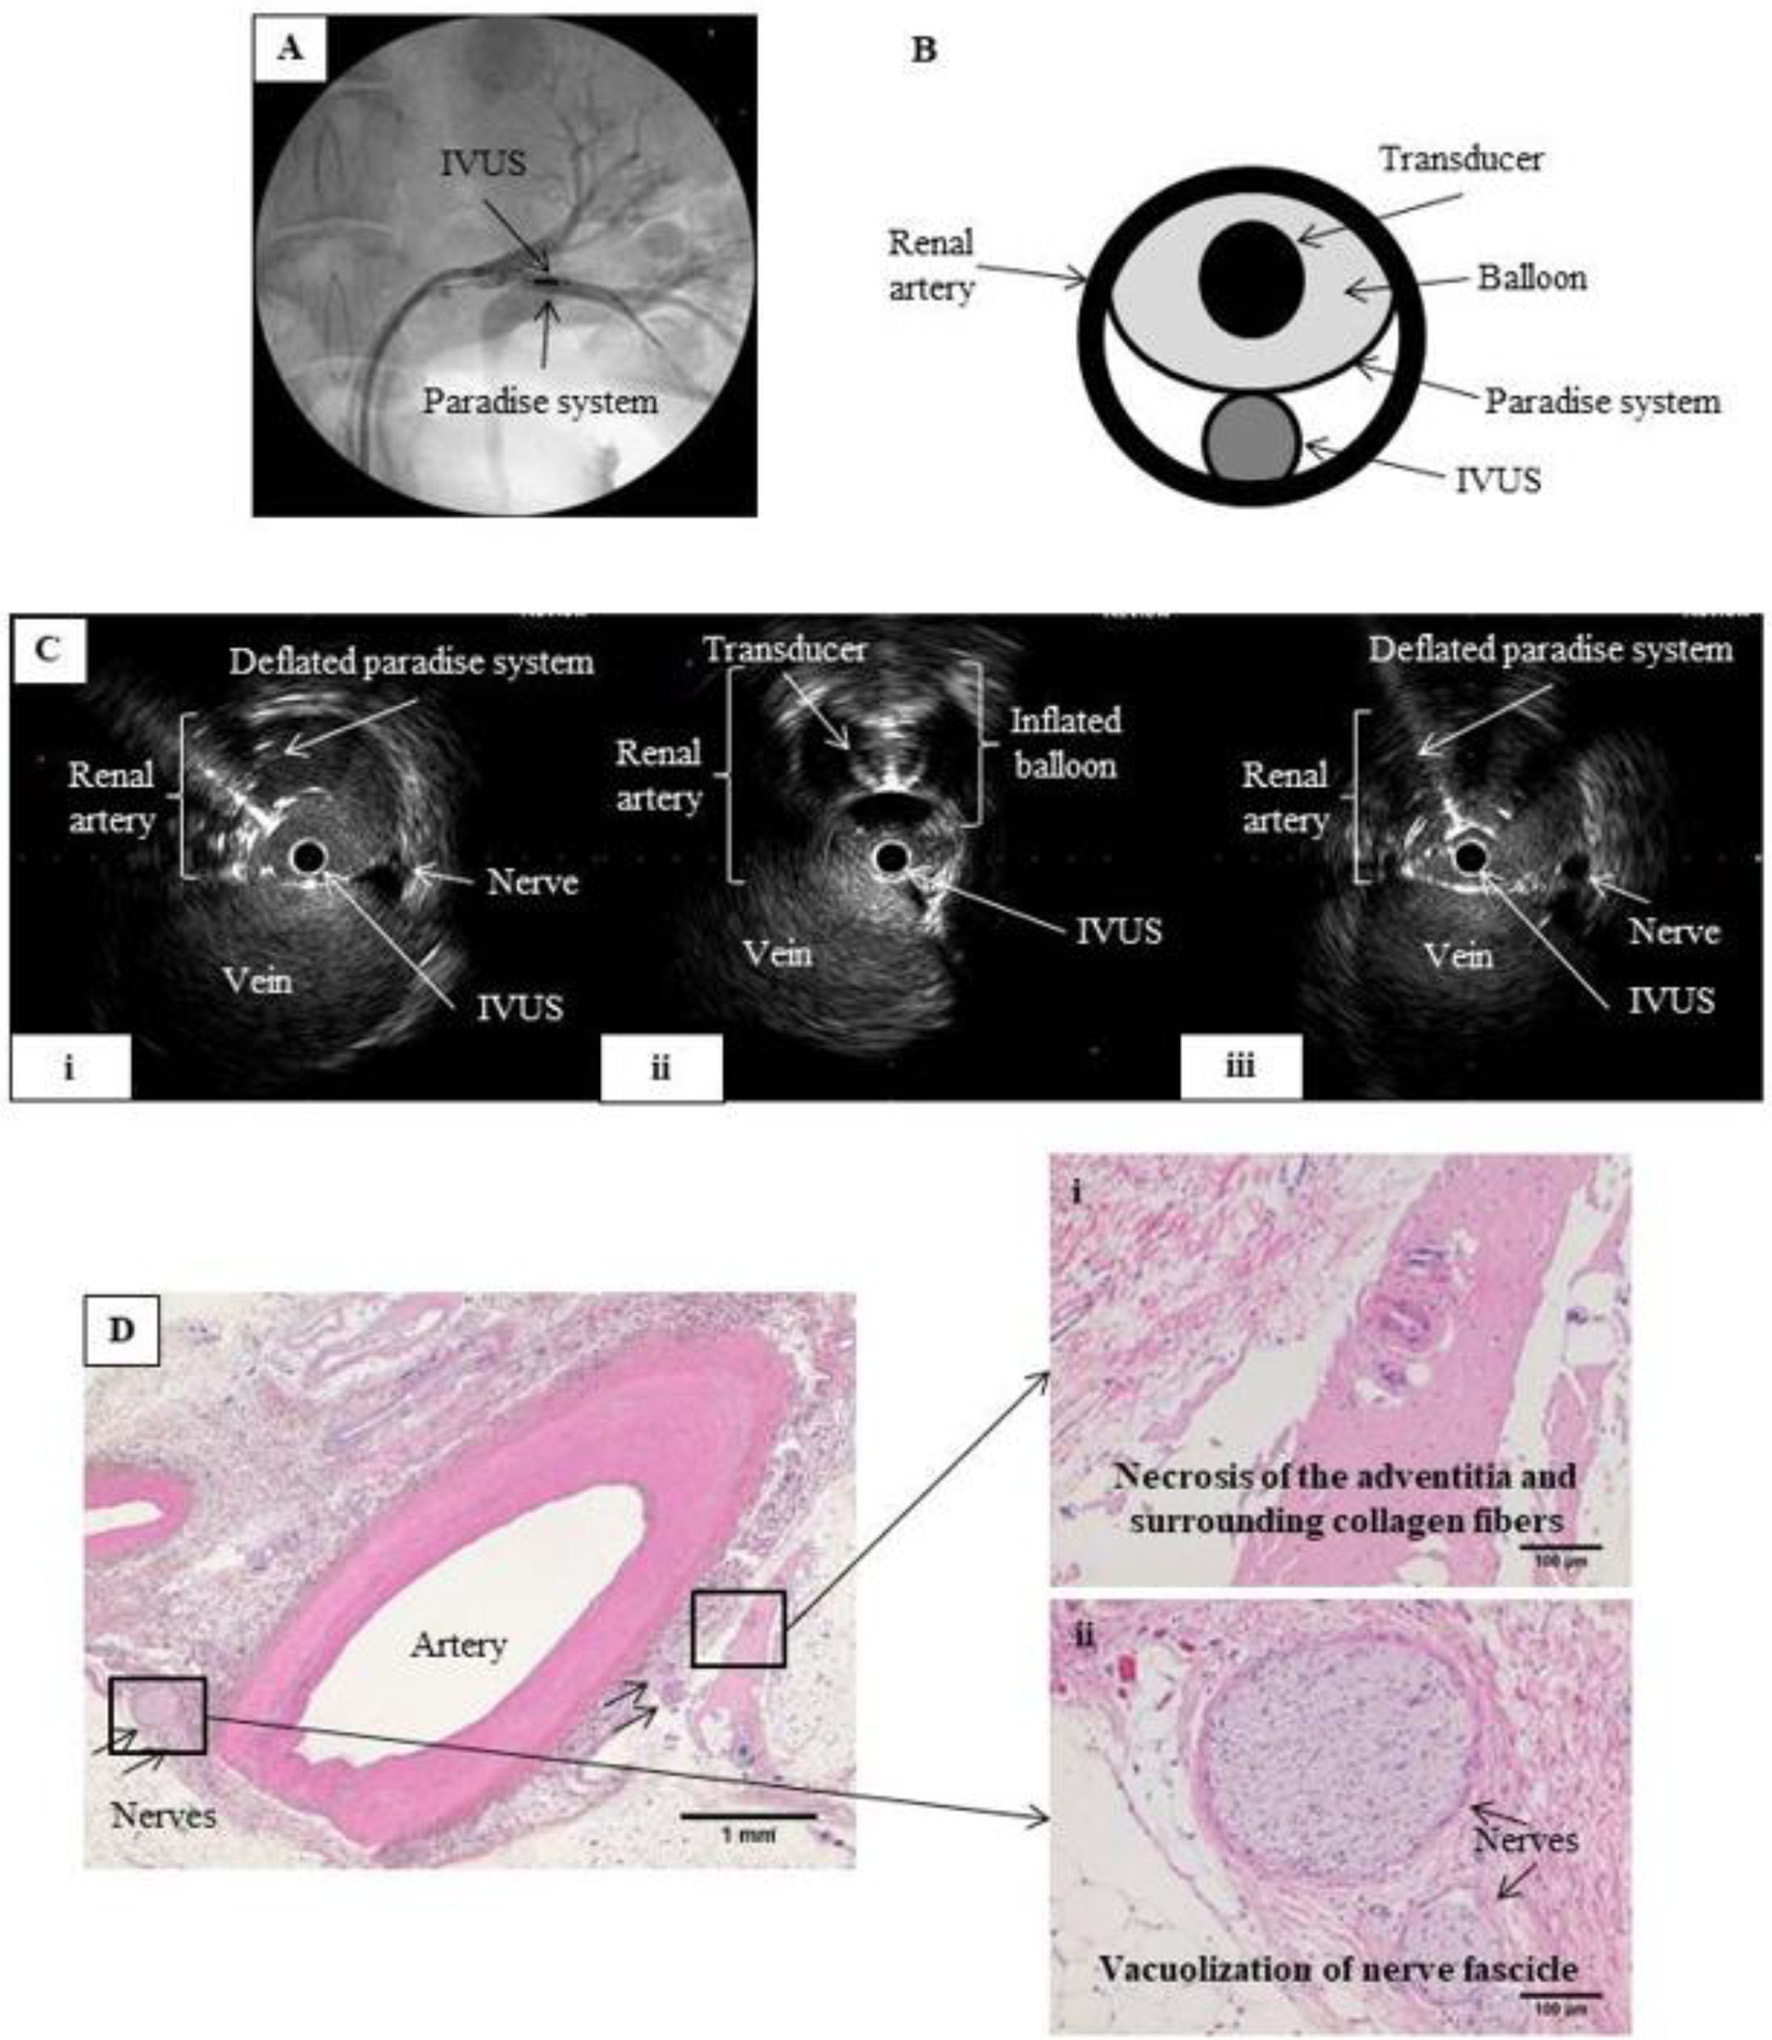
Figure 3. RDN in the renal artery under IVUS monitoring. (A) Renal angiography. An 8 Fr guiding catheter was inserted on each side via the inguinal artery into the left renal artery. The IVUS probe and the Paradise® system transducer were placed parallel to each other at the same point within the renal artery. (B) Schematic of renal artery cross-section showing parallel placement of the IVUS probe and Paradise® system transducer in the artery. Ablation was performed while monitoring with IVUS. (C) IVUS images before, during, and after IVUS-guided RDN. RDN-induced changes in the artery wall can be viewed in real time during the procedure. (i) Before RDN, showing the IVUS probe and the deflated balloon of the Paradise® system inside the renal artery. (ii) During RDN, showing the inflated balloon of the Paradise® system, which appears as a perfect circle. (iii) After RDN, showing the IVUS probe and deflated balloon in the renal artery. We expected that IVUS would allow us to observe the ablation in real time, but no clear differences in nerves were observed before and after the procedure. (D) Hematoxylin-eosin-stained tissue section after IVUS-guided RDN. Magnified images show (i) necrosis of the adventitia and surrounding collagen fibers and (ii) vacuolization of the nerve fascicle, confirming successful RDN.
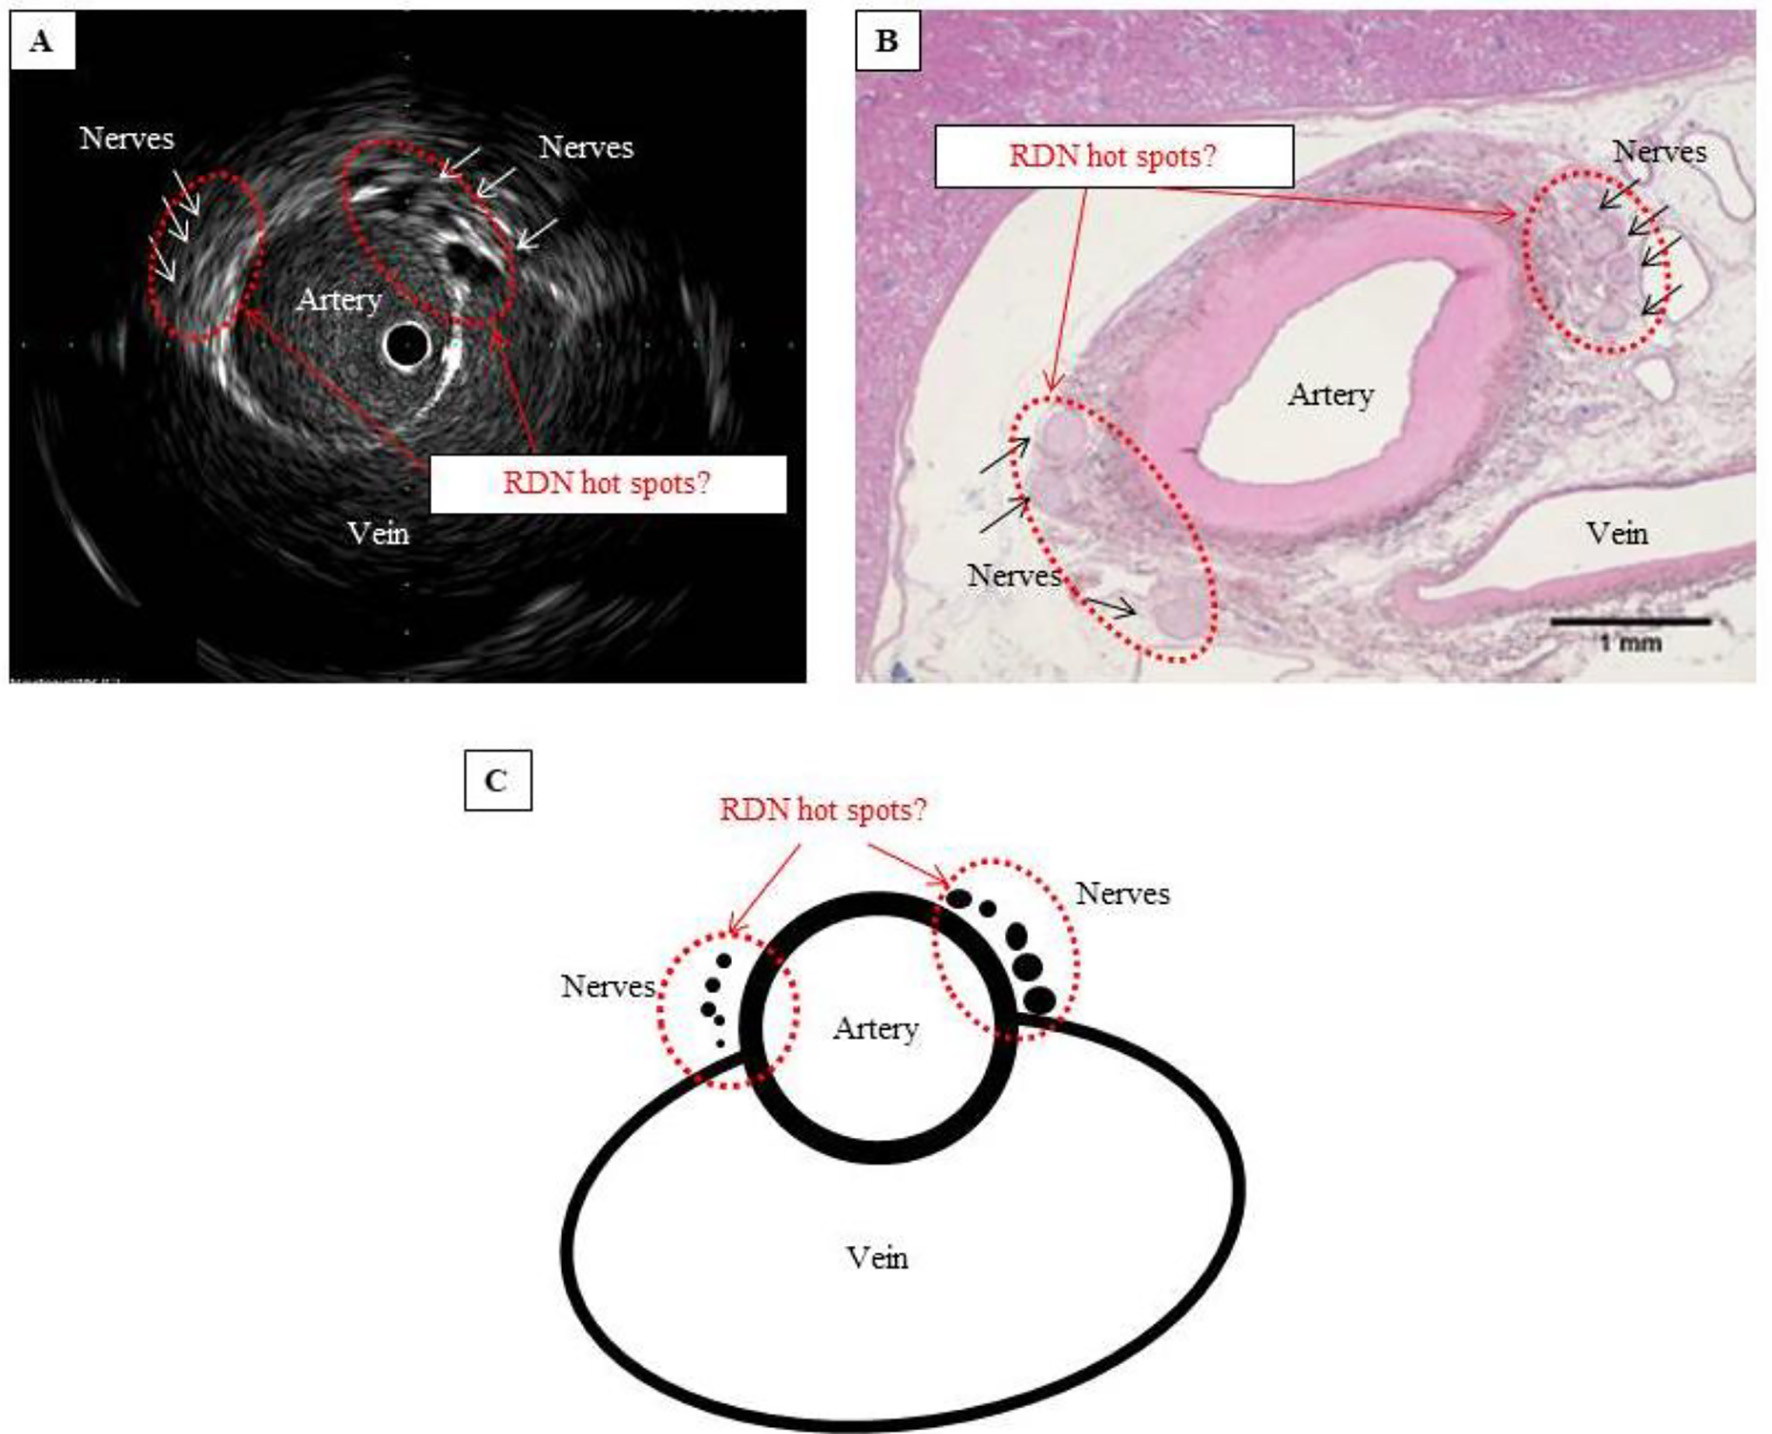
Figure 4. Are these hot spots that should be targeted in RDN? (A) IVUS image showing that the nerves cluster where the artery and vein lie closest to each other. (B) Hematoxylin-eosin-stained tissue section showing considerably atrophied vein, with no blood flow, but confirming the cluster of nerves where the artery and vein lie closest to each other. (C) Schematic of hot spot theory. By selectively performing RDN at a site where the nerves cluster, ablation can be performed efficiently and with pinpoint accuracy. Such a site can be considered a hot spot that potentially improves the blood pressure-lowering effect of RDN.