Journal of Clinical Medicine Research, ISSN 1918-3003 print, 1918-3011 online, Open Access
Article copyright, the authors; Journal compilation copyright, J Clin Med Res and Elmer Press Inc
Journal website https://www.jocmr.org

Original Article

Volume 13, Number 9, September 2021, pages 479-486


Development of a Method for Estimating Dietary Salt Intake Using the Overnight Urinary Sodium/Potassium Ratio

Figure

Figure 1.
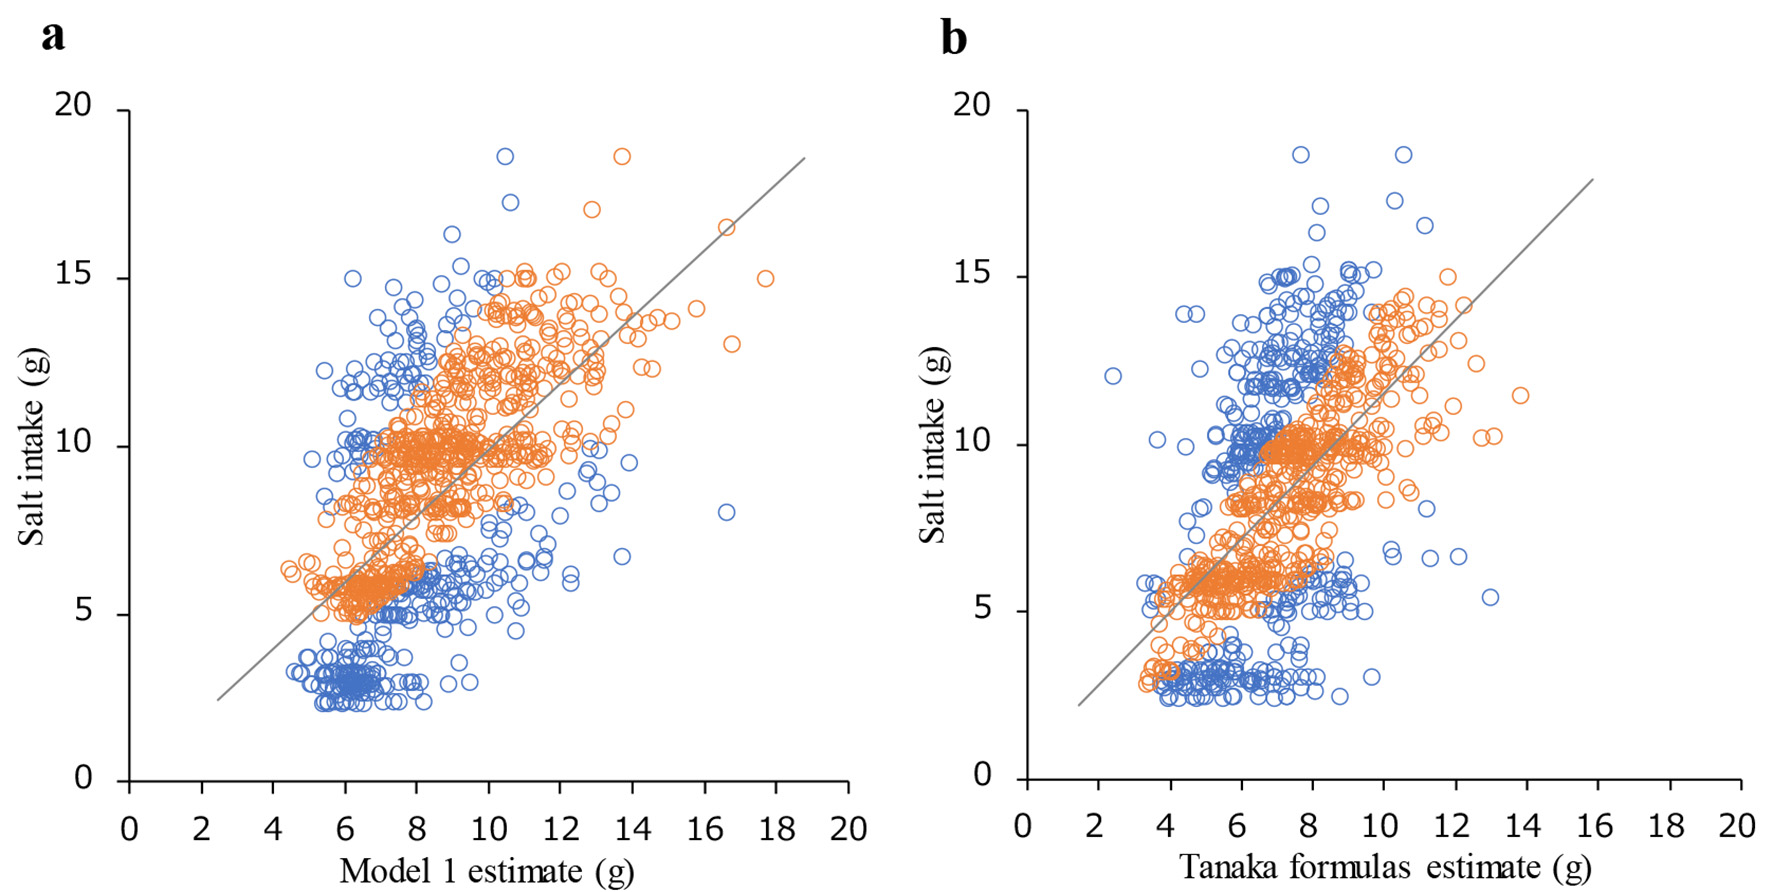
Figure 1. Relationship between measured and estimated previous day’s salt intake. (a) Relationship between salt intake estimated by model 1 and actual salt intake. (b) Relationship between salt intake estimated by Tanaka formulas and actual salt intake. Blue plot: relative difference > 30%, orange plot: relative difference ≤ 30%. The percentages of relative difference ≤ 30% for model 1 and Tanaka formulas were 64.2% and 58.4%, respectively. The percentages of absolute difference ≤ 1 g for model 1 and Tanaka formulas were 25.0% and 25.6%, respectively.

Tables

Table 1. Characteristics, Urinary Findings and Dietary Salt Intakes of Study Subjects
 
VariablesOverall (n = 43)Male (n = 13)Female (n = 30)P-valueb
Age (years)28.2 ± 10.832.9 ± 13.026.2 ± 9.30.008
Height (cm)161.0 ± 6.6168.2 ± 3.0157.9 ± 5.2< 0.001
Weight (kg)54.8 ± 9.562.5 ± 11.351.5 ± 6.4< 0.001
BMI (kg/m2)21.1 ± 3.022.1 ± 4.120.6 ± 2.40.244
SBP (mm Hg)a105.2 ± 10.2114.1 ± 4.6102.6 ± 10.00.007
DBP (mm Hg)a68.9 ± 7.771.6 ± 7.268.2 ± 7.80.356
(n = 909)(n = 231)(n = 678)P-valuec
aBlood pressure at baseline was measured in subjects recruited from universities (seven males and 24 females). bComparing males versus females by Mann-Whitney U test. cComparing males versus females by Student’s t-test. BMI: body mass index; SBP: systolic blood pressure; DBP: diastolic blood pressure.
Na (mmol/L)83.3 ± 56.669.1 ± 51.288.1 ± 57.6< 0.001
K (mmol/L)26.1 ± 16.725.9 ± 16.026.2 ± 16.90.822
Na/K (mmol/mmol)3.69 ± 2.492.73 ± 1.554.01 ± 2.66< 0.001
Cr (mg/dL)118 ± 82141 ± 81111 ± 81< 0.001
Specific gravity1.017 ± 0.0081.018 ± 0.0081.017 ± 0.0080.294
Conductivity (mS/cm)15.8 ± 6.614.5 ± 5.916.3 ± 6.7< 0.001
Urine weight (g)295 ± 150331 ± 167283 ± 142< 0.001
Salt intake (g)8.44 ± 3.427.91 ± 3.548.62 ± 3.360.006


Table 2. Correlation Matrix of Measurements
 
AgeWeightPre-salt intakeHeightConductivityNa/K ratioSpecific gravity
rP-valuerP-valuerP-valuerP-valuerP-valuerP-valuerP-value
*P < 0.05; **P < 0.01; ***P < 0.001. Pre-salt intake: previous day’s salt intake.
Weight0.336***
Pre-salt intake0.159***0.0200.551
Height0.187***0.509***-0.0640.053
Conductivity-0.0370.2640.107**0.433***-0.110***
Na/K ratio0.171***-0.0580.0790.522***-0.0310.3410.196***
Specific gravity-0.0330.3110.169***0.182***-0.0050.8720.803***-0.087**
Urine weight-0.0030.924-0.140***-0.127***0.151***-0.600***0.148***-0.728***


Table 3. Regression Equation for Estimating the Previous Day’s Salt Intake From Na/K Ratio
 
Model 1Model 2Model 3
*P < 0.05; **P < 0.01; ***P < 0.001. AIC: Akaike’s information criterion.
Intercept3.62***3.39***5.93***
Na/K ratio0.64***0.62***0.73***
Conductivity0.18***0.17***
Sex-0.43*-0.22
AIC4,3864,3894,535
n909909910
R20.3810.3790.273


Table 4. Comparison of Measured and Estimated Previous Day’s Salt Intake
 
AverageSDPercentilen
0%25%50%75%100%
Model 1: previous day’s salt intake (g) = 3.62 + 0.64 × Na/K ratio + 0.18 × conductivity (mS/cm) - 0.43 × sex (males 0, females 1). Tanaka’s equation: estimated 24HUNaV (mEq/day) = 21.98 × XNa0.392, where XNa = SUNa/SUCr × PRCr, SUNa is Na concentration in the spot voiding urine, SUCr is creatinine concentration in the spot voiding urine, PRCr is predicted value of 24HUCr, PRCr = -2.04 × age + 14.89 × weight (kg) + 16.14 × height (cm) - 2244.45. SD: standard deviation.
Salt intake (g)8.443.422.365.808.7010.7318.62909
Model 1 (g)8.512.134.476.858.129.7517.75909
Tanaka (g)7.141.792.445.877.028.2513.84909