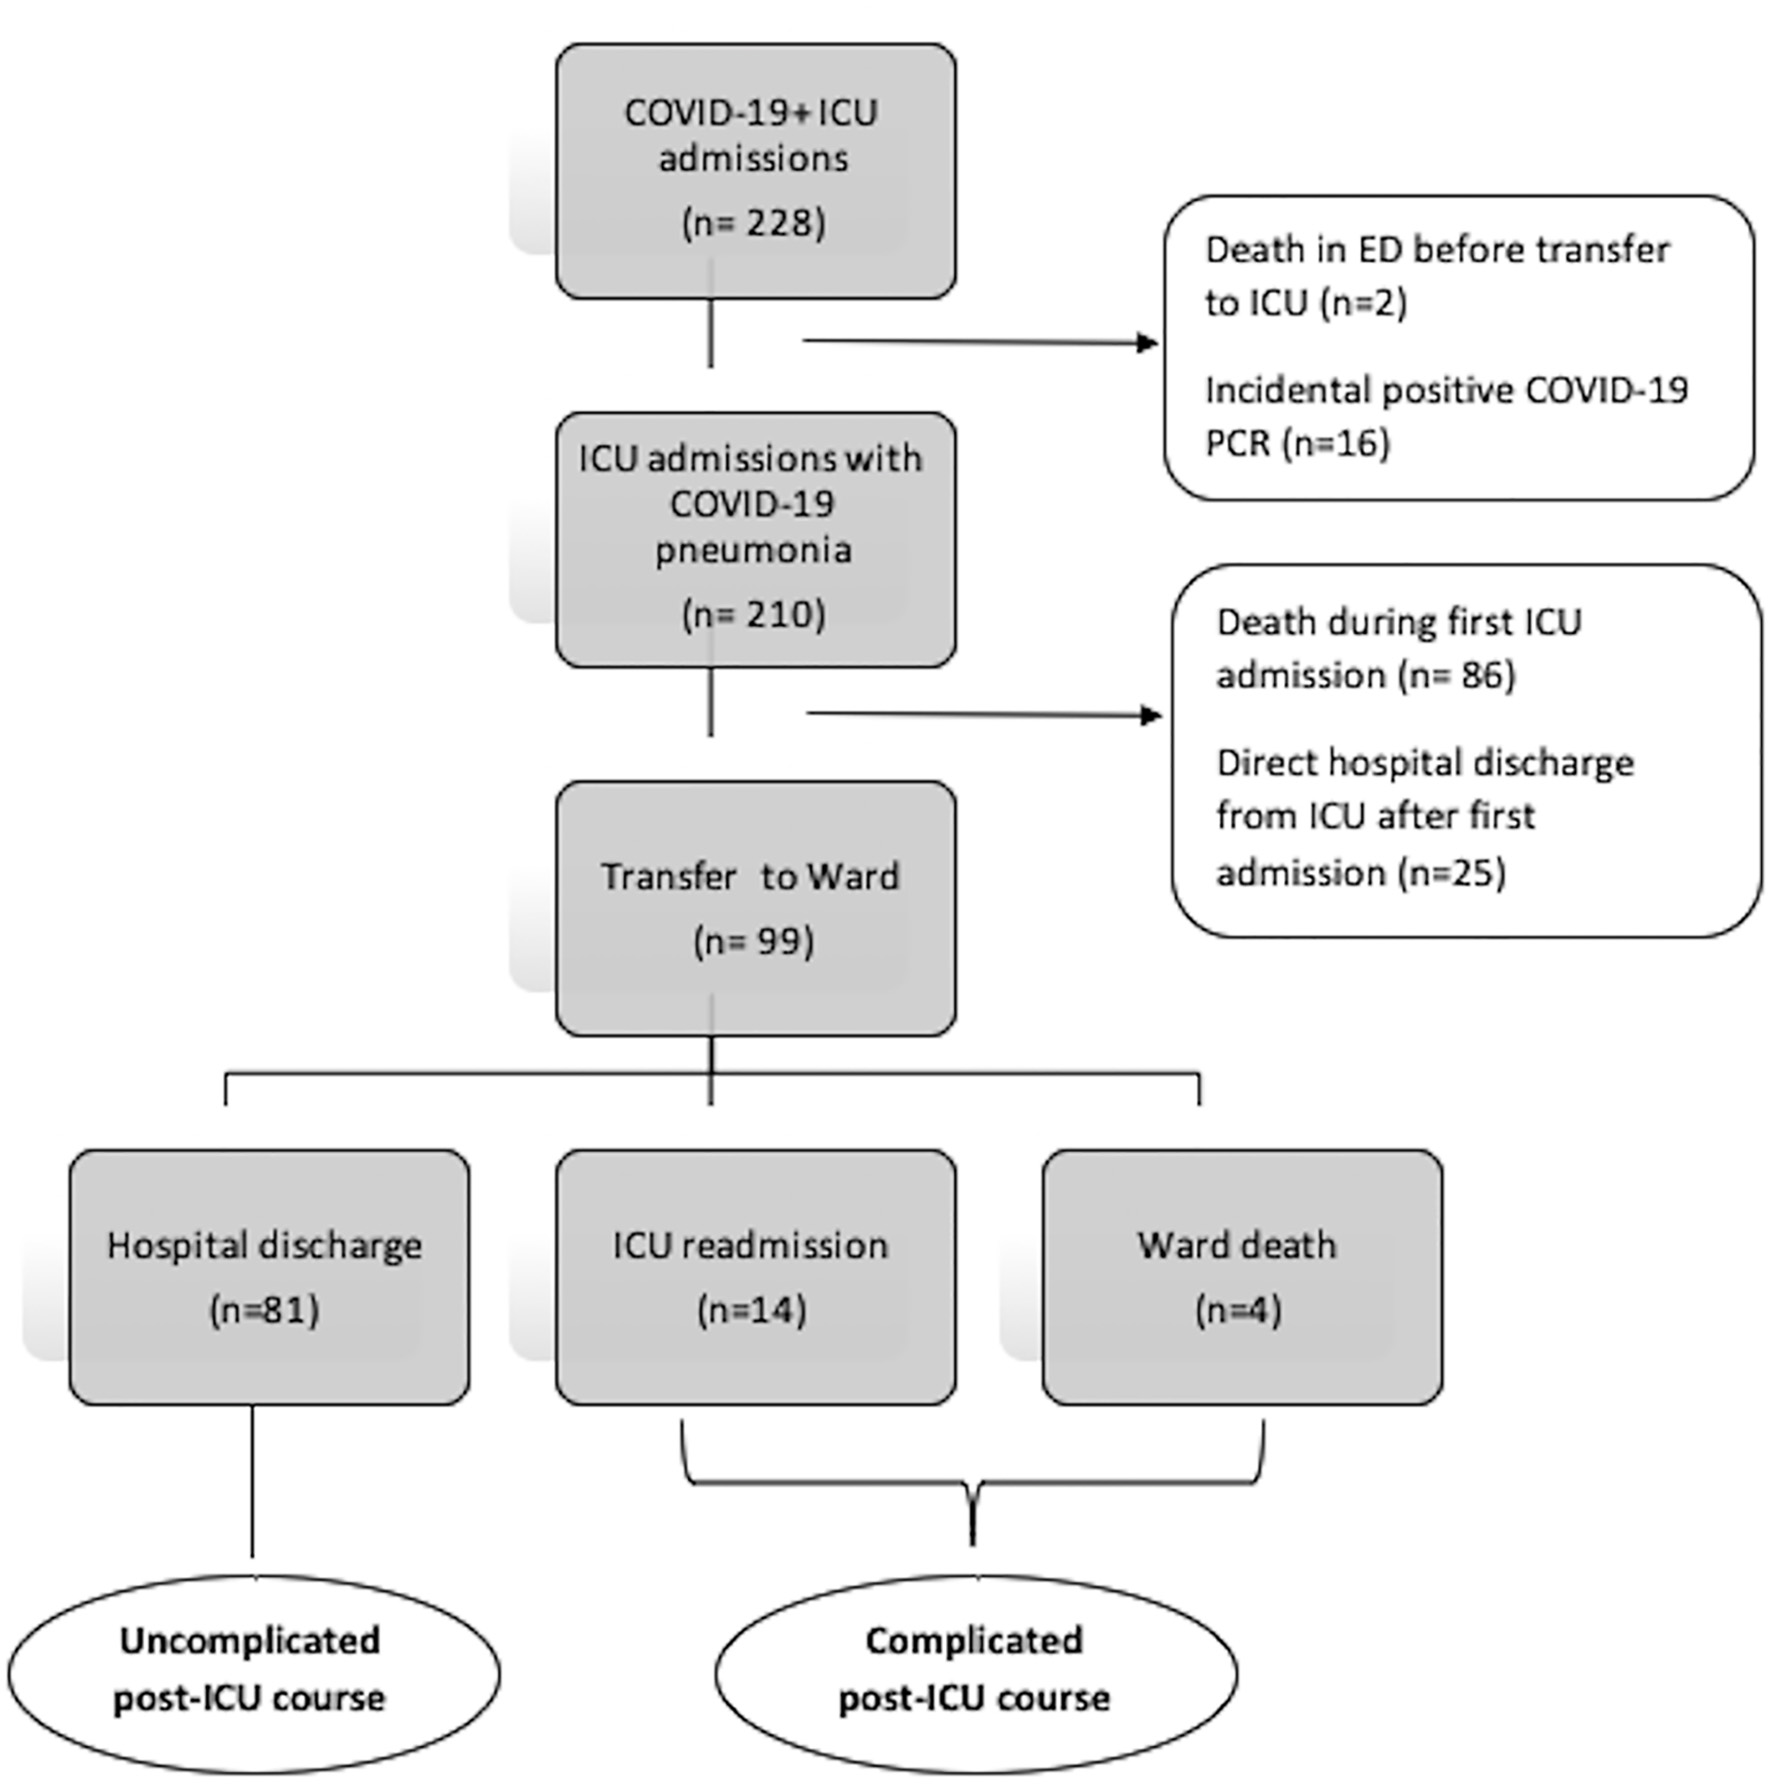
Figure 1. Flow chart depicting how the two study groups was obtained. ICU: intensive care unit; COVID-19: coronavirus disease 2019; PCR: polymerase chain reaction; ED: emergency department.
| Journal of Clinical Medicine Research, ISSN 1918-3003 print, 1918-3011 online, Open Access |
| Article copyright, the authors; Journal compilation copyright, J Clin Med Res and Elmer Press Inc |
| Journal website https://www.jocmr.org |
Original Article
Volume 13, Number 10-11, November 2021, pages 487-496
Clinical and Laboratory Profile of COVID-19 Pneumonia Patients With a Complicated Post-Intensive Care Unit Hospital Course
Figures
Tables
| Patients with complicated course (n = 18) | Patients with uncomplicated course (n = 81) | P-valuea | |
|---|---|---|---|
| aP-values by t-test or Mann-Whitney test for continuous variables; Fisher’s exact test for categorical variables. bBased on n = 16 in complicated group and n = 71 in uncomplicated group. cBased on n = 12 in complicated group and n = 51 in uncomplicated group. *Statistical significance with a P-value less than 0.05. AKI: acute kidney injury; APACHE: Acute Physiology and Chronic Health Evaluation; BMI: body mass index; CRP: C-reactive protein; ED: emergency department; ICU: intensive care unit; IQR: interquartile range; LDH: lactate dehydrogenase; PF: PaO2/FiO2; RRT: renal replacement therapy; SD: standard deviation; WMC: Westchester Medical Center. | |||
| Demographics | |||
| Age, years, mean ± SD | 70 (11) | 56 (15) | < 0.001* |
| Sex, female, n (%) | 9 (50%) | 56 (69%) | 0.13 |
| Sex, male, n (%) | 9 (50%) | 25 (31%) | |
| Smoking, n (%) | 0.85 | ||
| Yes | 4 (22) | 13 (16) | |
| No | 12 (67) | 56 (69) | |
| Unknown | 2 (11) | 12 (14) | |
| Comorbidities, n (%) | |||
| Obesity (BMI ≥ 30) | 8 (44%) | 35 (44%) | 0.99 |
| Chronic kidney disease | 2 (11%) | 10 (12%) | > 0.99 |
| Chronic pulmonary disease | 2(11%) | 8 (10%) | > 0.99 |
| Coronary artery disease | 3 (22%) | 9 (11%) | 0.25 |
| Congestive Heart Failure | 3 (17%) | 7 (9%) | 0.38 |
| Stroke | 0 (0%) | 1 (1%) | > 0.99 |
| Diabetes mellitus | 7 (39%) | 27 (33%) | 0.78 |
| Hypertension | 8 (44%) | 33 (41%) | 0.78 |
| Cirrhosis | 1 (6%) | 5 (6%) | > 0.99 |
| Active malignancy | 0 (0%) | 1 (1.2%) | > 0.99 |
| History of malignancy | 3 (17%) | 3 (4%) | 0.11 |
| Solid organ transplant | 1 (6%) | 6 (7%) | > 0.99 |
| Charlson Comorbidity Index, mean ± SD | 4.5 (3) | 2.5 (2) | 0.003* |
| Admission source, n (%) | |||
| WMC ED | 6 (33%) | 43 (53%) | 0.13 |
| Ward/outside transfer | 12 (67%) | 38 (47%) | |
| APACHE IV score, median (IQR)b | 87 (51 - 112) | 57 (43 - 72) | 0.01* |
| Mechanical ventilation, n (%) | 12 (67%) | 51 (63%) | 0.77 |
| PF Ratio on intubation, median (IQR)c | 134 (65 - 257) | 111 (61 - 220) | 0.57 |
| AKI, n (%) | 10 (56%) | 40 (49%) | 0.64 |
| New RRT, n (%) | 1 (6%) | 13 (16%) | 0.45 |
| Initial WMC ICU stay, days, median (IQR) | 6.5 (2 - 10) | 8 (3 - 22) | 0.082 |
| Treatment, n (%) | |||
| Azithromycin | 16 (89%) | 62 (77%) | 0.35 |
| Hydroxychloroquine | 16 (89%) | 66 (82%) | 0.73 |
| Corticosteroids | 14 (78%) | 59 (73%) | 0.77 |
| Convalescent plasma | 2 (11%) | 40 (49%) | 0.003* |
| Therapeutic anticoagulation | 6 (33%) | 60 (74%) | 0.002* |
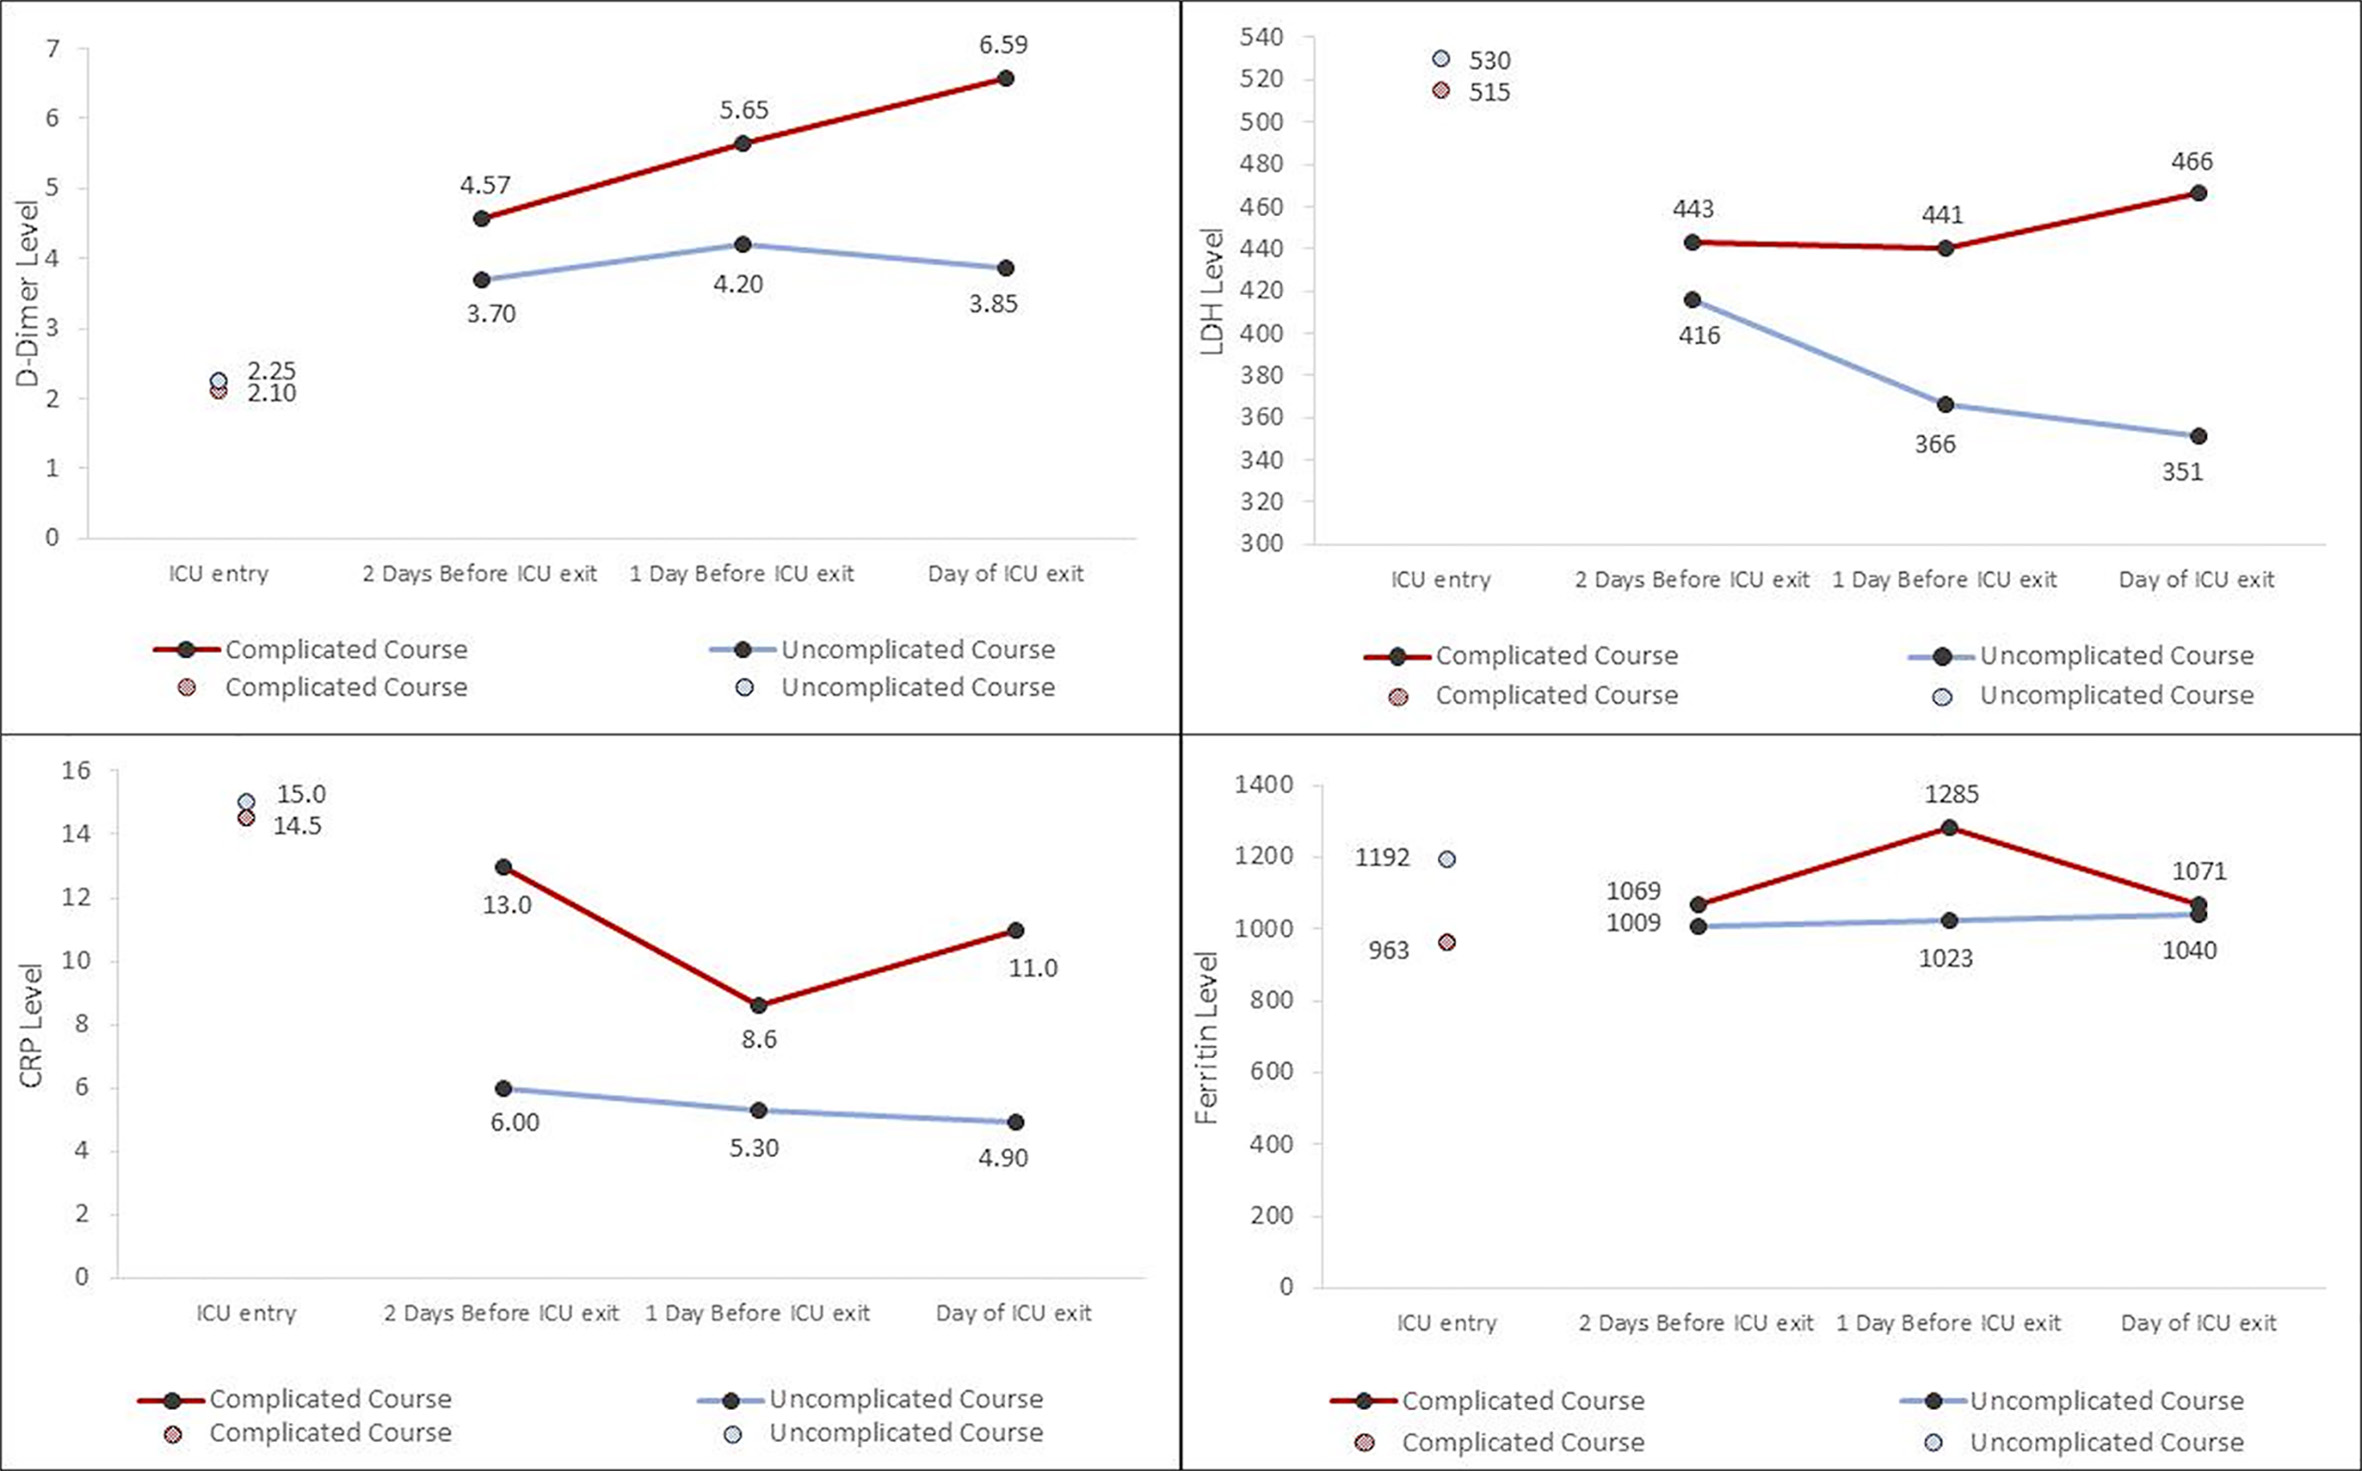
| Biomarkers at ICU entry, median (IQR) | |||
| D-dimer (mg/L) | 2.1 (1.3 - 19) | 2.3 (0.92 - 4.2) | 0.27 |
| LDH (U/L) | 515 (370 - 643) | 530 (374 - 721) | 0.73 |
| CRP (mg/dL) | 14.5 (9.2 - 25) | 15 (7.2 - 21) | 0.54 |
| Ferritin (µg/L) | 963 (412 - 1,759) | 1192 (525 - 2,920) | 0.50 |
| Variable | Crude OR (95% CI) | P-value | Adjusted OR (95% CI) | P-value |
|---|---|---|---|---|
| aValues missing for 12/99 patients. bResult from day of ICU entry. cResult from day of ICU exit. dValues missing for 26/99 patients. eValues missing for 24/99 patients. APACHE: Acute Physiology and Chronic Health Evaluation; CCI: Charlson Comorbidity Index; CRP: C-reactive protein; ICU: intensive care unit; OR: odds ratio; CI: confidence interval. | ||||
| CCI | 1.39 (1.12 - 1.72) | 0.003 | 1.94 (1.22 - 3.09) | 0.005 |
| APACHE IVa, b | 1.27 (1.05 - 1.53) | 0.013 | 1.39 (1.05 - 1.82) | 0.020 |
| D-dimerc, d | 1.11 (1.03 - 1.19) | 0.008 | 1.10 (1.00 - 1.22) | 0.057 |
| CRPc, e | 1.07 (1.00 - 1.13) | 0.043 | 1.16 (1.04 - 1.30) | 0.009 |
| Anticoagulation receipt | 0.18 (0.06 - 0.53) | 0.002 | 0.07 (0.01 - 0.50) | 0.008 |
| Convalescent plasma receipt | 0.13 (0.03 - 0.59) | 0.009 | 0.09 (0.01 - 0.62) | 0.015 |
| Patient | Days on ward | Death on ward | Return to ICU | IMV upon return | Final disposition | Notable ward events |
|---|---|---|---|---|---|---|
| aWard deaths after initial ICU downgrade. bPatient died on the ward after repeat ICU downgrade. AMS: altered mental status; DNI: do not reintubate; DNR: do not resuscitate; ICU: intensive care unit; IMV: invasive mechanical ventilation; NA: not applicable; PEA: pulseless electrical activity; SVT: superventricular tachycardia. | ||||||
| 1a | 2 | Y | NA | NA | NA | Died as DNR/DNI |
| 2a | 7 | Y | NA | NA | NA | New atrial flutter; new elevated troponin; QTc = 500 ms; bacteremia |
| 3a | 6 | Y | NA | NA | NA | Persistent AMS; new bradycardia |
| 4a | 2 | Y | NA | NA | NA | New atrial fibrillation; new bradycardia; QTc > 600 ms |
| 1 | 1 | N | Y | Y | ICU death | New elevated troponin |
| 2 | 5 | N | Y | Y | Facility discharge | Persistent AMS |
| 3 | 3 | N | Y | Y | Facility discharge | Persistent AMS; respiratory distress after swallow evaluation |
| 4 | 1 | N | Y | Y | ICU death | New atrial fibrillation; new elevated troponin; QTc = 500 ms; new fever with leukocytosis |
| 5 | 3 | N | Y | Y | Facility discharge | New episodes of SVT |
| 6 | 2 | N | Y | Y | Facility discharge | New episode of SVT; new elevated troponin; QTc > 500 ms |
| 7 | 12 | N | Y | N | Facility discharge | Fever and worsening infiltrates |
| 8 | 1 | N | Y | Y | Ward deathb | Empyema; PEA arrest |
| 9 | 1 | N | Y | Y | ICU death | None identified |
| 10 | 2 | N | Y | Y | Facility discharge | None identified |
| 11 | 1 | N | Y | Y | ICU death | None identified |
| 12 | 16 | N | Y | Y | ICU death | Bacteremia |
| 13 | 8 | N | Y | Y | Facility discharge | Persistent AMS; new sinus pauses > 30 s |
| 14 | 11 | N | Y | Y | Facility discharge | New elevated troponin |
| ICU return, N = 14 (78%) | 2.5 (1 - 8.75) | None | All | 13 (93%) | Hospital mortality 6 (43%) | |
| Total, N = 18 | 2.5 (1.25 - 6.76) | 4 (22%) | 14 (78%) | 13 (72%) | Hospital mortality: 10 (56%) | |