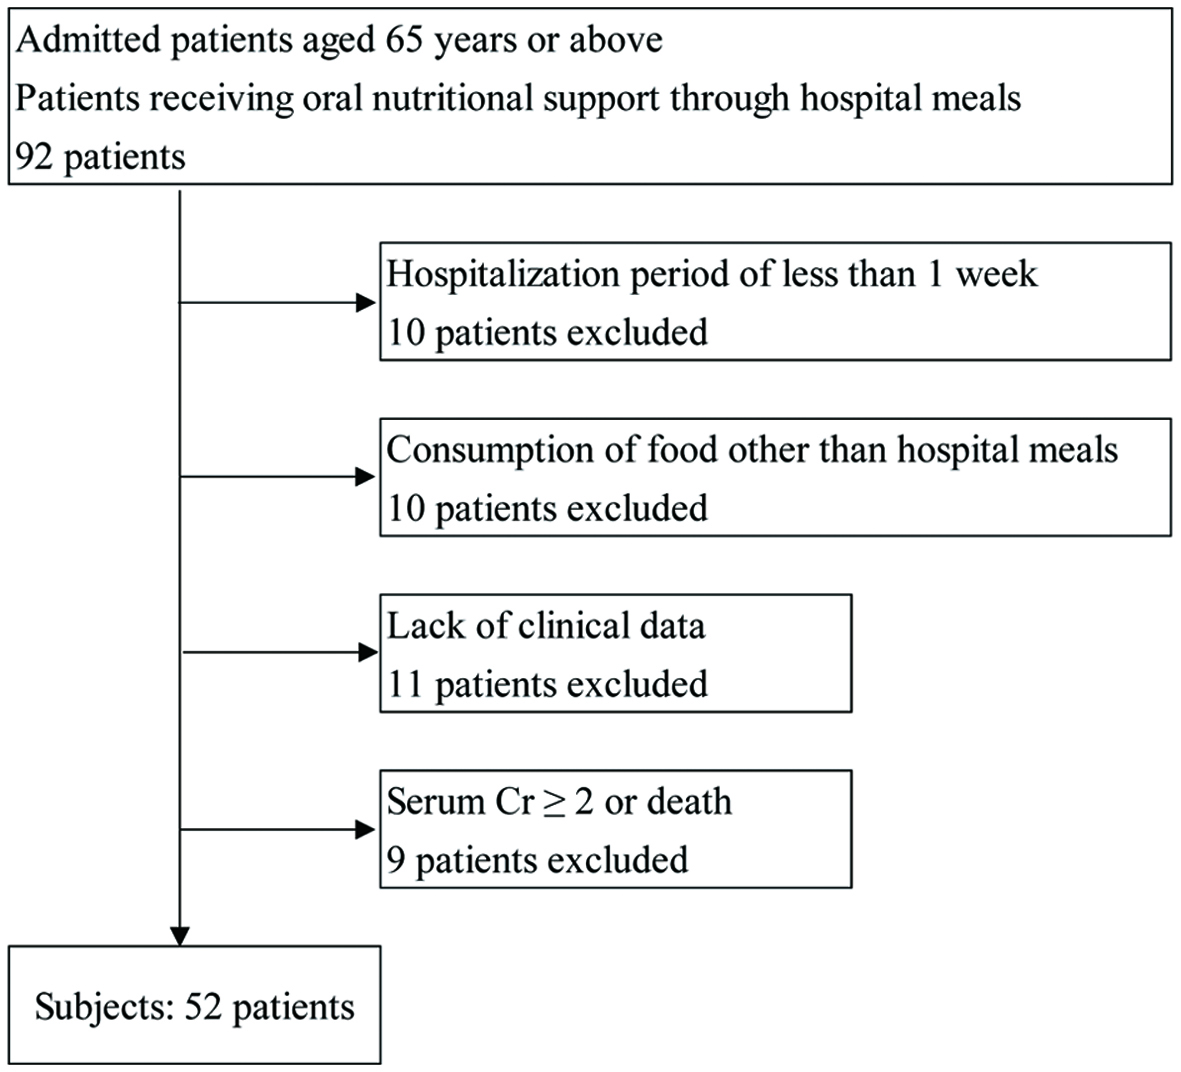
Figure 1. Scheme for subject recruitment and study workflow. Cr: creatinine.
| Journal of Clinical Medicine Research, ISSN 1918-3003 print, 1918-3011 online, Open Access |
| Article copyright, the authors; Journal compilation copyright, J Clin Med Res and Elmer Press Inc |
| Journal website https://www.jocmr.org |
Original Article
Volume 13, Number 6, June 2021, pages 334-342
Nutritional Intake by Meal Time Zone in Geriatric Patients Is Related to Nutritional Assessment Index
Figure
Tables
| Grade defined by the long-term care insurance act | Mild ← Breakdown → Severe | ||||||
|---|---|---|---|---|---|---|---|
| Assistance required 1 | Assistance required 2 | Nursing care required 1 | Nursing care required 2 | Nursing care required 3 | Nursing care required 4 | Nursing care required 5 | |
| Grade assigned in this study | 1 | 2 | 3 | 4 | 5 | 6 | 7 |
| Data are expressed as mean ± standard deviation. Inside is quartile. The main diseases for admission included chronic heart failure, bronchial pneumonia, chronic obstructive pulmonary disease, and type 2 diabetes; however, these conditions had been treated in the acute care hospital, and thus, patients’ condition became stable. Alb: serum albumin; FPG: fasting plasma glucose; BUN: blood urea nitrogen; Cr: creatinine; eGFR: estimated glomerular filtration rate; BW: body weight. GNRI: geriatric nutritional risk index; PNI: prognostic nutritional index; CONUT: controlling nutritional status; NPC/N: nonprotein caloric/nitrogen. | ||
| Number of patients (male/female) | 52 (33/19) | |
| Age (years) | 79.7 ± 8.7 | (75.0 - 86.0) |
| Body mass index (kg/m2) | 21.2 ± 4.0 | (17.8 - 24.4) |
| Charlson Comorbidity Index (score) | 2.4 ± 1.3 | (2.0 - 3.0) |
| Duration of hospitalization (days) | 52.6 ± 36.7 | (27.8 - 64.8) |
| Alb (g/dL) | 3.4 ± 0.5 | (3.0 - 3.8) |
| FPG (mg/dL) | 101.1 ± 24.1 | (89 - 106) |
| BUN (mg/dL) | 20.2 ± 11.8 | (13.0 - 22.5) |
| Cr (mg/dL) | 1.0 ± 0.6 | (0.67 - 1.18) |
| eGFR (mL/min/1.73 m2) | 60.9 ± 24.7 | (42.4 - 72.4) |
| GNRI (score) | 91.0 ± 12.5 | (84.1 - 97.9) |
| PNI (score) | 41.6 ± 5.9 | (38.7 - 45.8) |
| CONUT (score) | 3.7 ± 2.2 | (2.8 - 4.5) |
| Not approved for nursing care service, n | 7 | |
| Approved for nursing care service, n | 45 | |
| Breakdown | ||
| Assistance required 1, n | 1 | |
| Assistance required 2, n | 3 | |
| Nursing care required 1, n | 7 | |
| Nursing care required 2, n | 16 | |
| Nursing care required 3, n | 6 | |
| Nursing care required 4, n | 6 | |
| Nursing care required 5, n | 6 | |
| Nutrient intake | ||
| Energy intake (kcal/BW kg/day) | 33.0 ± 8.4 | (26.1 - 37.2) |
| Breakfast (kcal/BW kg/day) | 10.3 ± 2.6 | (8.4 - 12.4) |
| Lunch (kcal/BW kg/day) | 11.5 ± 3.1 | (9.3 - 12.8) |
| Dinner (kcal/BW kg/day) | 11.1 ± 3.0 | (8.6 - 13.5) |
| Protein intake (g/BW kg/day) | 1.2 ± 0.3 | (1.0 - 1.4) |
| Breakfast (g/BW kg/day) | 0.3 ± 0.1 | (0.3 - 0.4) |
| Lunch (g/BW kg/day) | 0.4 ± 0.1 | (0.4 - 0.5) |
| Dinner (g/BW kg/day) | 0.5 ± 0.1 | (0.4 - 0.6) |
| Fat intake (g/BW kg/day) | 0.9 ± 0.3 | (0.7 - 1.1) |
| Breakfast (g/BW kg/day) | 0.3 ± 0.1 | (0.2 - 0.4) |
| Lunch (g/BW kg/day) | 0.3 ± 0.1 | (0.2 - 0.3) |
| Dinner (g/BW kg/day) | 0.3 ± 0.1 | (0.2 - 0.4) |
| Carbohydrate intake (g/BW kg/day) | 5.0 ± 1.3 | (4.0 - 5.7) |
| Breakfast (g/BW kg/day) | 1.5 ± 0.4 | (1.2 - 1.7) |
| Lunch (g/BW kg/day) | 1.8 ± 0.5 | (1.4 - 2.1) |
| Dinner (g/BW kg/day) | 1.7 ± 0.5 | (1.3 - 2.0) |
| NPC/N mean | 140.6 ± 10.6 | (135.2 - 148.3) |
| Breakfast | 163.6 ± 16.1 | (150.6 - 177.2) |
| Lunch | 139.1 ± 16.7 | (129.1 - 152.8) |
| Dinner | 126.1 ± 10.8 | (121.4 - 131.4) |
| Breakfast | Lunch | Dinner | Mean | |
|---|---|---|---|---|
| Data are expressed as mean ± standard deviation. | ||||
| Ratio to daily intake of each nutrient (%) | ||||
| Energy intake | 31.3 ± 2.7 | 34.9 ± 1.8 | 33.8 ± 2.3 | - |
| Protein intake | 27.6 ± 2.7 | 35.4 ± 2.4 | 37.0 ± 2.6 | - |
| Fat intake | 34.5 ± 5.4 | 32.2 ± 4.3 | 33.3 ± 4.3 | - |
| Carbohydrate intake | 30.9 ± 3.0 | 36.0 ± 2.0 | 33.1 ± 2.2 | - |
| Energy ratio of each nutrient (%) | ||||
| Protein/energy ratio | 13.5 ± 2.0 | 16.3 ± 2.0 | 17.5 ± 2.1 | 15.8 ± 1.5 |
| Fat/energy ratio | 27.7 ± 6.0 | 24.3 ± 4.7 | 26.3 ± 4.2 | 25.8 ± 3.7 |
| Carbohydrate/energy ratio | 59.7 ± 6.9 | 59.3 ± 5.7 | 56.2 ± 5.7 | 58.5 ± 4.4 |
| Menu characteristics | The main staple provided is bread or porridge, the side dishes provided are milk, fruits (fresh or canned food/jelly) and sides (vegetable dishes). In addition, bread comes with jam and butter, and porridge comes with seaweed/pickled plum paste. | Set menu of rice or porridge as the main staple, and a main dish with 2 - 3 sides as the side dishes. Eggs/fish/meat, soy products and vegetables/fruits are used as the ingredients. Noodles or special menu are provided at lunch. | ||
| Nutrient intake ratio | Dietary pattern | ||
|---|---|---|---|
| First factor | Second factor | Third factor | |
| *|load| > 0.300 were considered as an important factor (in module). En: energy; Pro: protein; Carb: carbohydrate. | |||
| Breakfast | |||
| En ratio | -0.425* | -0.074 | 0.127 |
| Pro ratio | -0.338* | 0.171 | -0.249 |
| Fat ratio | -0.323* | 0.134 | -0.367* |
| Carb ratio | -0.303* | -0.201 | 0.417* |
| Lunch | |||
| En ratio | 0.327* | -0.327* | -0.211 |
| Pro ratio | 0.200 | -0.435* | -0.046 |
| Fat ratio | 0.224 | -0.343* | 0.170 |
| Carb ratio | 0.270 | -0.156 | -0.432* |
| Dinner | |||
| En ratio | 0.287 | 0.430* | 0.026 |
| Pro ratio | 0.235 | 0.264 | 0.394* |
| Fat ratio | 0.236 | 0.200 | 0.368* |
| Carb ratio | 0.213 | 0.417* | -0.244 |
| Variance explained by each factor (eigenvalue) | 2.278 | 1.733 | 1.512 |
| Proportion of variance (%) | 43.2 | 25.0 | 19.1 |
| Cumulative proportion (%) | 43.2 | 68.2 | 87.3 |
| Regression coefficient | Standard error | t value | P value | |
|---|---|---|---|---|
| *P < 0.05 (n = 52). | ||||
| Age | -0.010 | 0.012 | -0.833 | 0.410 |
| Sex | 0.162 | 0.165 | 0.984 | 0.331 |
| Grade assigned in this study | -0.040 | 0.046 | -0.860 | 0.395 |
| First factor | -0.048 | 0.036 | -1.320 | 0.194 |
| Second factor | -0.100 | 0.045 | -2.228 | 0.032* |
| Third factor | -0.014 | 0.051 | -0.274 | 0.786 |