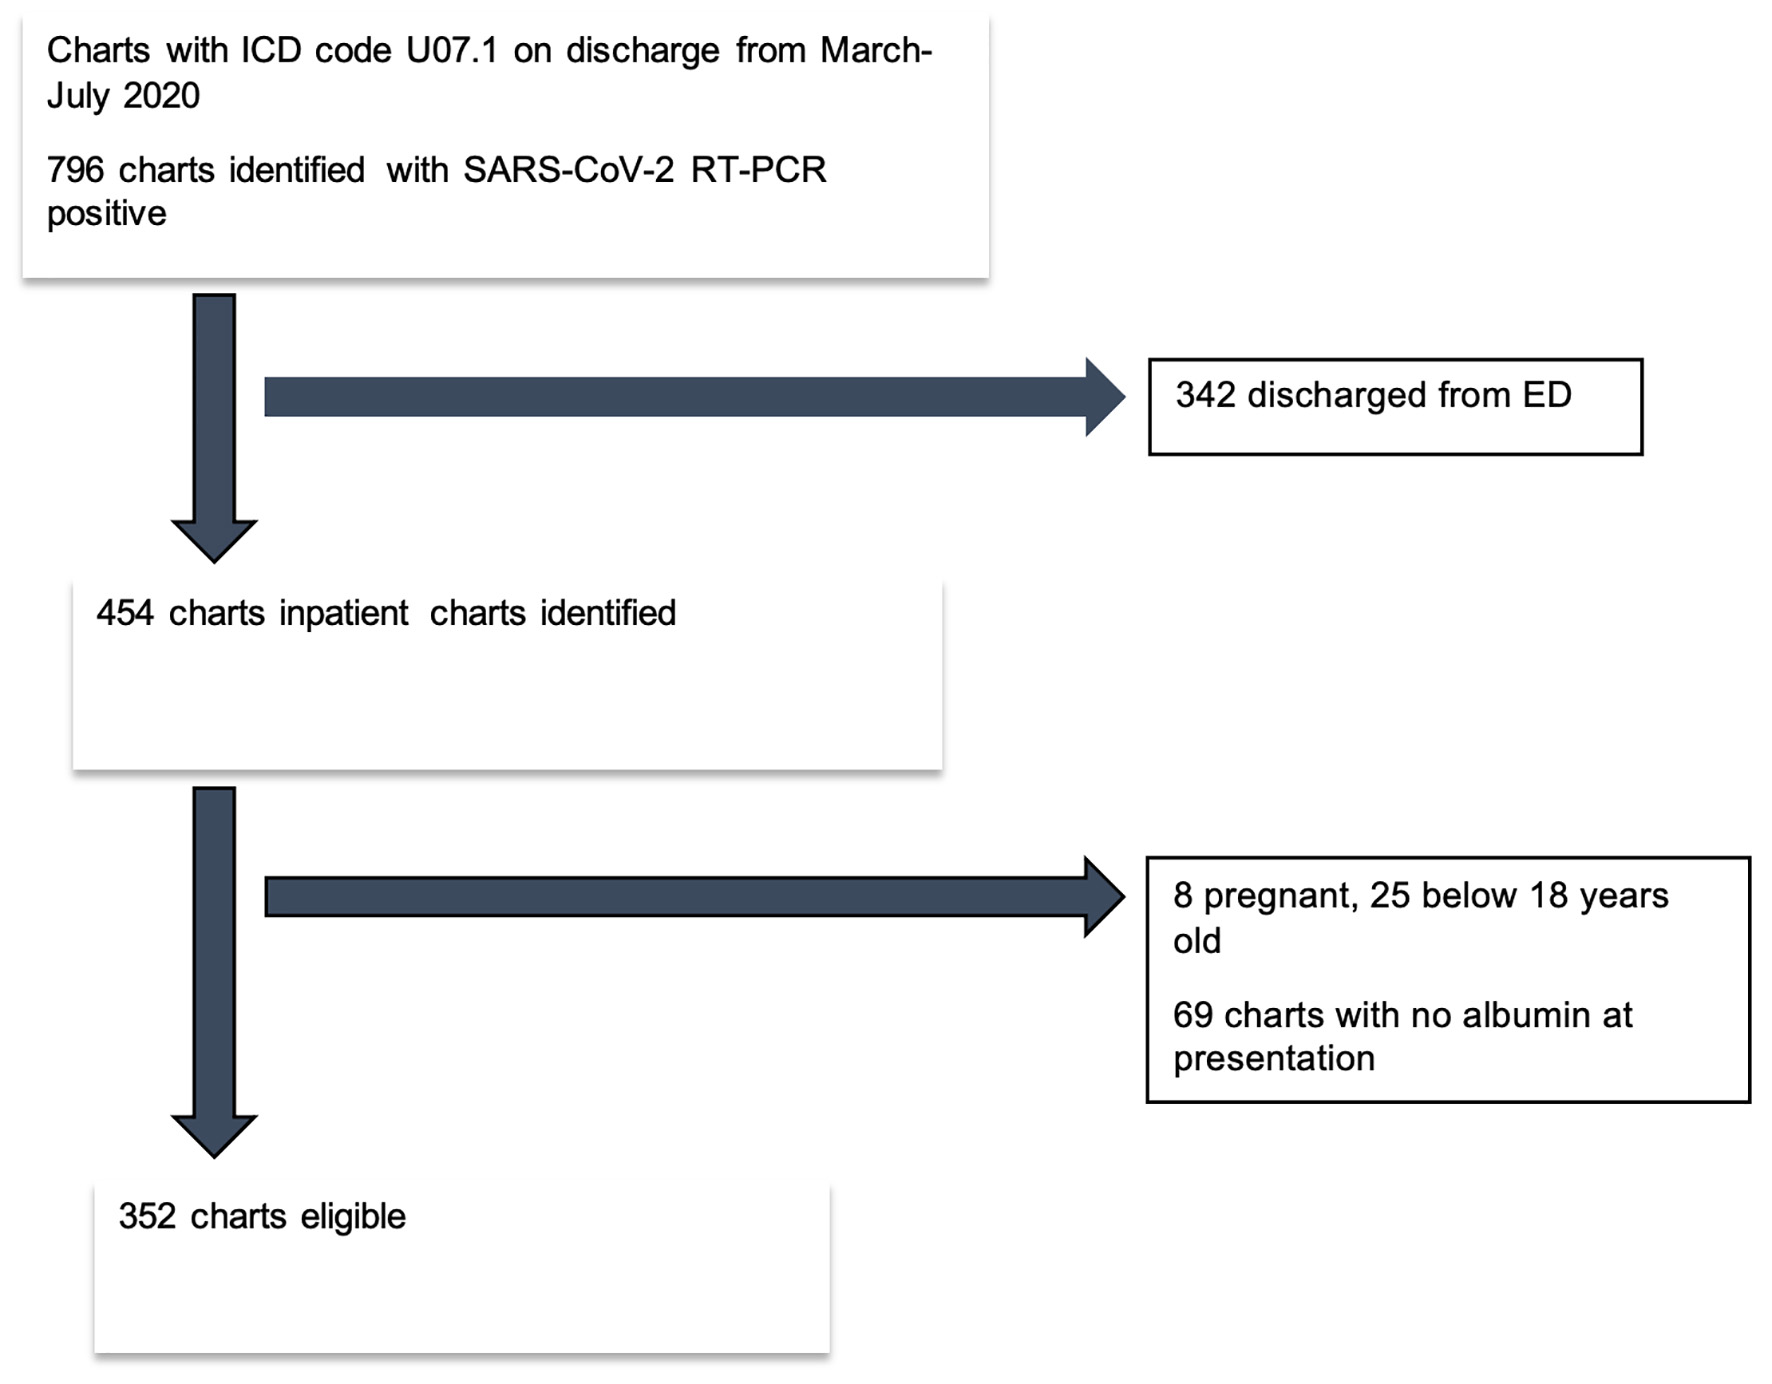
Figure 1. Flow diagram of eligible patient selection. RT-PCR: reverse transcriptase polymerase chain reaction; SARS-CoV-2: severe respiratory syndrome coronavirus 2.
| Journal of Clinical Medicine Research, ISSN 1918-3003 print, 1918-3011 online, Open Access |
| Article copyright, the authors; Journal compilation copyright, J Clin Med Res and Elmer Press Inc |
| Journal website https://www.jocmr.org |
Original Article
Volume 13, Number 5, May 2021, pages 258-267
Low Serum Albumin Predicts Severe Outcomes in COVID-19 Infection: A Single-Center Retrospective Case-Control Study
Figure
Tables
| Study variables | Definitions |
|---|---|
| Coronavirus disease 2019 (COVID-19) patients | Severe acute respiratory syndrome coronavirus 2 (SARS-CoV-2) detected on reverse transcriptase-polymerase chain reaction (RT-PCR) of nasopharyngeal swab |
| Hypoalbuminemia (low albumin) | Serum albumin less than 3.5 g/dL |
| Mild low albumin | Serum albumin 2.5 - 3.4 g/dL |
| Very low albumin | Serum albumin less than 2.5 g/dL |
| Composite outcome (at least one of the following complications | Death, acute encephalopathy, acute kidney injury, the requirement of new renal replacement therapy, acute hypercoagulability, acute circulatory failure, new-onset heart failure, acute cardiac injury, acute arrhythmia, ARDS, high flow oxygen support, intensive care unit (ICU) stay, mechanical ventilation. |
| Death | Death due to any cause within 21 days |
| Chronic kidney disease (CKD) | Glomerular filtration rate < 60 mL/min (CKD 3-5) |
| Smoking | Active smoker with > 100 cigarettes smoking in lifetime |
| Alcohol dependency | Men ≥ 15 drinks/week; female ≥ 8 drinks/week |
| Malignancy | Cancer patient getting active treatment or finished treatment within 6 months |
| Onset of symptoms | First day of onset of symptoms to presentation to hospital in days |
| Use of one of the following medicines | Tocilizumab, remdesivir, dexamethasone and/or convalescent plasma |
| Secondary infection (one of the following) | Procalcitonin level > 0.5; lactic acid > 2.0; positive blood; urine; body fluid; respiratory secretion culture |
| Quick sequential organ failure assessment (qSOFA) | Altered mental status, respiratory rate ≥ 22/min, systolic blood pressure ≤ 100 mm Hg |
| Acute kidney injury | Increase in serum creatinine by 0.3 mg/dL or more within 48 h or increase in serum creatinine to 1.5 times baseline or more within the last 7 days |
| New renal replacement therapy (RRT) | The requirement of new RRT within 21 days in patients who were not dialysis-dependent |
| Acute encephalopathy | Worsening of alertness and awareness compared to baseline, and/or change in mental status |
| Acute liver injury | Development of severe acute liver injury (aspartate aminotransferase (AST) or alanine aminotransferase (ALT) > 5 times normal) with encephalopathy and impaired synthetic function (INR of ≥ 1.5) in a patient without cirrhosis or preexisting liver disease |
| Acute hypercoagulability | D-dimer level > 0.5 ng/mL |
| Stroke | New focal neurological deficit and/or radiological evidence in computed tomography (CT) or magnetic resonance imaging (MRI) |
| Acute circulatory failure | Systolic blood pressure (SBP) less than 90 mm Hg and/or requiring pressure support |
| Acute cardiac injury | Increase in serum troponin value of > 0.015 in two occasions 6 h apart, and or ST-segment elevation or depression in electrocardiogram (EKG) |
| Arrhythmia | New-onset rhythm disorder proven on 12-lead EKG on two separate occasions |
| New-onset heart failure | New-onset systolic or diastolic heart failure on echocardiogram |
| Acute respiratory distress syndrome (ARDS) | The PaO2/FiO2 ≤ 300 mm Hg, on ventilator settings that include positive end-expiratory pressure (PEEP) or continuous positive airway pressure (CPAP) ≥ 5 cm H2O. |
| High flow oxygen support | Requiring high flow oxygen of 15 L or more to maintain an oxygen saturation of 92% or more |
| New-onset oxygen dependency | Any amount of supplemental oxygen required to maintain an oxygen saturation of 92% and above on discharge |
| Physical debility | Discharge to a skilled nursing facility or rehabilitation center |
| Obesity | Body mass index (BMI) of 30.0 or higher |
| Abbreviations | Full forms | Normal ranges and units (where applicable) |
|---|---|---|
| AKI | Acute kidney injury | |
| Albumin | 3.5 - 5.0 g/dL | |
| ALT | Alanine aminotransferase | 12 - 78 U/L |
| AMS | Altered mental status | |
| AST | Aspartate aminotransferase | 15 - 37 U/L |
| CAD | Coronary artery disease | |
| CHF | Congestive heart failure | |
| CKD | Chronic kidney disease | |
| COPD | Chronic obstructive pulmonary disease | |
| COVID-19 | Coronavirus disease 2019 | |
| CRP | C-reactive protein | < 3 mg/L |
| D-dimer | 0.9 - 0.5 mg/dL | |
| DM | Diabetes mellitus | |
| ESR | Erythrocyte sedimentation rate | 0 - 15 mm/h |
| ESRD on HD | End-stage renal disease on hemodialysis | |
| Ferritin | 26 - 388 ng/mL | |
| HIV | Human immunodeficiency virus | |
| HTN | Hypertension | |
| IL-6 | Interleukin-6 | 0 - 13 pg/mL |
| INR | International normalized ratio | |
| Lactic acid | 0.4 - 2 mmol/L | |
| LDH | Lactate dehydrogenase | 87 - 241 U/L |
| LO | Length of | |
| Lymphocyte | 0.9 - 2.9 × 10³/µL | |
| Neutrophil | 1.7 - 7 × 10³/µL | |
| NL ratio | Neutrophil to lymphocyte ratio | |
| Platelets | 150 - 450 × 103/µL | |
| Procalcitonin | 0.07 - 0.5 ng/mL | |
| qSOFA | Quick sequential organ failure assessment | |
| RT-PCR | Reverse transcriptase-polymerase chain reaction | |
| SARS-CoV-2 | Severe acute respiratory syndrome coronavirus 2 | |
| SOB | Shortness of breath |
| NSA vs. LSA group (primary group) | MLA vs. VLA group (subgroup) | |||||
|---|---|---|---|---|---|---|
| NSA (n = 42) | LSA (n = 310) | P-value | MLA (albumin 2.5 - 3.4, n = 249) | VLA (albumin < 2.5, n = 61) | P-value | |
| *Significant P-values. NSA: normal serum albumin; LSA: low serum albumin; MLA: medium low albumin; VLA: very low albumin; m: mean; SD: standard deviation; n: number; CKD: chronic kidney disease; ESRD: end-stage renal disease; HD: hemodialysis; COPD: chronic obstructive pulmonary disease; CHF: congestive heart disease; CAD: coronary artery disease; HIV: human immunodeficiency virus; SOB: shortness of breath; AMS: altered mental status; ESR: erythrocyte sedimentation rate; CRP: C-reactive protein; NL: neutrophil to lymphocyte; IL-6: interleukin-6; LDH: lactate dehydrogenase. | ||||||
| Age, m (SD) | 56.76 (16.18) | 55.67 (18.23) | 0.68 | 55.91 (18.90) | 54.68 (15.26) | 0.59 |
| Female, n (%) | 18 (42.86) | 150 (48.39) | 0.50 | 109 (43.78) | 41 (67.21) | 0.001* |
| Race | 0.48 | 0.01* | ||||
| White, n (%) | 10 (23.81) | 73 (23.55) | 49 (19.76) | 23 (37.70) | ||
| African American, n (%) | 24 (57.14) | 152 (49.03) | 126 (50.81) | 26 (42.62) | ||
| Others, n (%) | 8 (196.05) | 85 (27.42) | 73 (29.44) | 12 (19.67) | ||
| Comorbid conditions | ||||||
| Diabetes mellitus, n (%) | 20 (47.62) | 111 (35.81) | 0.13 | 95 (38.15) | 16 (26.23) | 0.08 |
| Hypertension, n (%) | 34 (80.95) | 191 (61.61) | 0.014* | 155 (62.25) | 36 (59.02) | 0.64 |
| CKD, n (%) | 15 (35.71) | 53 (17.10) | 0.004* | 41 (16.47) | 12 (19.67) | 0.55 |
| ESRD on HD, n (%) | 5 (11.90) | 21 (6.77) | 0.23 | 18 (7.23) | 3 (4.92) | 0.52 |
| COPD, n (%) | 4 (9.52) | 31 (10) | 0.92 | 25 (10.04) | 6 (9.84) | 0.96 |
| Other lung diseases, n (%) | 5 (11.90) | 47 (15.21) | 0.57 | 36 (14.52) | 11 (18.03) | 0.49 |
| CHF, n (%) | 7 (16.67) | 37 (11.94) | 0.38 | 29 (11.65) | 8 (13.11) | 0.75 |
| CAD, n (%) | 11 (26.19) | 55(17.74) | 0.18 | 45 (18.07) | 10 (16.39) | 0.75 |
| HIV, n (%) | 1 (2.38) | 6 (1.94) | 0.84 | 1 (0.40) | 5 (8.20) | < 0.001* |
| Malignancy, n (%) | 6 (14.29) | 24 (7.74) | 0.15 | 19 (7.63) | 5 (8.20) | 0.88 |
| Smoking, n (%) | 11 (26.19) | 55 (18.52) | 0.24 | 39 (16.53) | 16 (26.23) | 0.082 |
| Alcohol dependency, n (%) | 4 (9.52) | 22 (7.10) | 0.53 | 19 (7.63) | 3 (4.92) | 0.46 |
| Obesity, n (%) | 18 (42.86) | 161 (51.94) | 0.26 | 129 (51.81) | 32 (52.46) | 0.92 |
| Cirrhosis, n (%) | 1 (2.38) | 5 (1.62) | 0.72 | 4 (1.61) | 1 (1.64) | 0.98 |
| Symptoms | ||||||
| Onset of symptoms (days), m (SD) | 4.11 (3.6) | 5.62 (4.97) | 0.018* | 5.52 (5.03) | 5.98 (4.76) | 0.51 |
| Fever, n (%) | 27 (64.29) | 182 (58.90) | 0.50 | 146 (58.63) | 36 (59.02) | 0.95 |
| Cough, n (%) | 31 (73.81) | 194 (62.78) | 0.16 | 150 (60.24) | 44 (72.13) | 0.085 |
| SOB, n (%) | 25 (59.52) | 198 (64.08) | 0.56 | 152 (61.04) | 47 (77.05) | 0.019* |
| Diarrhea, n (%) | 6 (14.29) | 33 (10.68) | 0.48 | 21 (8.43) | 13 (21.31) | 0.004* |
| AMS, n (%) | 6 (14.29) | 35 (11.33) | 0.57 | 31 (12.45) | 4 (6.56) | 0.192 |
| Chest pain, n (%) | 12 (28.57) | 39 (12.66) | 0.006* | 30 (12.10) | 9 (14.75) | 0.57 |
| Others, n (%) | 12 (28.57) | 74 (47.13) | 0.026* | 74 (47.13) | 15 (24.59) | 0.002* |
| Laboratory results | ||||||
| Albumin (g/dL), m (SD) | 3.77 (0.28) | 2.84 (0.41) | < 0.001* | 3.01 (0.24) | 2.15 (0.24) | < 0.001* |
| ESR (mm/h), m (SD) | 24 (15.52) | 57.90 (34.24) | < 0.001* | 53.43 (34.40) | 72.21 (29.30) | 0.010* |
| CRP (mg/L), m (SD) | 35.02 (43.28) | 84.32 (60.49) | < 0.001* | 81.33 (60.62) | 101.21 (64.27) | 0.043* |
| Neutrophil (× 103/µL), m (SD) | 3.65 (2.24) | 5.99 (4.05) | < 0.001* | 5.45 (3.18) | 8.35 (6.87) | 0.005* |
| Lymphocyte (× 103/µL), m (SD) | 1.38 (0.91) | 1.14 (0.70) | 0.21 | 1.21 (0.74) | 0.89 (0.45) | < 0.001* |
| NL ratio, m (SD) | 3.94 (3.68) | 6.88 (6.74) | 0.001* | 6.28 (6.75) | 8.87 (6.23) | 0.011* |
| Platelets (× 103/µL), m (SD) | 220.90 (73.77) | 233.51 (90.11) | 0.83 | 217.86 (82.40) | 245.48 (114.16) | 0.07 |
| Ferritin (ng/mL), m (SD) | 571.83 (961.77) | 925.69 (2,012.85) | 0.14 | 744.46 (1,150.94) | 1,650.90 (3,696.46) | 0.073 |
| IL-6 (pg/mL), m (SD) | 92.87 (161.77) | 244.18 (533.03) | 0.032* | 200 (433.68) | 352.87 (601.61) | 0.20 |
| LDH (U/L), m (SD) | 287.85 (148.17) | 398.79 (377.32) | 0.007* | 367.92 (166.65) | 515.76 (752.83) | 0.16 |
| NSA vs. LSA group (primary group) | MLA vs. VLA group (subgroup) | |||||
|---|---|---|---|---|---|---|
| NSA (n = 42) | LSA (n = 310) | P-value | MLA (albumin 2.5 - 3.4, n = 249) | VLA (albumin < 2.5, n = 61) | P-value | |
| *Significant P-values. NSA: normal serum albumin; LSA: low serum albumin; MLA: medium low albumin; VLA: very low albumin; m: mean; SD: standard deviation; n: number; qSOFA: quick sequential organ failure assessment; AKI: acute kidney injury; CVA: cerebrovascular accident; HD: hemodialysis; INR: international normalized ratio; AST: aspartate aminotransferase; ALT: alanine aminotransferase; ARDS: acute respiratory distress syndrome; LO: length of; ICU: intensive care unit. | ||||||
| Composite outcome, n (%) | 17 (6.12) | 261 (93.88) | < 0.001* | 202 (81.12) | 59 (96.72) | 0.003* |
| Death, n (%) | 1 (2.38) | 43 (13.87) | 0.035* | 24 (9.64) | 19 (31.15) | < 0.001* |
| Tocilizumab, n (%) | 4 (9.52) | 73 (23.62) | 0.038* | 51 (20.48) | 22 (36.07) | 0.010* |
| Remdesivir, n (%) | 1 (2.38) | 71 (22.98) | 0.002* | 54 (21.69) | 17 (27.87) | 0.30 |
| Dexamethasone, n (%) | 10 (23.81) | 106 (34.30) | 0.17 | 87 (34.94) | 19 (31.67) | 0.63 |
| Convalescent plasma, n (%) | 2 (4.76) | 35 (11.33) | 0.194 | 22 (8.84) | 13 (21.31) | 0.006* |
| qSOFA 2-3, n (%) | 3 (7.14) | 68 (21.94) | 0.025* | 50 (20.08) | 18 (29.51) | 0.11 |
| Acute circulatory failure, n (%) | 1 (2.38) | 64 (20.65) | 0.004* | 43 (17.27) | 21 (34.43) | 0.003* |
| Secondary infection | ||||||
| Procalcitonin > 0.5 ng/mL, n (%) | 3 (9.09) | 96 (35.29) | 0.002* | 62 (28.57) | 35 (63.64) | < 0.001* |
| Lactic acid > 2 mmol/L, n (%) | 4 (15.38) | 53 (20.08) | 0.56 | 38 (17.92) | 16 (30.77) | 0.04* |
| Blood culture, n (%) | 0 (0) | 19 (7.12) | 0.138 | 12 (5.53) | 8 (16) | 0.011* |
| Urine culture, n (%) | 0 (0) | 16 (9.25) | 0.146 | 13 (8.97) | 4 (14.29) | 0.38 |
| Body fluid culture, n (%) | 1 (4.55) | 6 (6.41) | 0.97 | 5 (4.39) | 1 (4.55) | 0.97 |
| Respiratory secretion culture, n (%) | 7 (26.92) | 47 (24.35) | 0.77 | 38 (23.75) | 9 (27.27) | 0.66 |
| AKI, n (%) | 6 (14.28) | 133 (43.36) | 0.004* | 95 (38.30) | 38 (62.29) | 0.002* |
| Requiring new HD, n (%) | 1 (2.38) | 17 (5.52) | 0.38 | 5 (2.02) | 12 (19.67) | < 0.001* |
| INR > 1.5 | 0 (0) | 22 (8.83) | 0.34 | 13 (6.63) | 9 (16.98) | 0.071 |
| AST or ALT > 5 times normal | 2 (4.76) | 32 (10.49) | 0.24 | 19 (7.79) | 13 13 (21.31) | 0.002* |
| Acute hypercoagulability | < 0.001* | < 0.001* | ||||
| D-dimer > 1 mg/dL, n (%) | 7 (21.21) | 132 (50.96) | 92 (44.66) | 40 (75.47) | ||
| D-dimer 0.5 - 1 mg/dL, n (%) | 3 (9.09) | 62 (23.90) | 55 (26.70) | 7 (13.21) | ||
| Acute encephalopathy, n (%) | 3 (7.14) | 71 (22.90) | 0.019* | 48 (19.28) | 23 (37.70) | 0.002* |
| Cerebrovascular accident, n (%) | 0 (0) | 0 (0) | n/a | 0 (0) | 0 (0) | n/a |
| Acute cardiac injury, n (%) | 3 (7.32) | 89 (29.87) | 0.002* | 67 (28.03) | 22 (37.29) | 0.164 |
| New-onset heart failure, n (%) | 1 (2.44) | 13 (4.22) | 0.58 | 9 (3.63) | 4 (6.67) | 0.29 |
| New-onset arrhythmia, n (%) | 4. (9.76) | 34 (10.97) | 0.81 | 21 (8.43) | 13 (21.31) | 0.004* |
| ARDS, n (%) | 1 (2.27) | 60 (20.98) | 0.008* | 34 (15.04) | 26 (43.33) | < 0.001* |
| Mechanical ventilation, n (%) | 1 (2.38) | 41 (13.27) | 0.041* | 23 (9.27) | 18 (29.51) | < 0.001* |
| Requiring > 3 L O2, n (%) | 8 (19.05) | 166 (53.55) | < 0.001* | 117 (46.99) | 49 (80.33) | < 0.001* |
| Requiring > 15 L high flow O2, n (%) | 4 (9.52) | 88 (28.39) | 0.009* | 57 (22.89) | 31 (50.82) | < 0.001* |
| New-onset oxygen dependency, n (%) | 1 (2.38) | 41 (13.80) | 0.035* | 27 (11.20) | 14 (25) | 0.007* |
| LO stay (days), m (SD) | 4.16 (5.55) | 9.32 (9.70) | < 0.001* | 8.14 (8.53) | 14.18 (12.40) | < 0.001* |
| LO ICU stay (days), m (SD) | 0.24 (1.56) | 1.96 (5.59) | < 0.001* | 1.4 (4.9) | 4.24 (7.44) | 0.005* |
| LO mechanical vent (days), m (SD) | 0.24 (1.56) | 1.60 (4.96) | < 0.001* | 1.13 (4.16) | 3.59 (7.13) | 0.01* |
| Physical debility (days), n (%) | 3 (7.32) | 75 (24.51) | 0.013* | 56 (22.67) | 19 (32.20) | 0.12 |
| Discharged, n (%) | 41 (97.62) | 270 (87.10) | 0.046* | 221 (88.76) | 49 (80.33) | 0.078* |
| Readmission, n (%) | 5 (11.90) | 47 (15.16) | 0.57 | 38 (15.26) | 9 (14.75) | 0.92 |
| Univariate analysis | Multivariate analysisa | |||||
|---|---|---|---|---|---|---|
| Odds ratio | 95% CI | P-value | Odds ratio | 95% CI | P-value | |
| *Significant P-values. aControlled for age; sex; race; diabetes mellitus; hypertension; chronic kidney disease; end-stage renal disease on hemodialysis; chronic obstructive pulmonary disease; other lung diseases; congestive heart failure; coronary artery disease; human immunodeficiency virus infection; malignancy; smoking; alcohol dependency; obesity; and cirrhosis. NSA: normal serum albumin; LSA: low serum albumin; MLA: medium low albumin; VLA: very low albumin; CI: confidence interval. | ||||||
| Main group (LSA vs. NSA) | 7.83 | 3.94 - 15.58 | < 0.001* | 10.88 | 4.74 - 24.97 | < 0.001* |
| Subgroup (VLA vs. MLA) | 6.86 | 1.62 - 29.10 | 0.009* | 7.94 | 1.70 - 37.14 | 0.009* |
| Outcome | Normal vs. low albumin group (primary group) | Medium low vs. very low albumin group (subgroup) | ||||
|---|---|---|---|---|---|---|
| Odds ratio | 95% CI | P-value | Odds ratio | 95% CI | P-value | |
| MV controlled for age; sex; race; diabetes mellitus (DM); hypertension (HTN); chronic kidney disease (CKD); end-stage renal disease (ESRD) on hemodialysis (HD); chronic obstructive pulmonary disease (COPD); other lung diseases; congestive heart failure (CHF); coronary artery disease (CAD); human immunodeficiency virus (HIV) infection; malignancy; smoking; alcohol dependency; obesity; and cirrhosis. *Significant P-values. MV: multivariate; CI: confidence interval. | ||||||
| Albumin level (lower ref to higher) | 10.88 | 4.74 - 24.97 | < 0.001* | 7.94 | 1.70 - 37.14 | 0.009* |
| Age | 1.00 | 0.98 - 1.02 | 0.56 | 0.99 | 0.91 - 1.02 | 0.81 |
| Sex | 0.77 | 0.41 - 1.47 | 0.44 | 1.5 | 0.71 - 3.18 | 0.27 |
| Race | ||||||
| White | 0.37 | 0.16 - 0.82 | 0.015* | 1.77 | 0.59 - 5.32 | 0.30 |
| Others | 0.73 | 0.33 - 1.63 | 0.45 | 1.16 | 0.49 - 2.71 | 0.72 |
| Smoking | 1.93 | 0.81 - 4.5 | 0.13 | 0.52 | 0.20 - 1.33 | 0.17 |
| DM | 0.61 | 0.32 - 1.19 | 0.15 | 1.12 | 0.52 - 2.40 | 0.76 |
| HTN | 1.04 | 0.46 - 2.36 | 0.91 | 0.38 | 0.14 - 1.04 | 0.06 |
| CKD | 0.54 | 0.22 - 1.32 | 0.18 | 2.04 | 0.66 - 6.32 | 0.21 |
| ESRD on HD | 1.11 | 0.30 - 4.11 | 0.86 | 0.38 | 0.08 - 1.69 | 0.20 |
| COPD | 0.41 | 0.13 - 1.21 | 0.1 | 1.30 | 0.34 - 4.92 | 0.69 |
| CHF | 1.40 | 0.45 - 4.32 | 0.55 | 4.78 | 1.06 - 21.38 | 0.041* |
| CAD | 0.67 | 0.26 - 1.72 | 0.40 | 0.75 | 0.26 - 2.16 | 0.60 |
| HIV | 1.46 | 0.14 - 14.93 | 0.74 | 1 | ||
| Malignancy | 11.34 | 2.05 - 62.64 | 0.005* | 0.78 | 0.20 - 2.99 | 0.72 |
| Alcohol dependency | 1.58 | 0.40 - 6.19 | 0.50 | 3.35 | 0.62 - 17.86 | 0.15 |
| Obesity | 0.66 | 0.35 - 2.14 | 0.22 | 0.66 | 0.31 - 1.39 | 0.28 |
| Other lung disease | 0.87 | 0.35 - 2.14 | 0.77 | 0.31 | 0.12 - 0.78 | 0.014* |
| Cirrhosis | 0.06 | 0.08 - 0.57 | 0.014* | 1.45 | 0.09 - 22.22 | 0.78 |