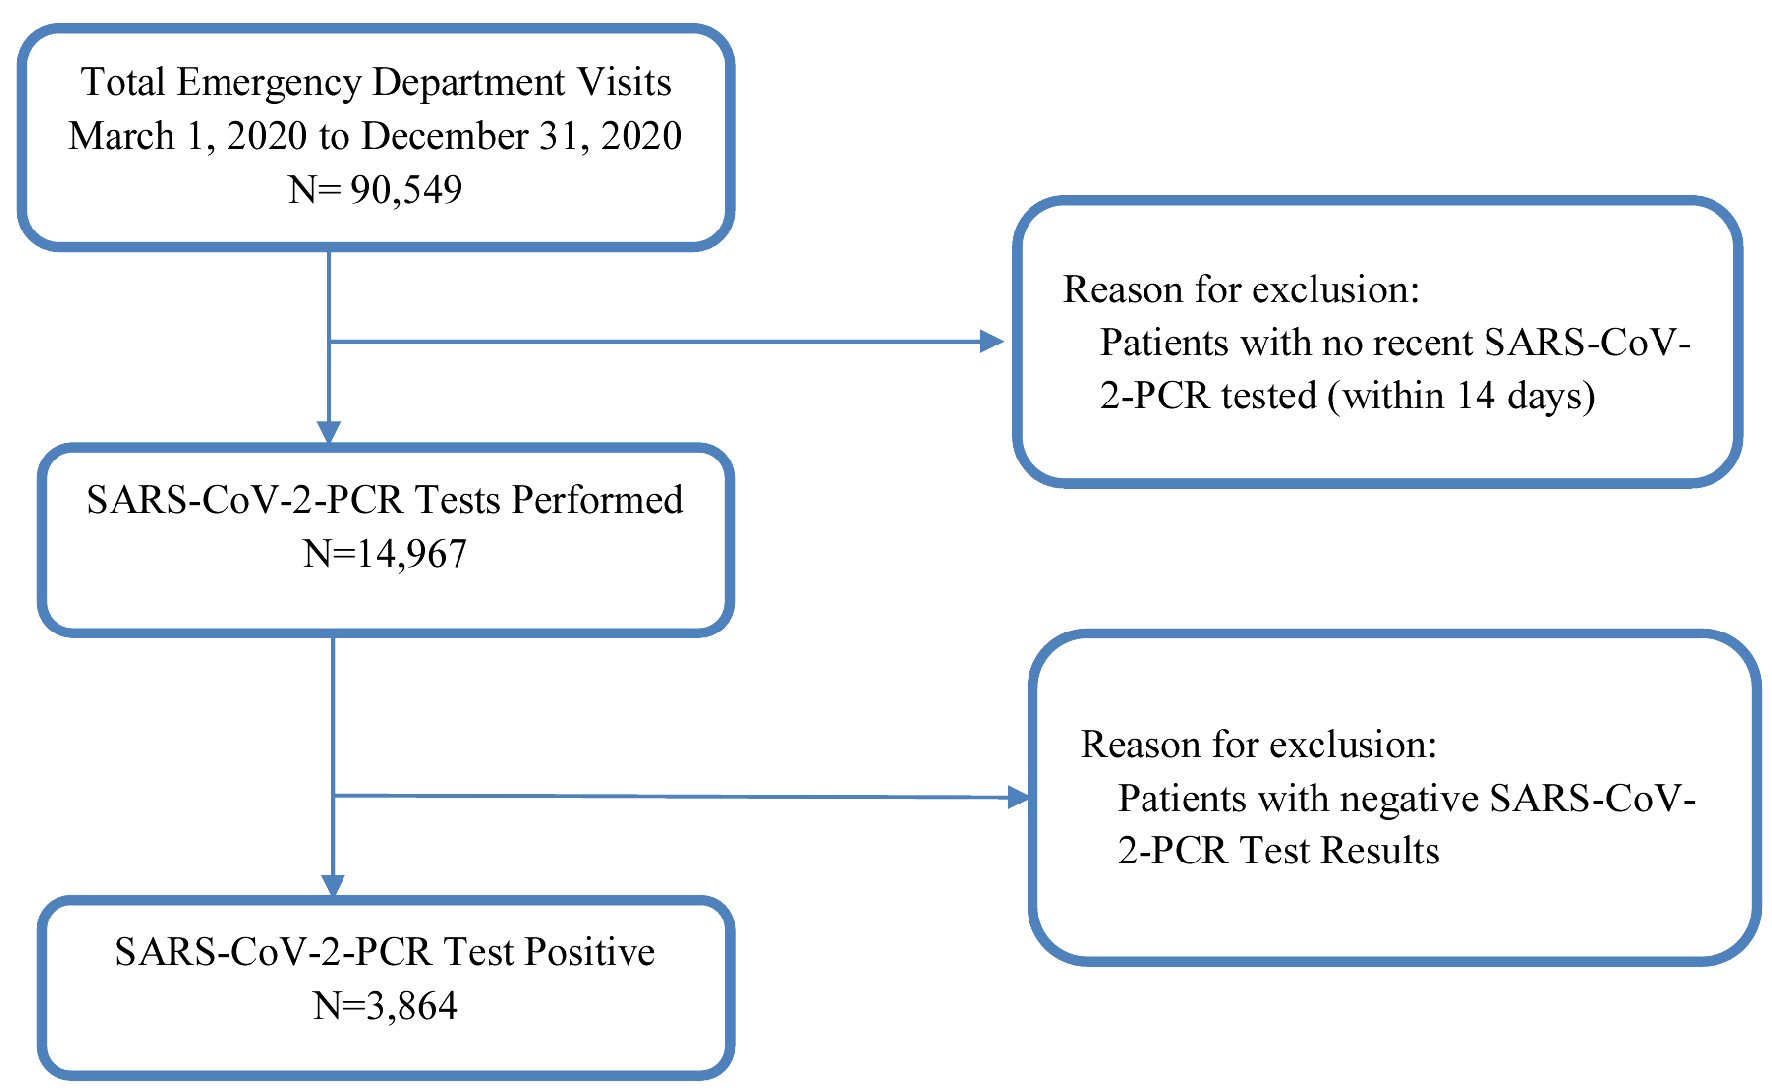
Figure 1. Study flow diagram. SARS-CoV-2: severe acute respiratory syndrome coronavirus 2; PCR: polymerase chain reaction.
| Journal of Clinical Medicine Research, ISSN 1918-3003 print, 1918-3011 online, Open Access |
| Article copyright, the authors; Journal compilation copyright, J Clin Med Res and Elmer Press Inc |
| Journal website https://www.jocmr.org |
Original Article
Volume 13, Number 4, April 2021, pages 237-244
A Simplified Comorbidity Evaluation Predicting Clinical Outcomes Among Patients With Coronavirus Disease 2019
Figures
Tables
| CCC | CCI | ECI | |
|---|---|---|---|
| CCCs (0 - 11): each chronic condition is equally weighted. CCI: obesity not listed in CCI (0 - 25); ECI (AHRQ algorithm, 0 - 34): coronary artery disease/myocardial infarction not listed in ECI, HIV/AIDS and diabetes with no complication were listed as “0”. aObesity was scored as -5 and hypertension was scored as -1 in the original ECI AHRQ algorithm. However, due to previous report of risks of obesity and hypertension in COVID-19 patients, to avoid the offset effect of other CCCs, we scored obesity and hypertension as 0 in this study. CCC: COVID-related high-risk chronic condition; CCI: Charlson Comorbidity Index; ECI: Elixhauser Comorbidity Index; HIV/AIDS: human immunodeficiency virus/acquired immunodeficiency syndrome; CHF: congestive heart failure; AHRQ: Agency for Healthcare Research and Quality; COVID-19: coronavirus disease 2019. | |||
| Active cancer | 1 | 2 | 7 |
| HIV/AIDS | 1 | 6 | 0 |
| Chronic obstructive pulmonary disease (COPD/asthma) | 1 | 3 | 3 |
| CHF | 1 | 3 | 9 |
| Hypertension | 1 | 1 | 0a |
| Coronary artery disease/myocardial infarction | 1 | 1 | (0) |
| Cerebrovascular accident (CVA) | 1 | 1 | 5 |
| Diabetes | 1 | 3 | 0 |
| Obesity | 1 | (0) | 0a |
| Chronic renal diseases | 1 | 2 | 6 |
| Liver cirrhosis | 1 | 3 | 4 |
| NHW | NHB | Hispanic | Others | |
|---|---|---|---|---|
| *P < 0.05. NHW: non-Hispanic White; NHB: non-Hispanic Black; IQR: interquartile range; COVID-19: coronavirus disease 2019; ED: emergency department. | ||||
| Patient visits, n (%) | 29,410 (32.5) | 30,022 (33.2) | 26,109 (28.8) | 5,008 (5.5) |
| Age (years), median (IQR) | 46 (33, 57) | 44 (30, 57) | 41 (28, 54) | 42 (29, 56) |
| Gender (male), n (%) | 15,777 (53.7) | 15,846 (52.8) | 12,902 (49.4) | 2,501 (49.9) |
| Number of COVID-19 tested at ED, n (%) | 4,435 (16.8) | 4,168 (13.9) | 4,116 (15.8) | 697 (13.9) |
| Number of COVID-19 positive, n (%)* | 794 (15.3) | 1,103 (24.7) | 1,711 (37.5) | 256 (33.9) |
| Among all COVID-19 positive patients, n | 794 | 1,103 | 1,711 | 256 |
| Age (years), median (IQR)* | 53 (41, 62) | 54 (42, 63) | 50 (37, 61) | 51 (38, 63) |
| Gender (male), n (%)* | 463 (58.3) | 540 (49.0) | 826 (48.3) | 127 (49.6) |
| Hospital admissions in COVID-19 patients, n (%) | 393 (49.5) | 519 (47.1) | 823 (48.1) | 116 (45.3) |
| ICU admissions among COVID-19 patients, n (%) | 71 (8.9) | 107 (9.7) | 158 (9.2) | 28 (10.9) |
| COVID-19 patients receiving ventilations, n (%) | 47 (5.9) | 65 (5.9) | 107 (6.3) | 19 (7.4) |
| In-hospital all-cause mortality, n (%) | 39 (4.9) | 54 (4.9) | 67 (3.9) | 17 (6.6) |
| No CCC | One CCC | Two CCCs | ≥ 3 CCCs | P value | |
|---|---|---|---|---|---|
| COVID-19: coronavirus disease 2019; CCC: COVID-related high-risk chronic condition. | |||||
| Number of patients, n (%) | 1,509 (39) | 786 (20) | 547 (14) | 1,022 (26) | |
| Hospital admission, n (%) | 559 (37) | 373 (47) | 275 (50) | 644 (63) | < 0.001 |
| Intensive care unit admission, n (%) | 63 (4.2) | 69 (8.8) | 67 (12.3) | 165 (16.1) | < 0.001 |
| Receiving mechanical ventilation, n (%) | 42 (2.8) | 43 (5.5) | 45 (8.2) | 108 (10.6) | < 0.001 |
| All-cause in-hospital mortality, n (%) | 32 (2.1) | 29 (3.7) | 29 (5.3) | 87 (8.5) | < 0.001 |
| Adjusted variables | Hospital admission, aOR (95% CI), P value | ICU admission, aOR (95% CI), P value | IMV, aOR (95% CI), P value | In-hospital mortality, aOR (95% CI), P value |
|---|---|---|---|---|
| CI: confidence interval; CCC: COVID-related high risk chronic condition; NHW: non-Hispanic White; NHB: non-Hispanic Black; ICU: intensive care unit; IMV: invasive mechanical ventilations. aOthers refer to American Indian, Alaska Native, Asian, Native Hawaiian or other Pacific Islanders, unknown, or patient refusal. | ||||
| Number of CCCs | ||||
| No | Reference | Reference | Reference | Reference |
| One | 1.51 (1.26 - 1.81), P< 0.001 | 2.24 (1.57 - 3.21), P < 0.001 | 2.04 (1.31 - 3.17), P = 0.002 | 1.53 (0.91 - 2.58), P = 0.108 |
| Two | 1.60 (1.30 - 1.97), P < 0.001 | 3.11 (2.14 - 4.51), P < 0.001 | 3.02 (1.93 - 4.73), P < 0.001 | 1.94 (1.14 - 3.31), P = 0.014 |
| ≥ 3 | 2.56 (2.13 - 3.07), P < 0.001 | 4.22 (3.04 - 5.84), P < 0.001 | 3.95 (2.66 - 5.85), P < 0.001 | 2.84 (1.81 - 4.45), P < 0.001 |
| Age | ||||
| 18 - 54 years | Reference | Reference | Reference | Reference |
| 55 - 60 years | 1.21 (1.00 - 1.46), P = 0.053 | 1.10 (0.80 - 1.52), P = 0.561 | 1.18 (0.81 - 1.74), P = 0 .392 | 1.88 (1.18 - 3.01), P = 0.008 |
| 61 - 65 years | 1.31 (1.06 - 1.62), P = 0.013 | 1.38 (0.99 - 1.92), P = 0.060 | 1.51 (1.02 - 2.24), P = 0.039 | 2.16 (1.32 - 3.52), P = 0.002 |
| 66+ years | 1.93 (1.59 - 2.35), P < 0.001 | 1.35 (1.00 - 1.82), P = 0.048 | 1.31 (0.91 - 1.88), P = 0.148 | 3.58 (2.38 - 5.37), P < 0.001 |
| Sex | ||||
| Female | Reference | Reference | Reference | Reference |
| Male | 1.77 (1.55 - 2.02), P < 0.001 | 1.86 (1.48 - 2.34), P < 0.001 | 1.72 (1.31 - 2.27), P < 0.001 | 1.75 (1.27 - 2.41), P = 0.001 |
| Populations | ||||
| NHW | Reference | Reference | Reference | Reference |
| NHB | 0.84 (0.69 - 1.01), P = 0.067 | 1.00 (0.73 - 1.39), P = 0.979 | 0.92 (0.62 - 1.36), P = 0.660 | 0.90 (0.58 - 1.39), P = 0.636 |
| Hispanic | 1.04 (0.87 - 1.24), P = 0.665 | 1.18 (0.87 - 1.59), P = 0.288 | 1.21 (0.84 - 1.73), P = 0.307 | 0.86 (0.57 - 1.31), P = 0.484 |
| Othersa | 0.97 (0.72 - 1.31), P = 0.860 | 1.60 (0.99 - 2.58), P = 0.054 | 1.62 (0.92 - 2.86), P = 0.095 | 1.59 (0.87 - 2.93), P = 0.132 |
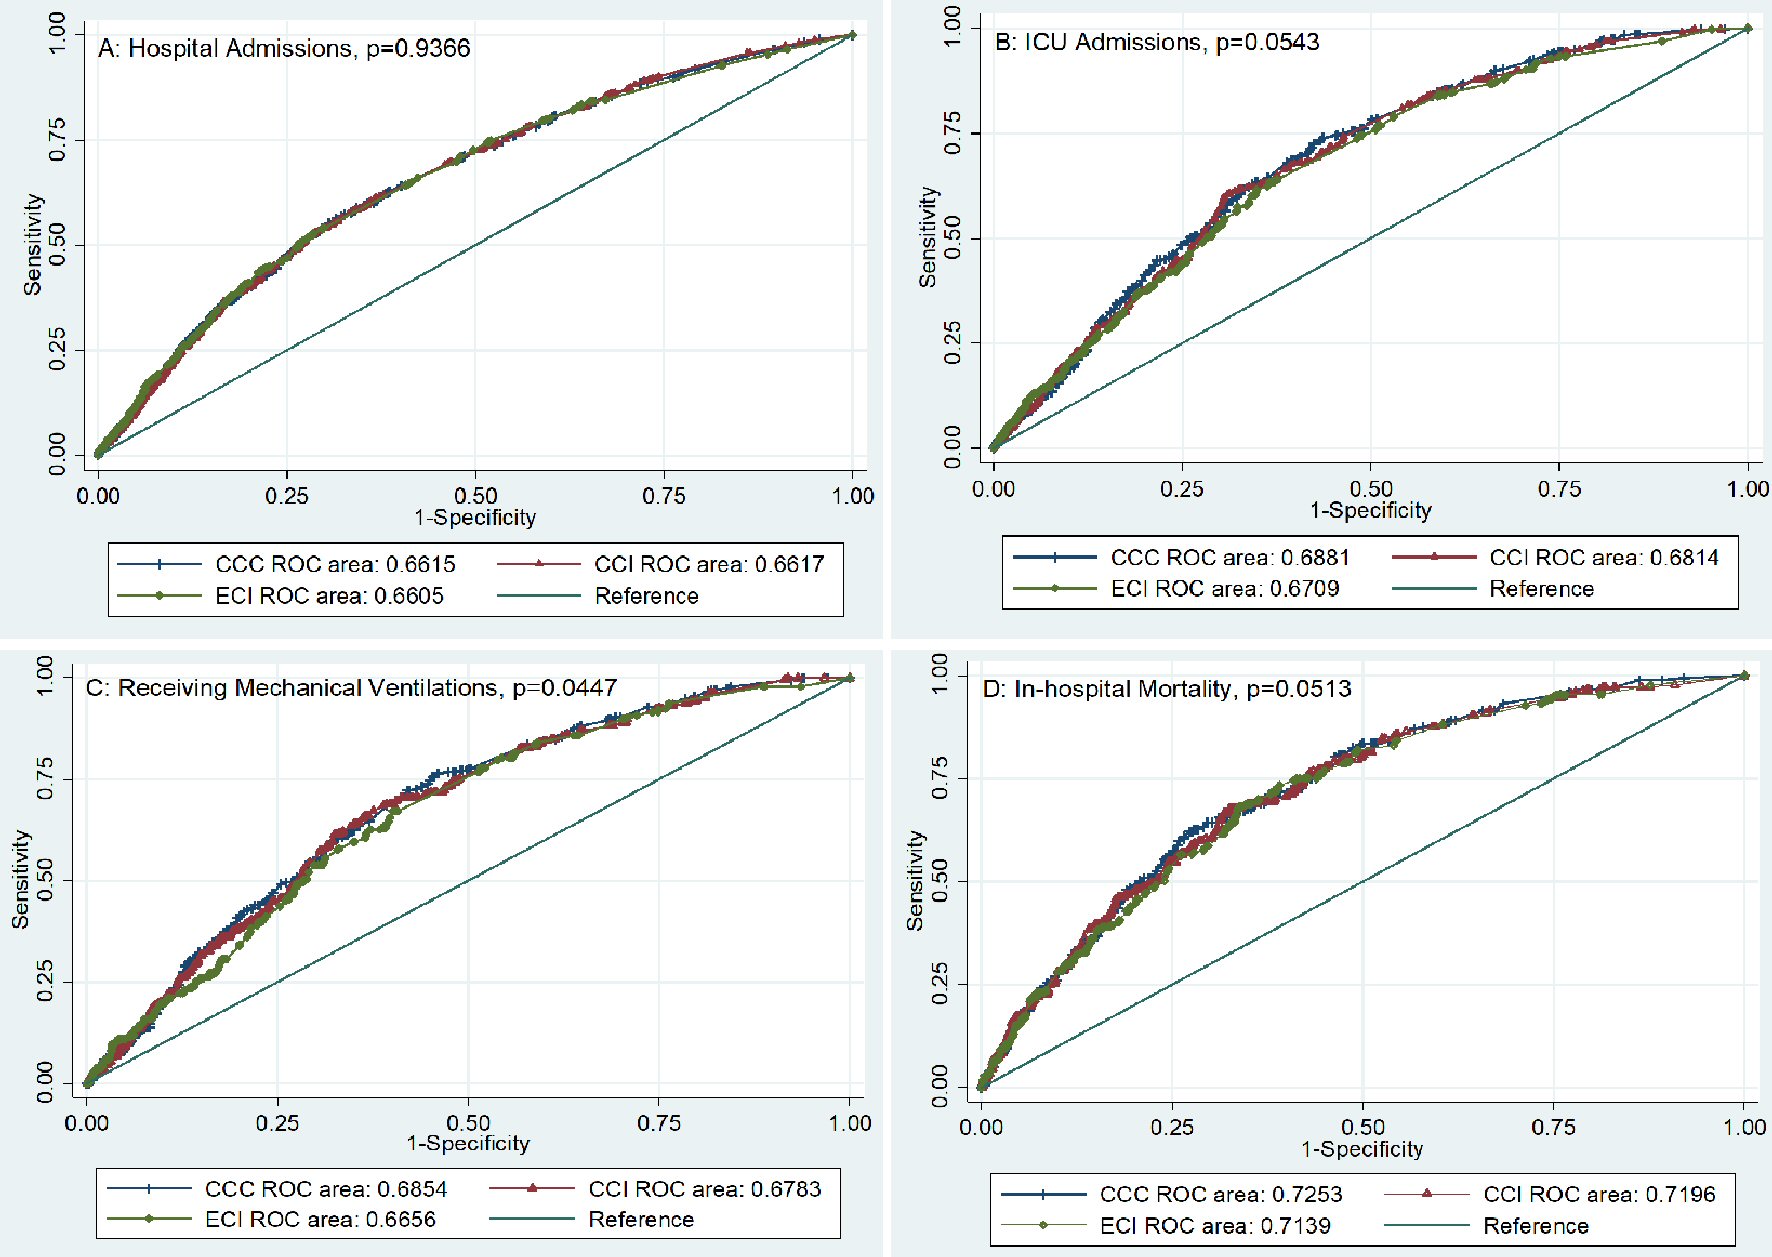
| CCC | CCI | ECI | P value | |
|---|---|---|---|---|
| CCC: COVID-related high-risk chronic condition; CCI: Charlson Comorbidity Index; ECI: Elixhauser Comorbidity Index. | ||||
| Hospital admissions | 0.66 (0.64 - 0.68) | 0.66 (0.64 - 0.68) | 0.66 (0.64 - 0.68) | 0.9366 |
| Intensive care unit admissions | 0.69 (0.66 - 0.71) | 0.68 (0.66 - 0.71) | 0.67 (0.64 - 0.70) | 0.0543 |
| Receiving mechanical ventilations | 0.69 (0.65 - 0.72) | 0.68 (0.65 - 0.71) | 0.67 (0.63 - 0.70) | 0.0447 |
| In-hospital mortality | 0.73 (0.69 - 0.76) | 0.72 (0.68 - 0.76) | 0.71 (0.68 - 0.75) | 0.0513 |