Figures
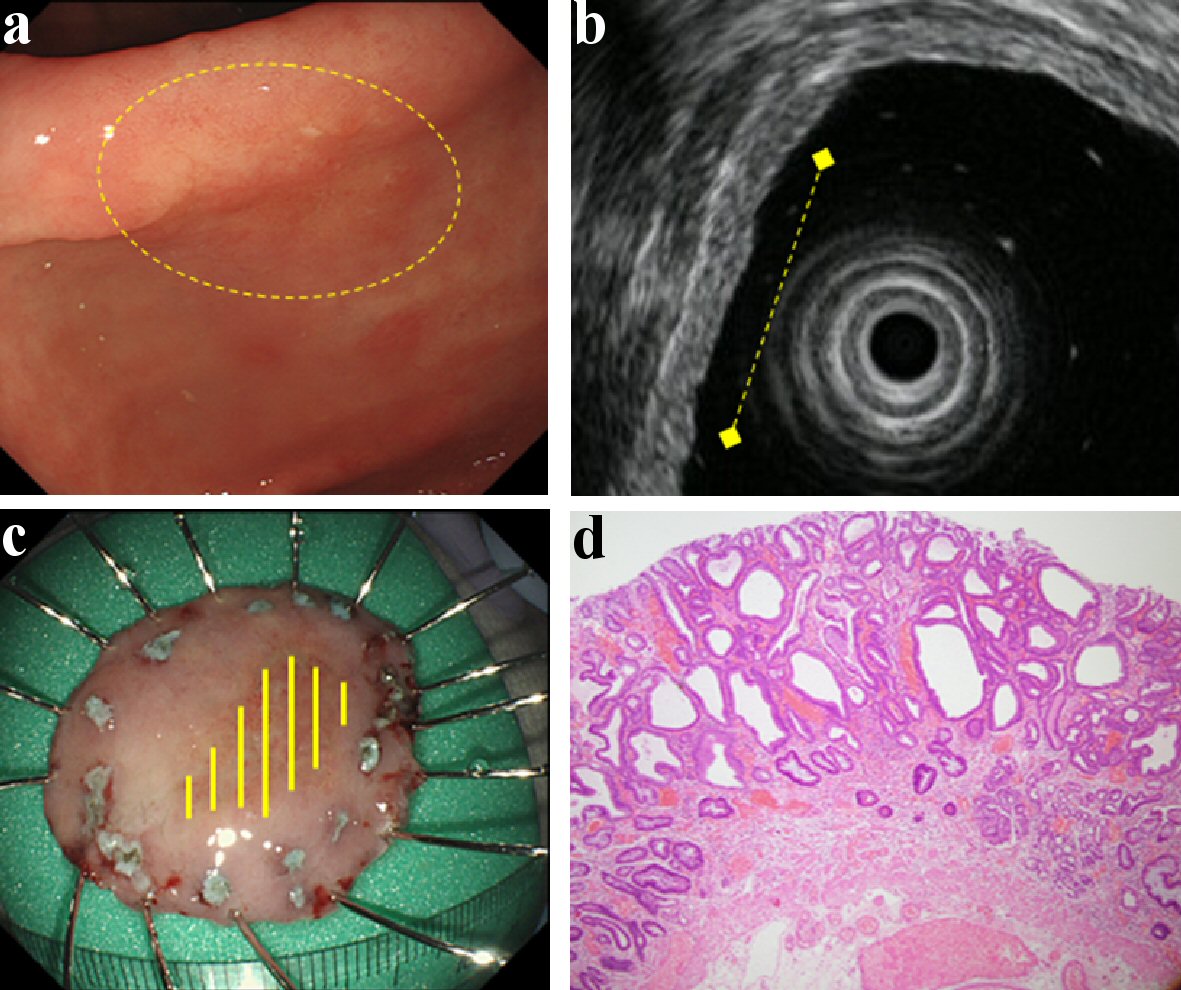
Figure 1. Findings of an EGC confined to the mucosa (M). A depressed type EGC located in the antrum. It was of the differentiated type (tub1 > tub2) and ESD was performed on it. This lesion did not have CE finding from submucosal invasion (a), and it was located in the mucosa with intact submucosa on EUS (b). Therefore, it was predicted to be M by both CE and EUS. This lesion was found to be confined to the mucosa upon histologic examination (c, d). (a) CE (yellow circle: lesion area). (b) EUS (yellow dotted line: lesion area). (c) Resected specimen (yellow line: M). (d) Histological examination of resected specimen (H&E stain; × 40). EGC: early gastric cancer; ESD: endoscopic submucosal dissection; CE: conventional endoscopy; EUS: endoscopic ultrasonography; M: confined to the mucosa; H&E: hematoxylin and eosin.
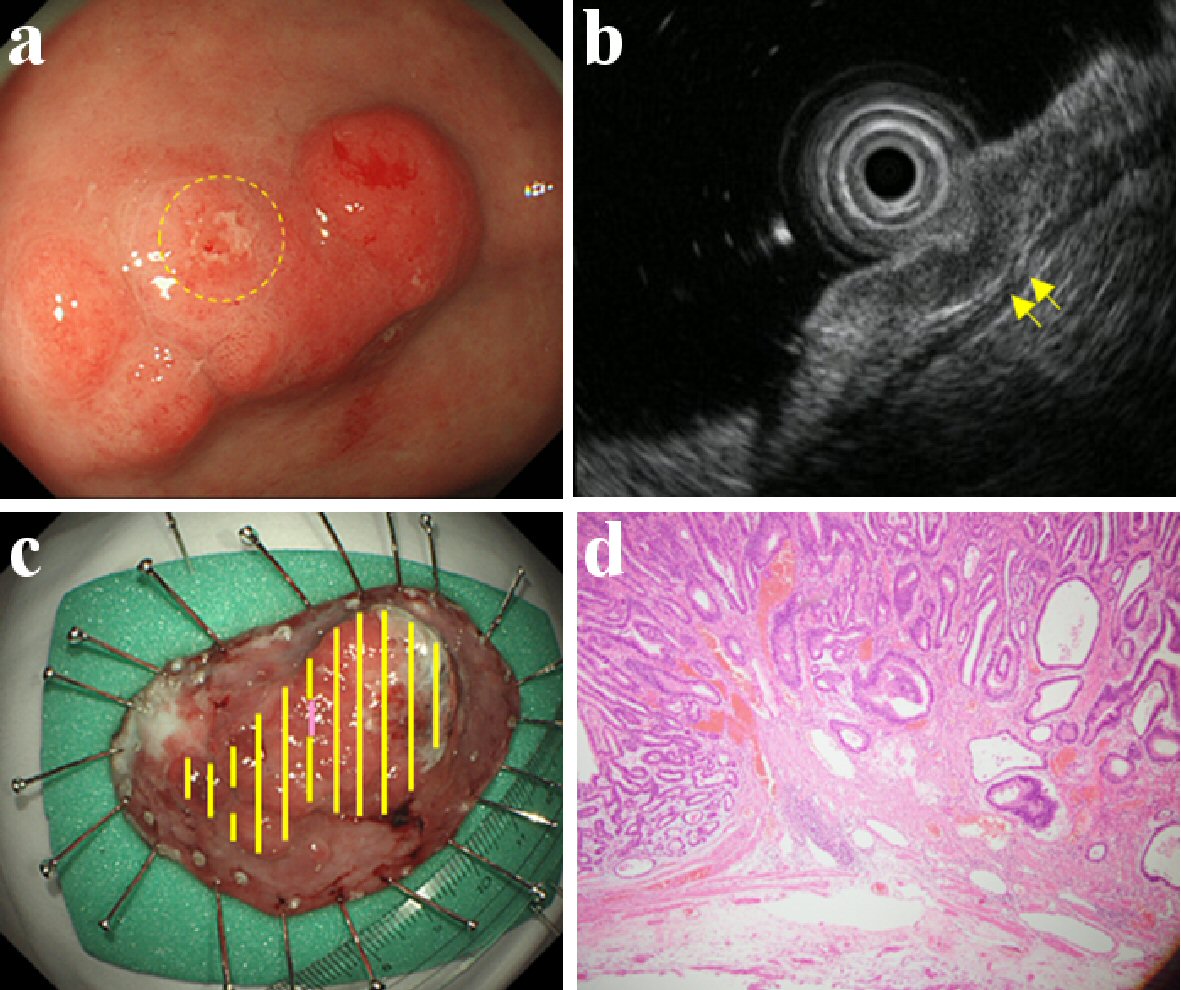
Figure 2. Findings of an EGC confined to < 500 µm from the muscularis mucosae (SM1). An elevated type EGC located in the antrum. It was of the differentiated type (tub2 > pap > tub1) and ESD was performed on it. This lesion was found to be a slight/local erosion by CE (a), and a slight/local crack of the third layer by EUS (b). Therefore, it was predicted to be SM1 by both CE and EUS. This lesion slightly invaded the submucosa at the erosion; found confined to < 500 µm from the muscularis mucosae upon histologic examination (c, d). (a) CE (yellow circle: slight/local erosion on the lesion). (b) EUS (yellow arrow: slight/local crack of the third layer). (c) Resected specimen (yellow line: M, violet line: SM). (d) Histological examination of resected specimen (H&E stain; × 40). EGC: early gastric cancer; ESD: endoscopic submucosal dissection; CE: conventional endoscopy; EUS: endoscopic ultrasonography; SM: invaded submucosa, SM1: confined to < 500 µm from the muscularis mucosae; H&E: hematoxylin and eosin.
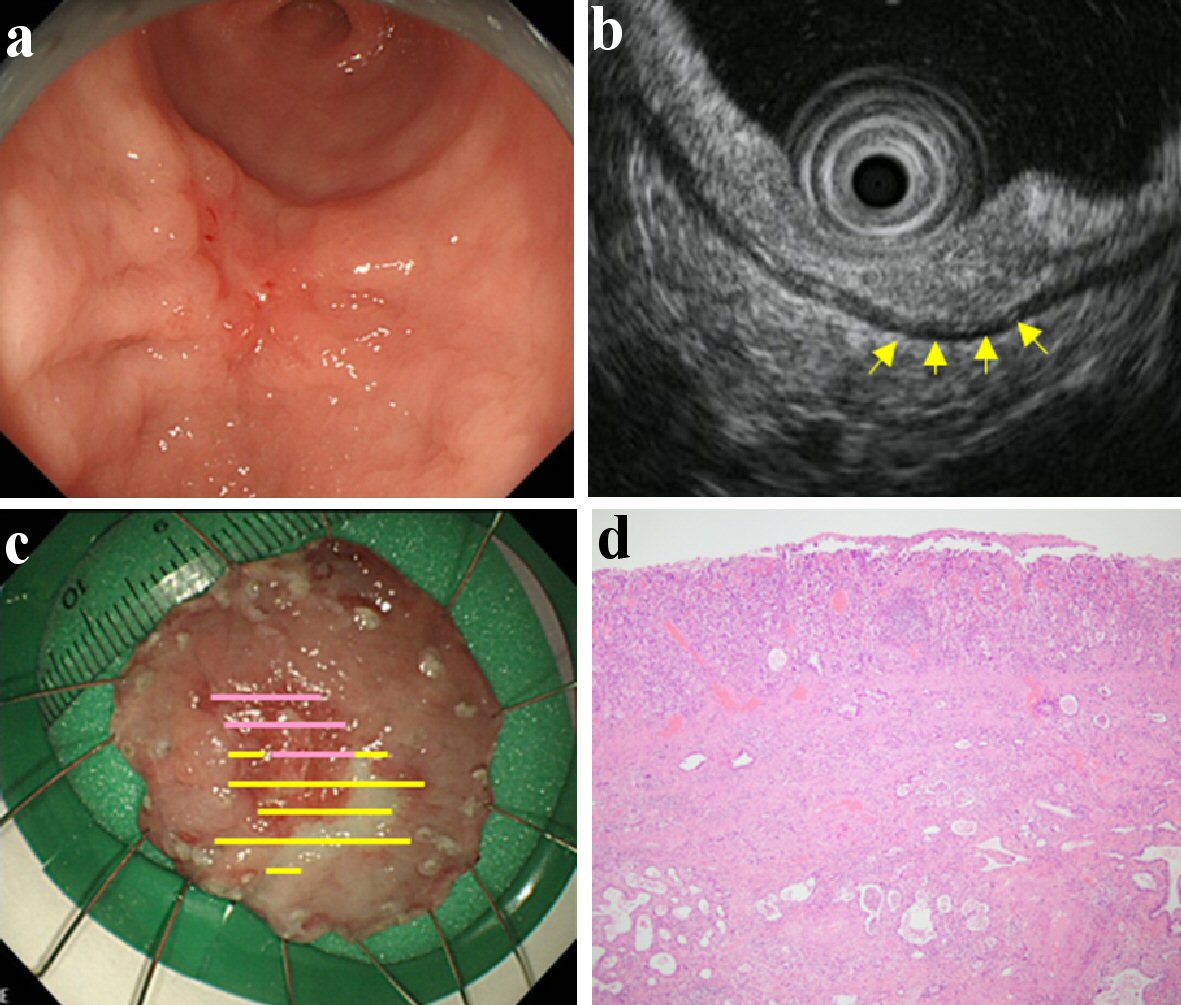
Figure 3. Findings of an EGC confined to ≥ 500 µm from the muscularis mucosae (SM2). A depressed type EGC located in the lower gastric body. It was of the differentiated type (tub2) and ESD was performed on it. This lesion was found with fold thickness and fusion of convergent folds by CE (a), and hypoechoic mass with irregular narrowing of the third layer by EUS (b). Therefore, it was predicted to be SM2 by both CE and EUS. There was massive submucosal invasion in the lesion; found confined to ≥ 500 µm from the muscularis mucosae upon the histologic examination (c, d). (a) CE. (b) EUS (yellow arrow: hypoechoic mass with irregular narrowing of the third layer). (c) Resected specimen (yellow line: M, violet line: SM). (d) Histological examination of resected specimen (H&E stain; × 40). EGC: early gastric cancer; ESD: endoscopic submucosal dissection; CE: conventional endoscopy; EUS: endoscopic ultrasonography; SM: invaded submucosa; SM2: confined to ≥ 500 µm from the muscularis mucosae; H&E: hematoxylin and eosin.
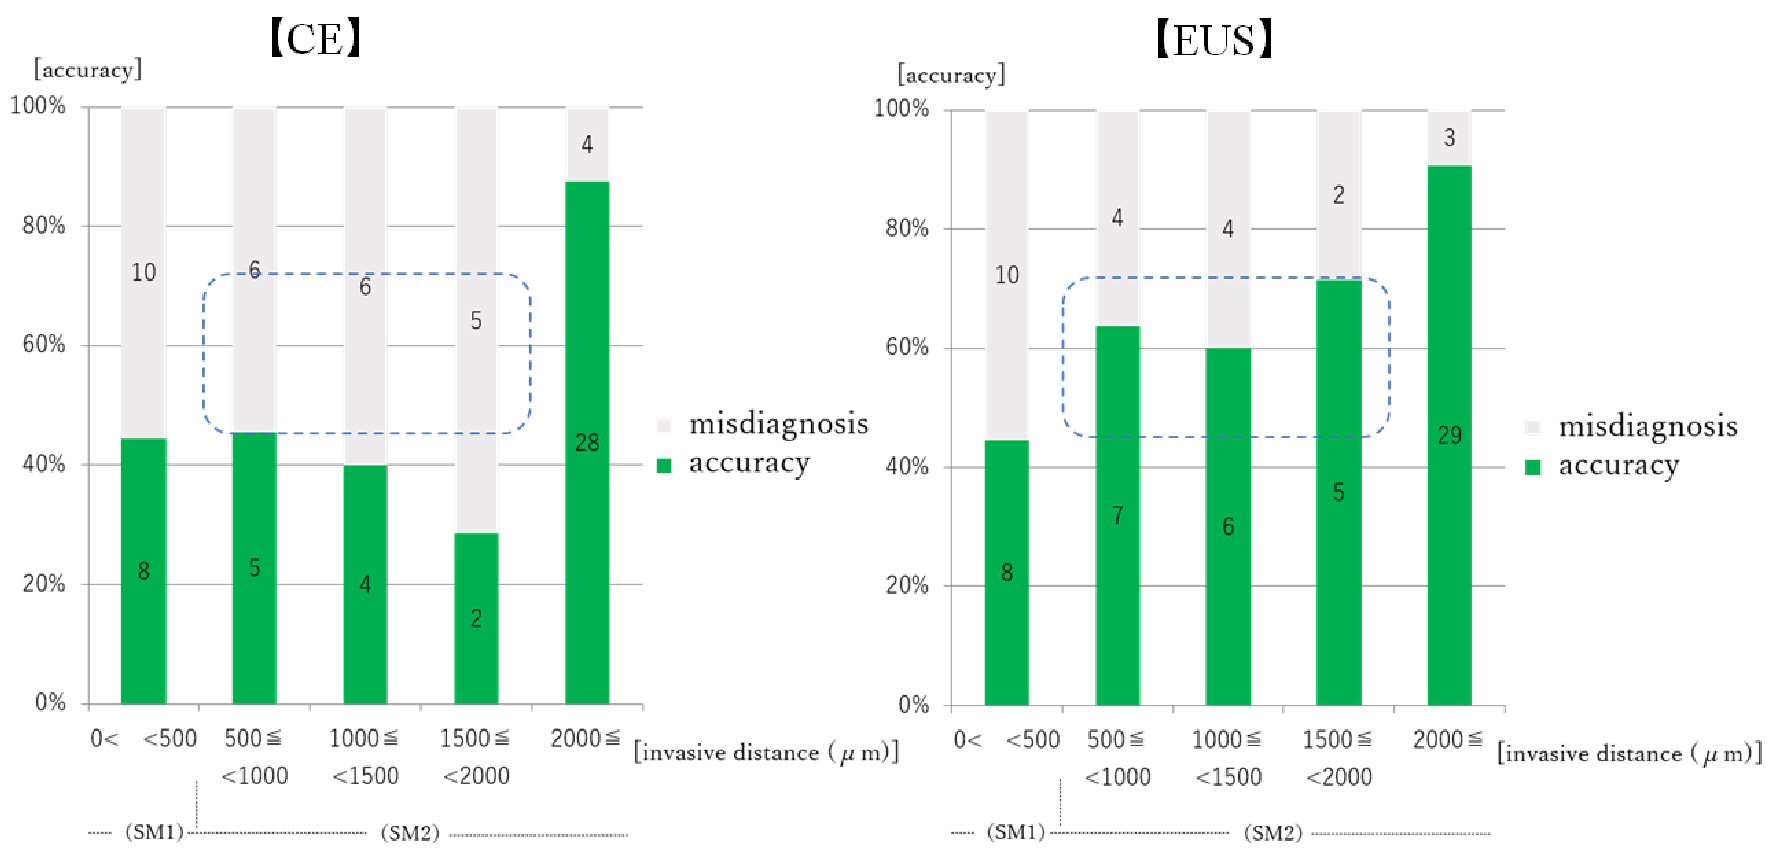
Figure 4. Relationship between prediction of EGC invasion depth by CE/EUS and invasive distance from the muscularis mucosae. EGC: early gastric cancer; CE: conventional endoscopy; EUS: endoscopic ultrasonography. Numeral in the bar graph: number of the cases. For the lesions confined to 500 - 2,000 µm, the accuracy of CE staging was about 40% and it was not superior to the accuracy for the lesions confined to < 500 µm. The accuracy of EUS staging was 60% or more in these lesions (blue squares), and was between the accuracy for lesions confined to < 500 µm and to ≥ 2,000 µm.
Tables
Table 1. Clinical Characteristics of Patients and EGC Lesions
| Patients (n = 403) |
|---|
| EGC: early gastric cancer; ESD: endoscopic submucosal dissection; Up: upper third; Mid: middle third; Low: lower third; Less: lesser curvature; Gre: greater curvature; Ant: anterior wall; Post: posterior wall; M: confined to the mucosa; SM1: confined to < 500 µm from the muscularis mucosae; SM2: confined to ≥ 500 µm from the muscularis mucosae. |
| Mean age (years) | 71.3 (30 - 95) |
| Sex: M/F (%) | 277/126 (68.7/31.3) |
| Treatment: ESD/surgery (%) | 328/75 (81.4/18.6) |
| Gastric regions: Up/Mid/Low (%) | 49/131/223 (12.2/32.5/55.3) |
| Cross-sectional parts of the stomach: Less/Gre/Ant/Post (%) | 137/73/99/94 (34.0/18.1/24.6/23.3) |
| Macroscopic types: elevated type/flat-depressed type (%) | 162/241 (40.2/59.8) |
| Mean tumor area (cm2) | 3.486 (0.016 - 98.222) |
| Histological classification: differentiated type/undifferentiated type (%) | 357/46 (88.6/11.4) |
| Pathological depth of tumor invasion: M/SM1/SM2 (%) | 322/18/63 (79.9/4.5/15.6) |
Table 2. Relationship Between Prediction of EGC Invasion Depth by CE and Different Factors
| Accuracy (N = 352) | Over-staging (N = 21) | Under-staging (N = 30) | Univariate analysis | Multivariate analysis |
|---|
| P valuea | P valueb | P valuea | P valueb |
|---|
| aComparison between “accuracy group” and “over-staging group”. bComparison between “accuracy group” and “under-staging group”. Statistical analysis was performed using JMP 9 (SAS Institute Japan Ltd.). Comparison of the prevalence was made by univariate analysis. Furthermore, we performed multiple logistic regression analysis with the factors showing the tendency to involve the P value < 0.05 as the confounding factors in our univariate analysis when there were multiple factors in univariate analysis. Statistical significance was taken as P value < 0.05. EGC: early gastric cancer; CE: conventional endoscopy; Up: upper third; Mid: middle third; Low: lower third; Less: lesser curvature; Gre: greater curvature; Ant: anterior wall; Post: posterior wall. |
| Gastric regions: Up/Mid/Low (%) | 37/115/200 (10.5/32.7/56.8) | 3/6/12 (14.3/28.6/57.1) | 9/10/11 (30.0/33.3/36.7) | 0.8327 | 0.0046 | - | 0.0205 |
| Cross-sectional parts of the stomach: Less/Gre/Ant/Post (%) | 85/87/120/60 (24.1/24.7/34.1/17.0) | 6/4/6/5 (28.6/19.0/28.6/23.8) | 8/3/11/8 (26.7/10.0/36.7/26.7) | 0.7725 | 0.2505 | - | - |
| Macroscopic types: elevated type/flat-depressed type (%) | 143/209 (40.6/59.4) | 6/15 (28.6/71.4) | 13/17 (43.3/56.7) | 0.3607 | 0.8472 | - | - |
| Tumor area (cm2) | 2.981 | 6.856 | 7.047 | 0.0030 | 0.0317 | 0.1539 | 0.0343 |
| Histological classification: differentiated type/undifferentiated type (%) | 318/34 (90.3/9.7) | 13/8 (61.9/38.1) | 26/4 (86.7/13.3) | 0.0009 | 0.5220 | 0.0155 | - |
Table 3. Relationship Between the Prediction of EGC Invasion Depth by EUS and Different Factors
| Accuracy (N = 352) | Over-staging (N = 31) | Under-staging (N = 20) | Univariate analysis | Multivariate analysis |
|---|
| P valuea | P valueb | P valuea | P valueb |
|---|
| aComparison between “accuracy group” and “over-staging group”. bComparison between “accuracy group” and “under-staging group”. Statistical analysis was performed using JMP 9 (SAS Institute Japan Ltd.). Comparison of the prevalence was made by univariate analysis. Furthermore, we performed multiple logistic regression analysis with the factors showing the tendency to involve the P value < 0.05 as the confounding factors in our univariate analysis when there were multiple factors in univariate analysis. Statistical significance was taken as P value < 0.05. EGC: early gastric cancer; EUS: endoscopic ultrasonography; Up: upper third; Mid: middle third; Low: lower third; Less: lesser curvature; Gre: greater curvature; Ant: anterior wall; Post: posterior wall. |
| Gastric regions: Up/Mid/Low (%) | 38/109/205 (10.8/31.0/58.2) | 4/16/11 (12.9/51.6/35.5) | 7/6/7 (35.0/30.0/35.0) | 0.0397 | 0.0042 | 0.6590 | - |
| Cross-sectional parts of the stomach: Less/Gre/Ant/Post (%) | 90/81/119/62 (25.6/23.0/33.8/17.6) | 4/9/13/5 (12.9/29.0/41.9/16.1) | 5/4/5/6 (25.0/20.0/25.0/30.0) | 0.4099 | 0.5507 | - | - |
| Macroscopic types: elevated type/flat-depressed type (%) | 150/202 (42.6/57.4) | 6/25 (19.4/80.6) | 6/14 (30.0/70.0) | 0.0126 | 0.3531 | 0.4496 | - |
| Tumor area (cm2) | 3.094 | 7.537 | 4.101 | 0.0234 | 0.5117 | < 0.0001 | - |
| Histological classification: differentiated type/undifferentiated type (%) | 318/34 (90.3/9.7) | 13/18 (41.9/58.1) | 16/4 (80.0/20.0) | < 0.0001 | 0.0897 | 0.0690 | - |