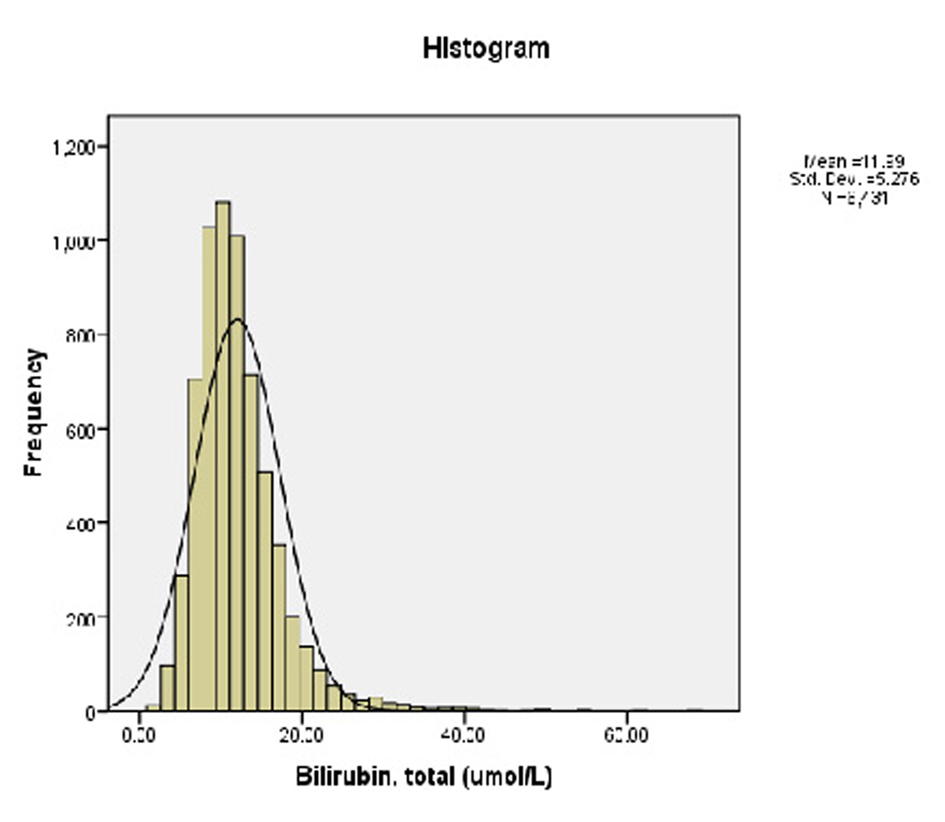
Figure 1.. Prevalence of serum TBili among the participants.
| Journal of Clinical Medicine Research, ISSN 1918-3003 print, 1918-3011 online, Open Access |
| Article copyright, the authors; Journal compilation copyright, J Clin Med Res and Elmer Press Inc |
| Journal website http://www.jocmr.org |
Original Article
Volume 2, Number 6, December 2010, pages 256-260
Bilirubin as a Protective Factor for Rheumatoid Arthritis: An NHANES Study of 2003 - 2006 Data
Figures
Table
| Serum TBili <11micromols/liter | Serum TBili >11micromoles per liter | |
|---|---|---|
| Age 20-39 | 46.46% SE 1.14 | 53.54 SE 1.14 |
| 40-59 | 44.73% SE 1.16 | 55.27 SE 1.16 |
| 60 and above | 40.25% SE 1.54 | 59.74 SE 1.54 |
| Unmarried | 49.16% SE 1.24 | 50.82 SE 1.24 |
| Married | 40.85% SE 1.12 | 59.14 SE 1.12 |
| Edu < high school | 52.31% SE 1.90 | 47.68 SE 1.90 |
| Edu > high school | 42.65% SE 0.97 | 57.34 SE 0.97 |
| Non smoker | 43.02% SE 1.24 | 56.98 SE 1.24 |
| Smoking | 45.79% SE 0.95 | 54.02 SE 0.95 |
| Black | 56.78% SE 1.26 | 43.22 SE 1.26 |
| Non-black | 42.73% SE 0.98 | 57.27 SE 0.98 |
| Male | 30.63% SE 1.02 | 69.37 SE 1.02 |
| Female | 56.28% SE 1.27 | 43.27 SE 1.27 |
| BMI less than 25 | 43.24% SE 1.45 | 56.76 SE 1.45 |
| 25-29 | 39.57% SE 1.43 | 60.43 SE 1.45 |
| 30 and above | 50.42% SE 1.28 | 49.58 SE 1.28 |
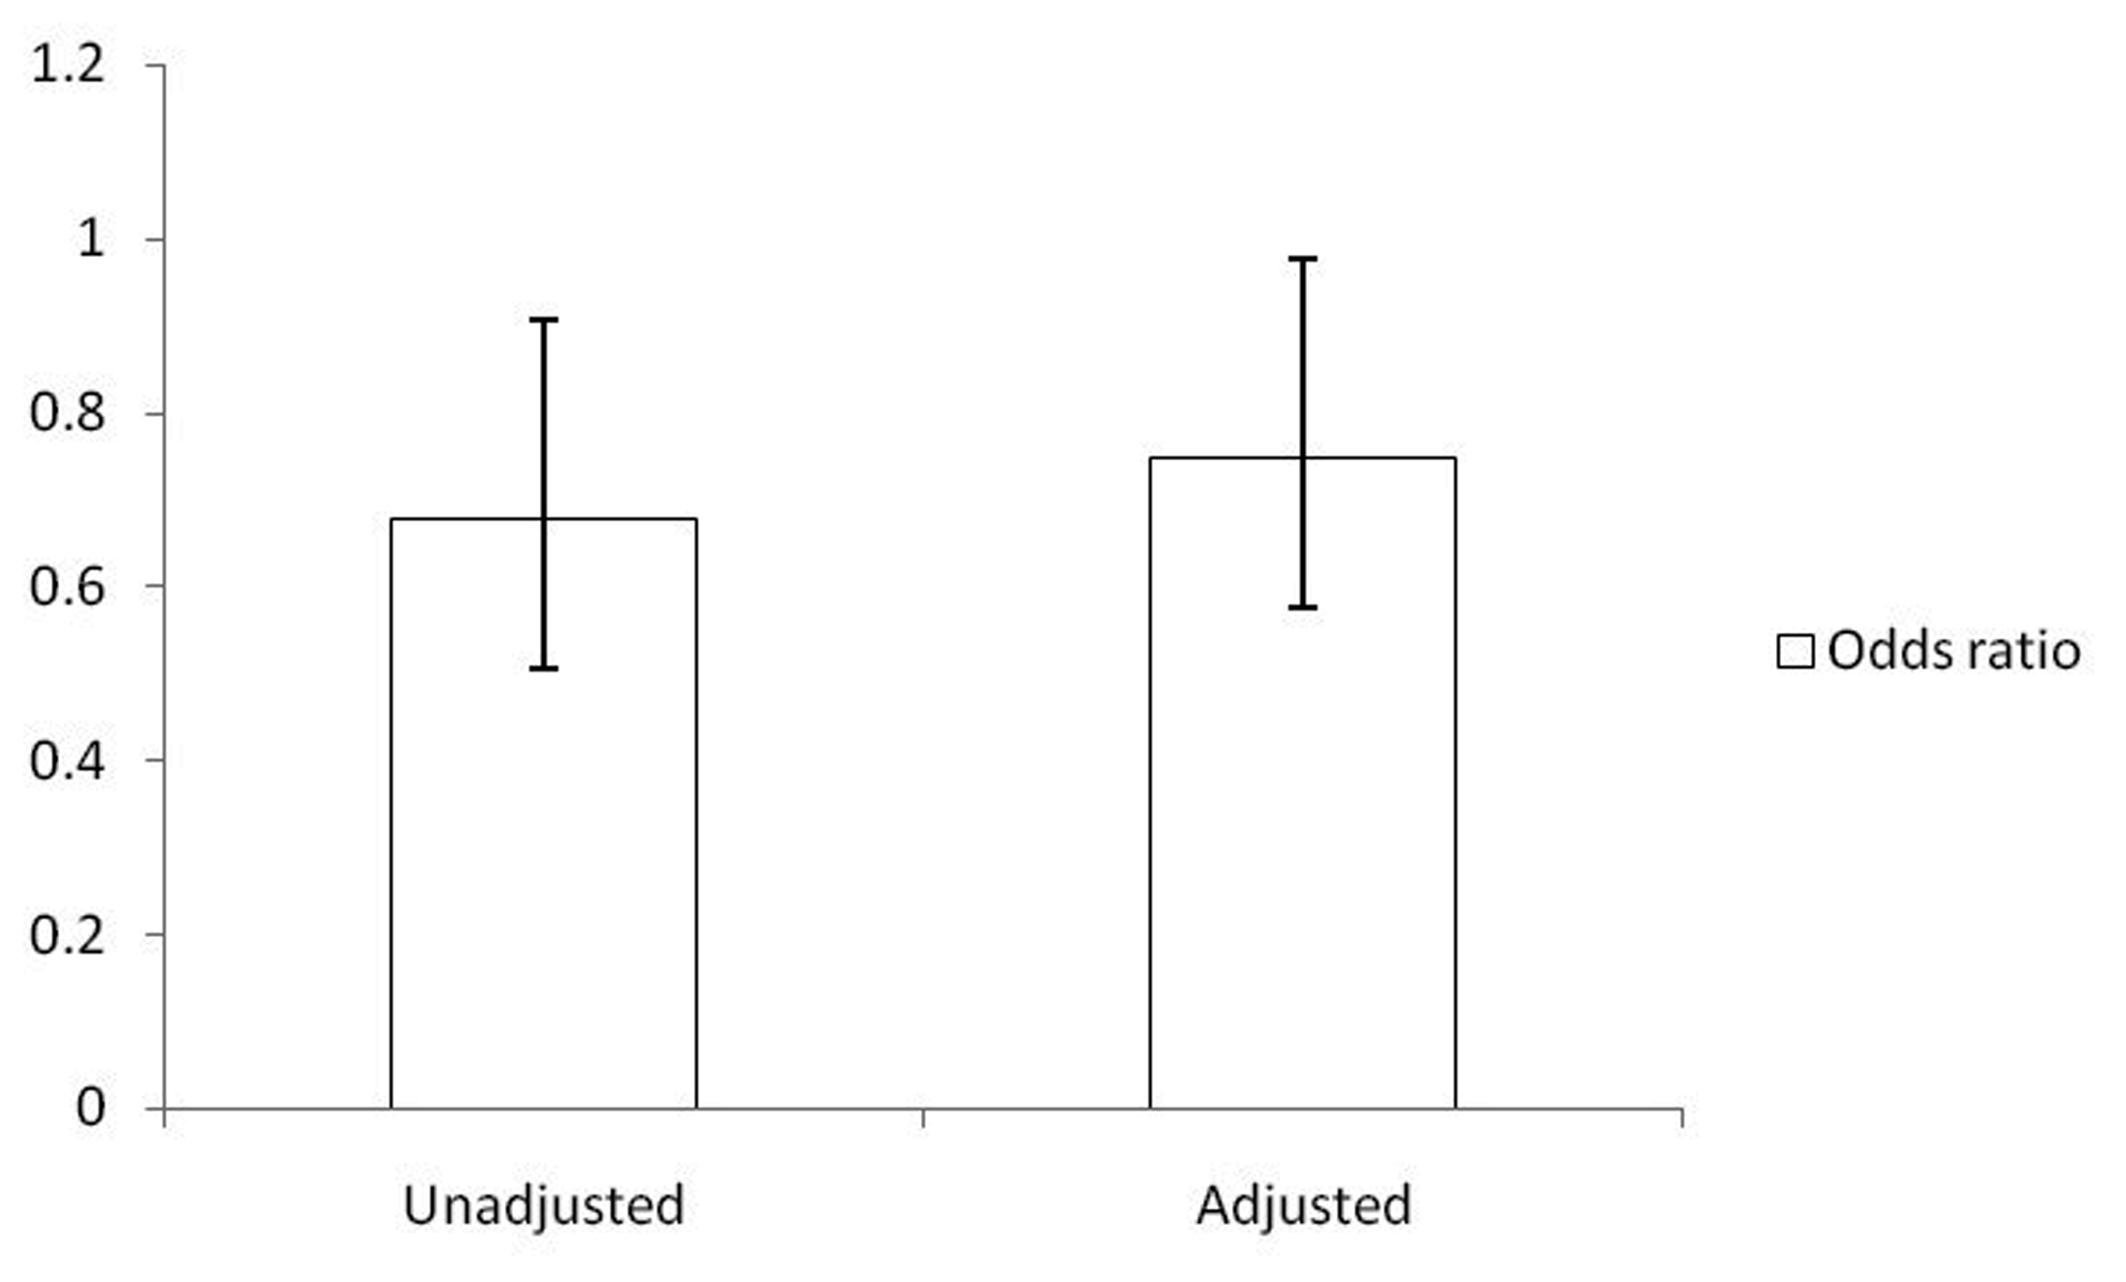
| No Rheumatoid arthritis | 44.07% SE 0.92 | 55.93 SE 0.92 |
| Rheumatoid arthritis | 51.23% SE 3.62 | 48.77 SE 3.62 |