Figures
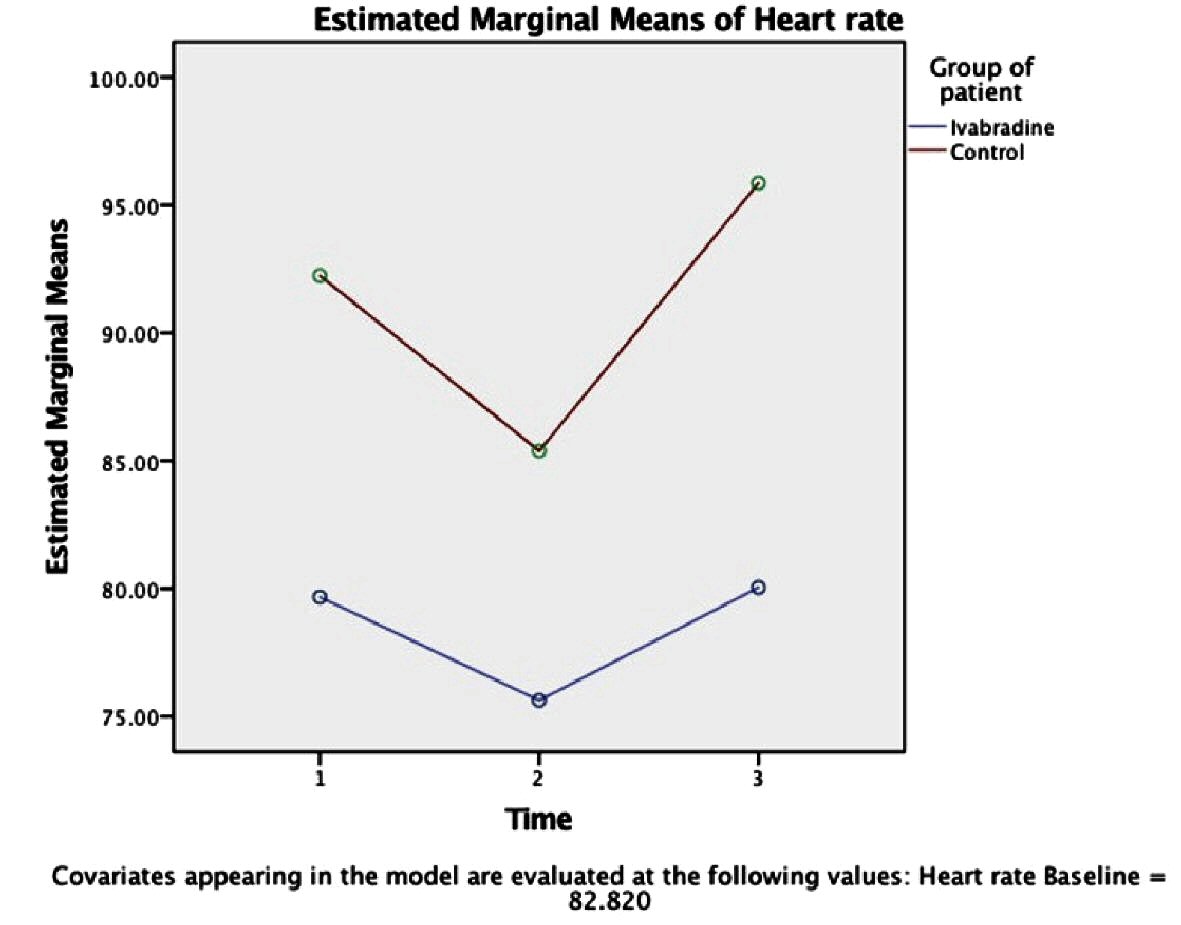
Figure 1. Variation of heart rate (beat/min) between the groups over time (intervention time: period of each event, namely, intubation [1], incision [2] and extubation [3]) using RMANOVA analysis (n = 25 each). Circle indicates the mean value; corresponding SD of each mean is as follow: ivabradine group: Time (1): ± 11.6, Time (2): ± 10.66, Time (3): ± 11.65; control group: Time (1): ± 12.9, Time (2): ± 11.68, Time (3): ± 8.55. Significance level between the groups: P < 0.005.
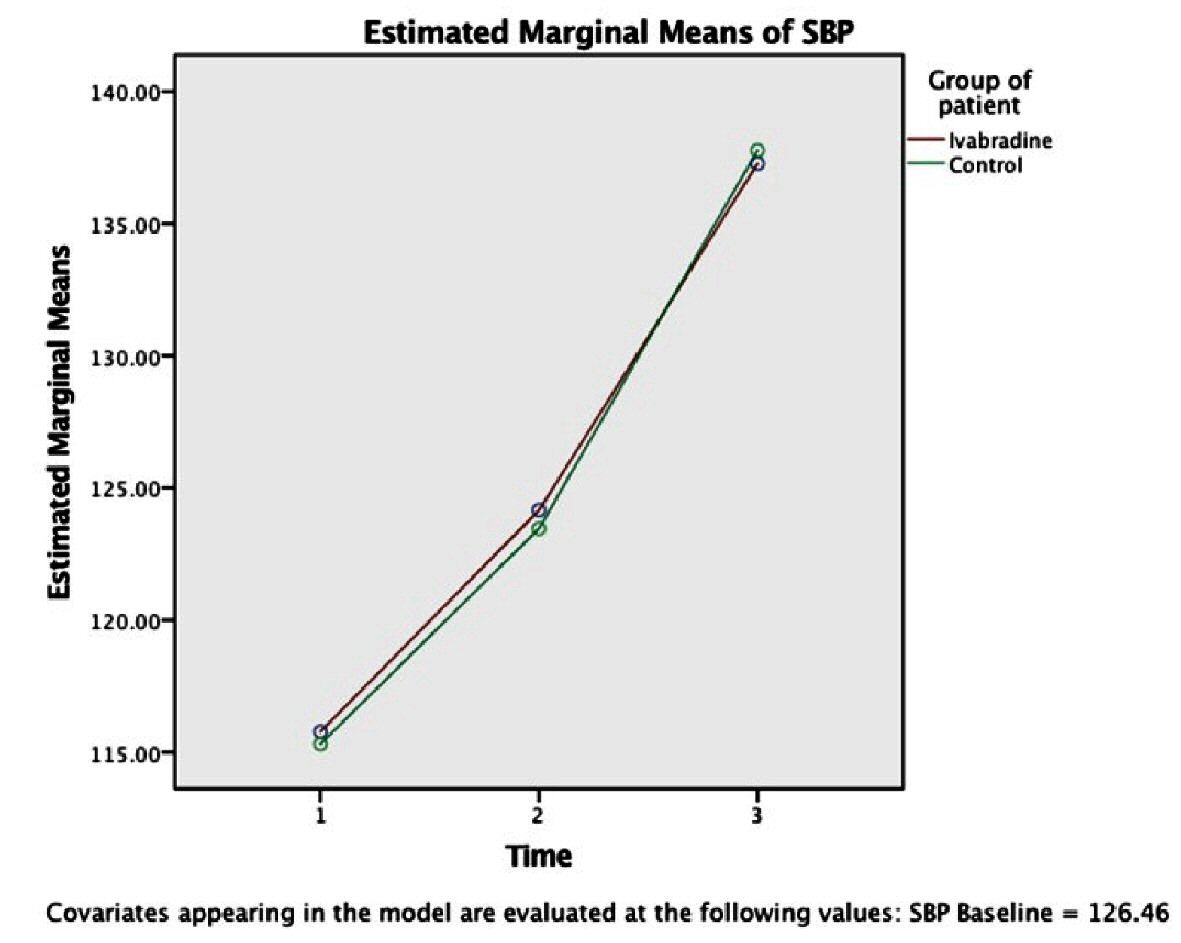
Figure 2. Variation of SBP (mm Hg) between the groups over time (intervention time: period of each event, namely, intubation [1], incision [2] and extubation [3]) using RMANOVA analysis (n = 25 each). Circle indicates the mean value. Corresponding SD of each mean is as follow: ivabradine group: Time (1): ± 14, Time (2): ± 12, Time (3): ± 20.331; control group: Time (1): ± 19, Time (2): ± 13, Time (3): ± 18.84. Significance level between the groups: P < 0.005. SBP: systolic blood pressure; SD: standard deviation.
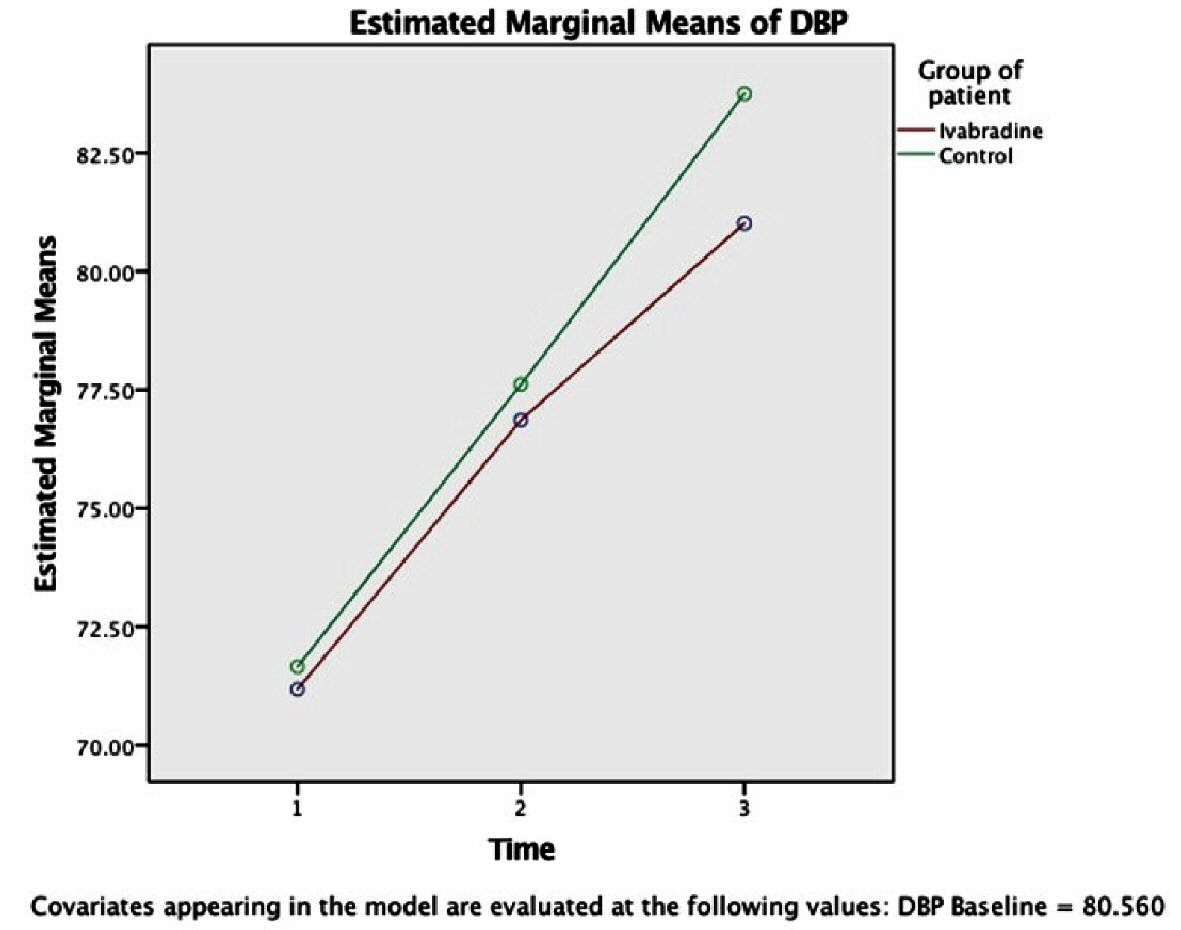
Figure 3. Variation of DBP (mm Hg) between the groups over time (intervention time: period of each event, namely, intubation [1], incision [2] and extubation [3]) using RMANOVA analysis (n = 25 each). Circle indicates the mean value. Corresponding SD of each mean is as follow: ivabradine group: Time (1): ± 7.07, Time (2): ± 7.43, Time (3): ± 8.41; control group: Time (1): ± 11.7, Time (2): ± 9.50, Time (3): ± 10.699. Significance level between the groups: P < 0.005. DBP: diastolic blood pressure; SD: standard deviation.
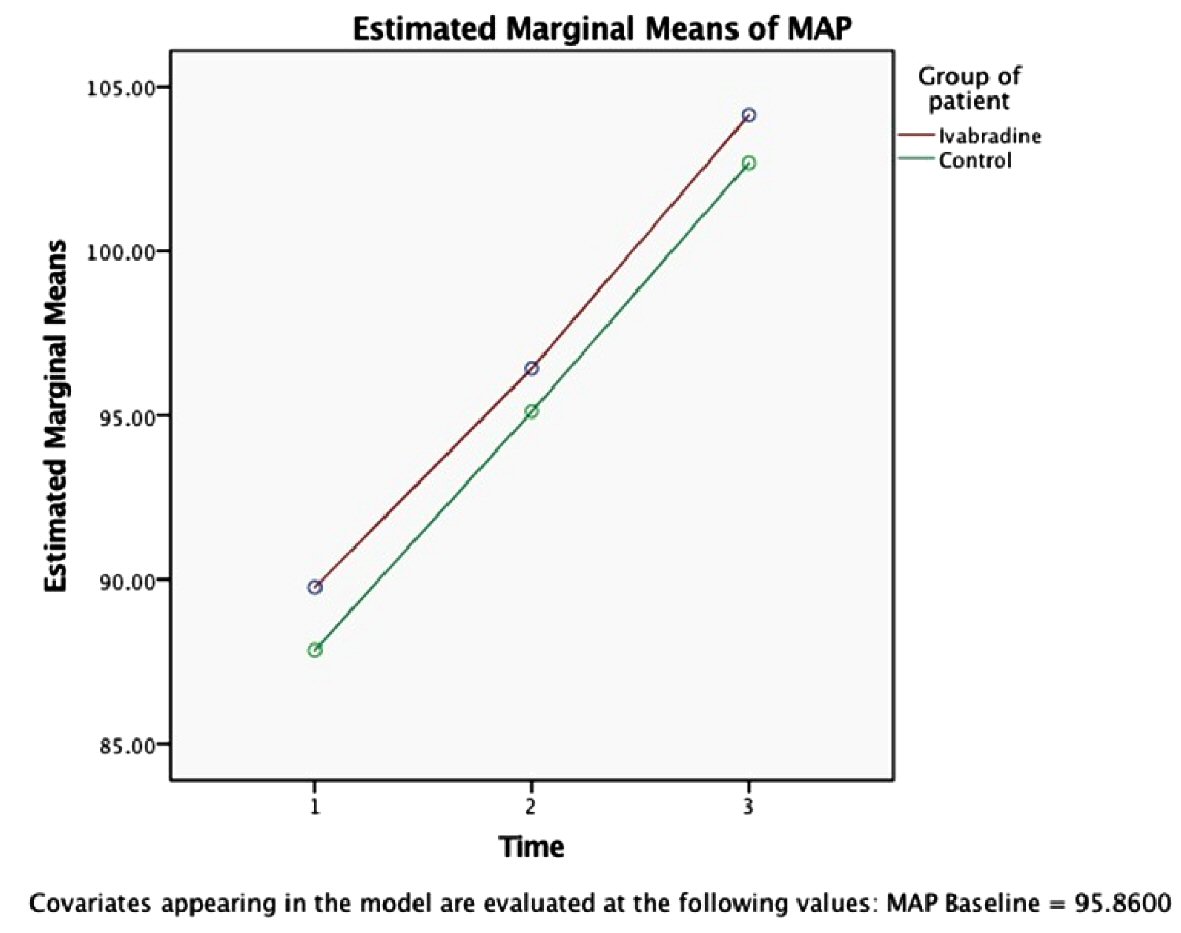
Figure 4. Variation of MAP (mm Hg) between the groups over time (intervention time: period of each event, namely, intubation [1], incision [2] and extubation [3]) using RMANOVA analysis (n = 25 each). Circle indicates the mean value. Corresponding SD of each mean is as follow: ivabradine group: Time (1): ± 10.1, Time (2): ± 7.38, Time (3): ± 11.789; control group: Time (1): ± 13.4, Time (2): ± 10.2, Time (3): ± 13.84. Significance level between the groups: P < 0.005. MAP: mean arterial pressure; SD: standard deviation.
Tables
Table 1. Gender Distribution Among the Study Participants (N = 25 for Each Group)
| Group of patients | Total |
|---|
| Ivabradine | Control |
|---|
| Male | | | |
| Count | 5 | 7 | 12 |
| Expected count | 6.0 | 6.0 | 12.0 |
| % within gender | 41.7% | 58.3% | 100.0% |
| Female | | | |
| Count | 20 | 18 | 38 |
| Expected count | 19.0 | 19.0 | 38.0 |
| % within gender | 52.6% | 47.4% | 100.0% |
| Total | | | |
| Count | 25 | 25 | 50 |
| Expected count | 25.0 | 25.0 | 50.0 |
| % within gender | 50.0% | 50.0% | 100.0% |
Table 2. Baseline Hemodynamic Parameters of the Study Participants (N = 25 Each)
| Baseline | Group of patients | Test of significance (independent sample t-test) |
|---|
| Ivabradine | Control |
|---|
| Mean | SD | Mean | SD | t | P value |
|---|
| SBP: systolic blood pressure; DBP: diastolic blood pressure; MAP: mean arterial pressure; SD: standard deviation. |
| Heart rate | 83.40 | 10.24 | 82.24 | 12.44 | 0.360 | 0.720 |
| SBP | 128.60 | 15.27 | 124.32 | 13.33 | 1.056 | 0.296 |
| DBP | 81.00 | 8.93 | 80.12 | 6.23 | 0.404 | 0.688 |
| MAP | 96.87 | 10.00 | 94.85 | 7.63 | 0.800 | 0.428 |
Table 3. Change in Hemodynamic Parameters Beyond 20% of Baseline (N = 25 Each) During Intubation, Incision and Operation
| Group of patients |
|---|
| Ivabradine | Control |
|---|
| Count | % | Count | % |
|---|
| HR: heart rate; SBP: systolic blood pressure; DBP: diastolic blood pressure; MAP: mean arterial pressure. |
| Change during intubation | | | | |
| Amount of change in HR | | | | |
| Decrease > 20% | 0 | 0.0% | 3 | 12.0% |
| Change within 20% | 25 | 100.0% | 20 | 80.0% |
| Increase > 20% | 0 | 0.0% | 2 | 8.0% |
| Amount of change in SBP | | | | |
| Decrease > 20% | 2 | 8.0% | 2 | 8.0% |
| Change within 20% | 20 | 80.0% | 20 | 80.0% |
| Increase > 20% | 3 | 12.0% | 3 | 12.0% |
| Amount of change in DBP | | | | |
| Decrease > 20% | 3 | 12.00% | 3 | 12.0% |
| Change within 20% | 17 | 68.0% | 18 | 72.0% |
| Increase > 20% | 5 | 20.0% | 4 | 16.0% |
| Amount of change in MAP | | | | |
| Decrease > 20% | 3 | 12.0% | 2 | 8.0% |
| Change within 20% | 20 | 80.0% | 19 | 76.0% |
| Change during incision and operation | | | | |
| Amount of change in HR | | | | |
| Decrease > 20% | 4 | 16.0% | 11 | 44.0% |
| Change < 20% | 19 | 76.0% | 10 | 40.0% |
| Increase > 20% | 2 | 8.0% | 4 | 16.0% |
| Amount of change in SBP | | | | |
| Decrease > 20% | 6 | 24.0% | 10 | 40.0% |
| Change < 20% | 17 | 68.0% | 14 | 56.0% |
| Increase > 20% | 2 | 8.0% | 1 | 4.0% |
| Amount of change in DBP | | | | |
| Decrease > 20% | 7 | 28.0% | 7 | 28.0% |
| Change < 20% | 16 | 64.0% | 14 | 56.0% |
| Increase > 20% | 2 | 8.0% | 4 | 16.0% |
| Amount of change in MAP | | | | |
| Decrease > 20% | 9 | 36.0% | 9 | 36.0% |
| Change < 20% | 14 | 56.0% | 15 | 60.0% |
| Increase > 20% | 2 | 8.0% | 1 | 4.0% |
Table 4. Change in Hemodynamic Parameters Beyond 20% of Baseline (N = 25 Each) During Extubation
| Change during extubation | Group of patients |
|---|
| Ivabradine | Control |
|---|
| Count | % | Count | % |
|---|
| HR: heart rate; SBP: systolic blood pressure; DBP: diastolic blood pressure; MAP: mean arterial pressure. |
| Amount of change in HR | | | | |
| Decrease > 20% | 0 | 0.0% | 0 | 0.0% |
| Change < 20% | 23 | 92.0% | 22 | 88.0% |
| Increase > 20% | 2 | 8.0% | 3 | 12.0% |
| Amount of change in SBP | | | | |
| Decrease > 20% | 1 | 4.0% | 0 | 0.0% |
| Change < 20% | 22 | 88.0% | 21 | 84.0% |
| Increase > 20% | 2 | 8.0% | 4 | 16.0% |
| Amount of change in DBP | | | | |
| Decrease > 20% | 0 | 0.0% | 0 | 0.0% |
| Change < 20% | 22 | 88.0% | 21 | 84.0% |
| Increase > 20% | 3 | 12.0% | 4 | 16.0% |
| Amount of change in MAP | | | | |
| Decrease > 20% | 1 | 4.0% | 0 | 0.0% |
| Change < 20% | 23 | 92.0% | 20 | 80.0% |
| Increase > 20% | 1 | 4.0% | 5 | 20.0% |
Table 5. Comparison of Total Change in Hemodynamic Stability (From Baseline Till End of Observation Period of Extubation) Among the Study Groups (N = 25 Each)
| Hemodynamic parameter | Group of patients | Independent sample t-test |
|---|
| Ivabradine | Control | t | P value |
|---|
| SD: standard deviation. |
| Total change in heart rate from baseline, mean (SD) | 6.00 (11.35) | -10.88 (16.45) | 4.224 | 0.000 |
| Total change in SBP from baseline, mean (SD) | -5.60 (18.58) | -8.96 (20.30) | 0.610 | 0.544 |
| Total change in DBP from baseline, mean (SD) | 3.64 (12.61) | -1.32 (14.03) | 1.315 | 0.195 |
| Total change in MAP from baseline, mean (SD) | -5.21 (13.41) | -5.35 (15.92) | 0.032 | 0.975 |
Table 6. Incidence of Bradycardia and Tachycardia Among the Study Participants (N = 25 Each)
| Group of patients | Total |
|---|
| Ivabradine | Control |
|---|
| Bradycardia | | | |
| Count | 1 | 0 | 1 |
| Expected count | 0.5 | 0.5 | 1.0 |
| % within group | 4.0% | 0.0% | 2.0% |
| Normal heart rate | | | |
| Count | 22 | 15 | 37 |
| Expected count | 18.5 | 18.5 | 37.0 |
| % within group | 88.0% | 60.0% | 74.0% |
| Tachycardia | | | |
| Count | 2 | 10 | 12 |
| Expected count | 6.0 | 6.0 | 12.0 |
| % within group | 8.0% | 40.0% | 24.0% |
| Total | | | |
| Count | 25 | 25 | 50 |
| Expected count | 25.0 | 25.0 | 50.0 |
| % within group | 100.0% | 100.0% | 100.0% |
Table 7. Incidence of Blood Pressure Among the Study Participants (N = 25 Each)
| Group of patients | Total |
|---|
| Ivabradine | Control |
|---|
| Normal | | | |
| Count | 19 | 20 | 39 |
| Expected count | 19.5 | 19.5 | 39.0 |
| % within group | 76.0% | 80.0% | 78.0% |
| Hypertension | | | |
| Count | 6 | 5 | 11 |
| Expected count | 5.5 | 5.5 | 11.0 |
| % within group | 24.0% | 20.0% | 22.0% |
| Total | | | |
| Count | 25 | 25 | 50 |
| Expected count | 25.0 | 25.0 | 50.0 |
| % within group | 100.0% | 100.0% | 100.0% |