Figures
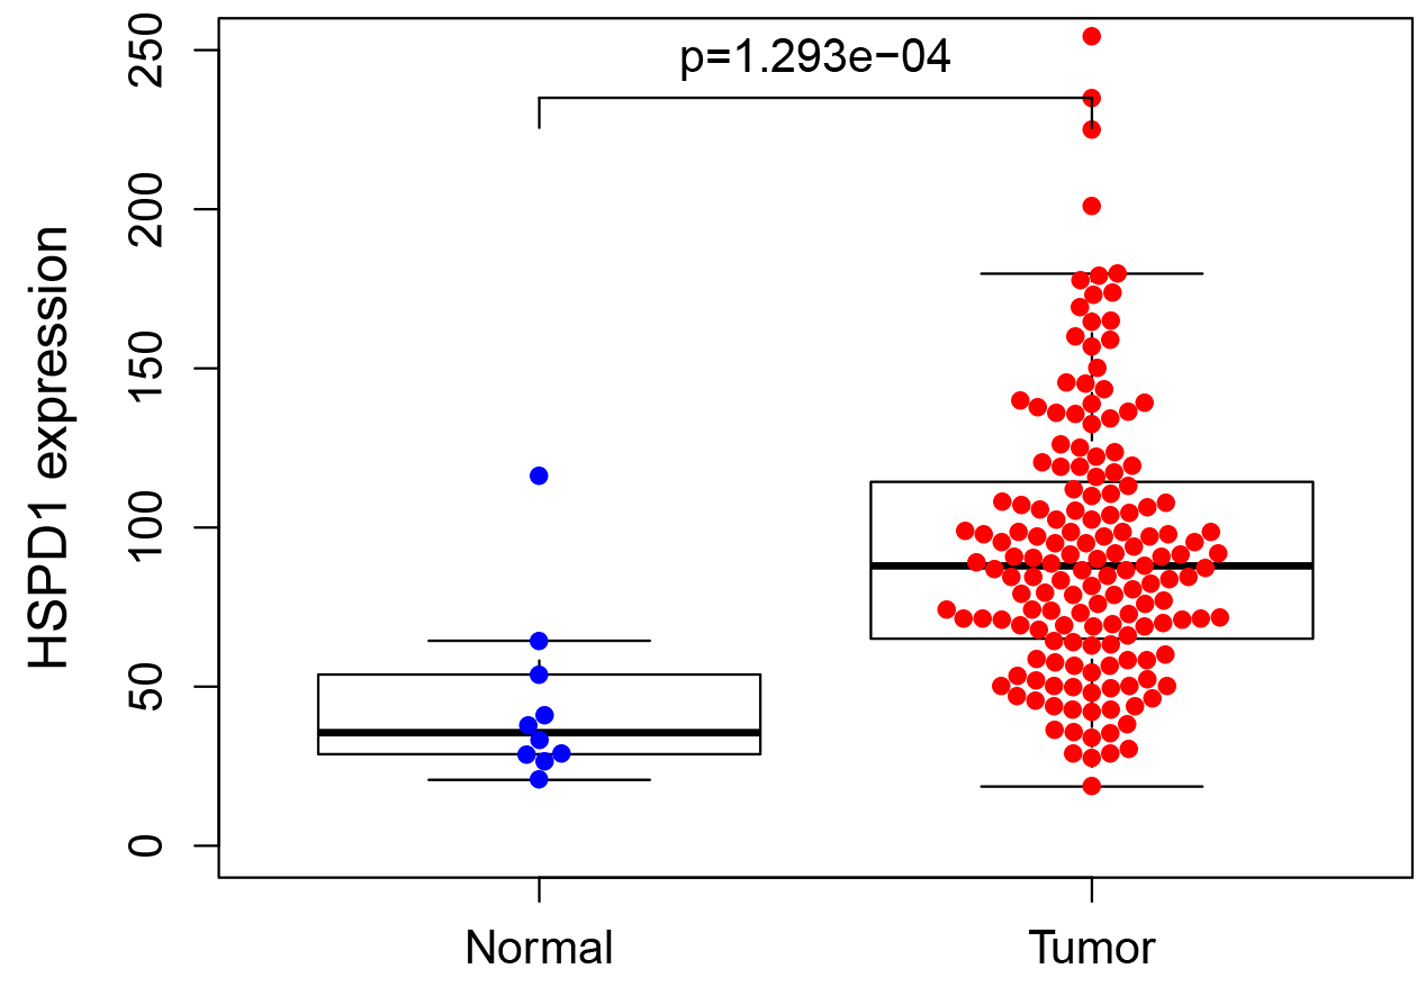
Figure 1. Expression of HSPD1 in esophagus cancer patients based on TCGA data. The expression level of HSPD1 in esophagus cancer tissues was significantly higher than that in adjacent non-neoplastic tissues (P = 0.0237). HSPD1: heat shock protein family D (Hsp60) member 1; TCGA: The Cancer Genome Atlas.
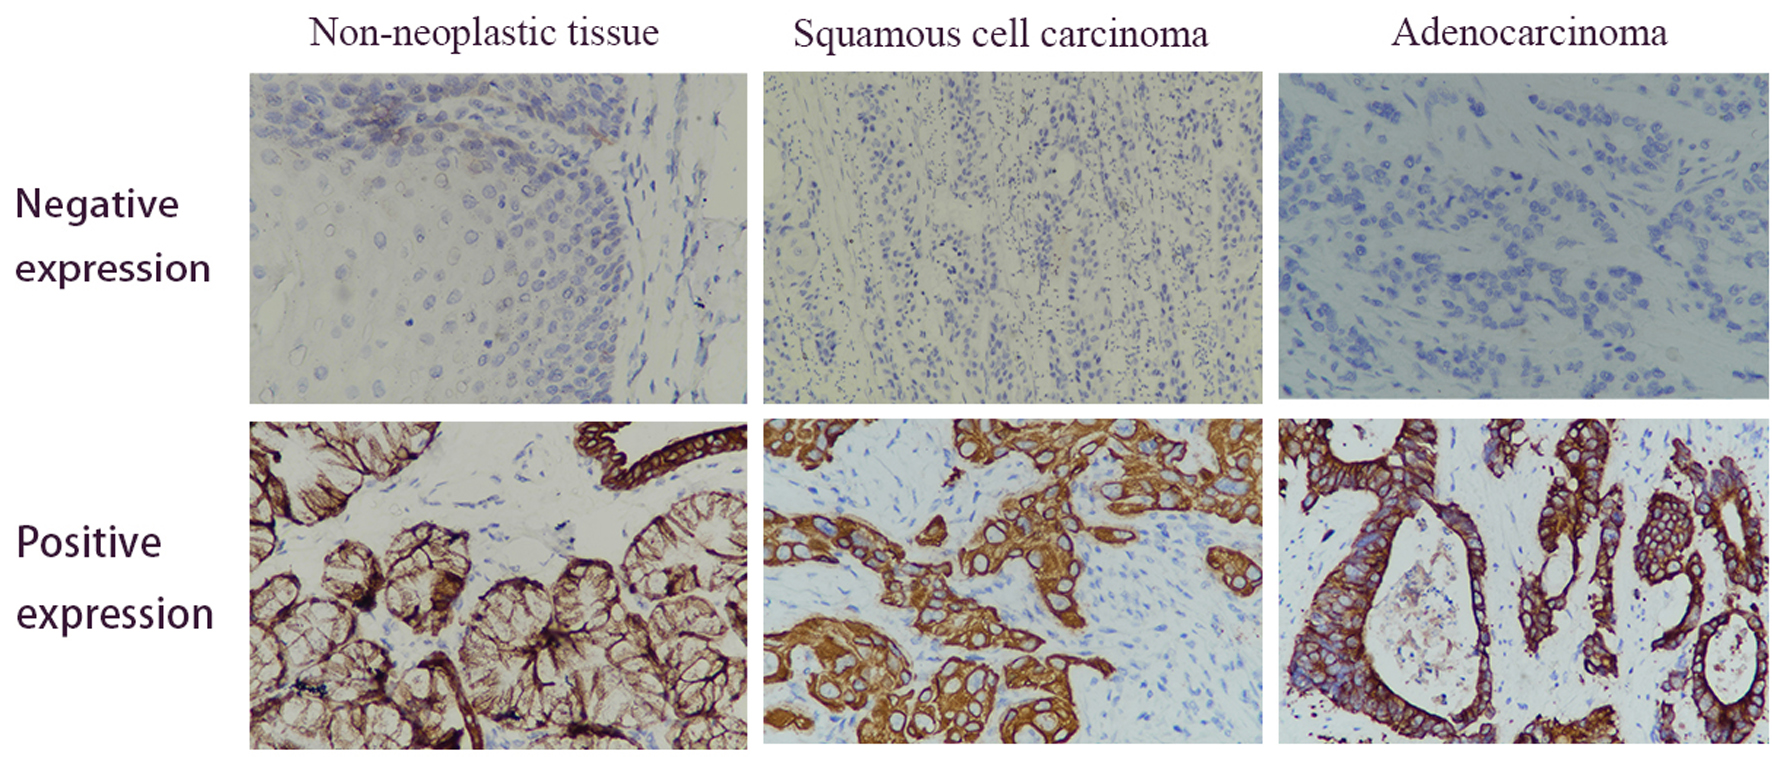
Figure 2. Immunohistochemical analysis of the HSPD1 expression in esophagus cancer and adjacent non-neoplastic tissues. Positive expression of HSPD1 was mainly found in the cytoplasm (magnification, × 400). HSPD1: heat shock protein family D (Hsp60) member 1.
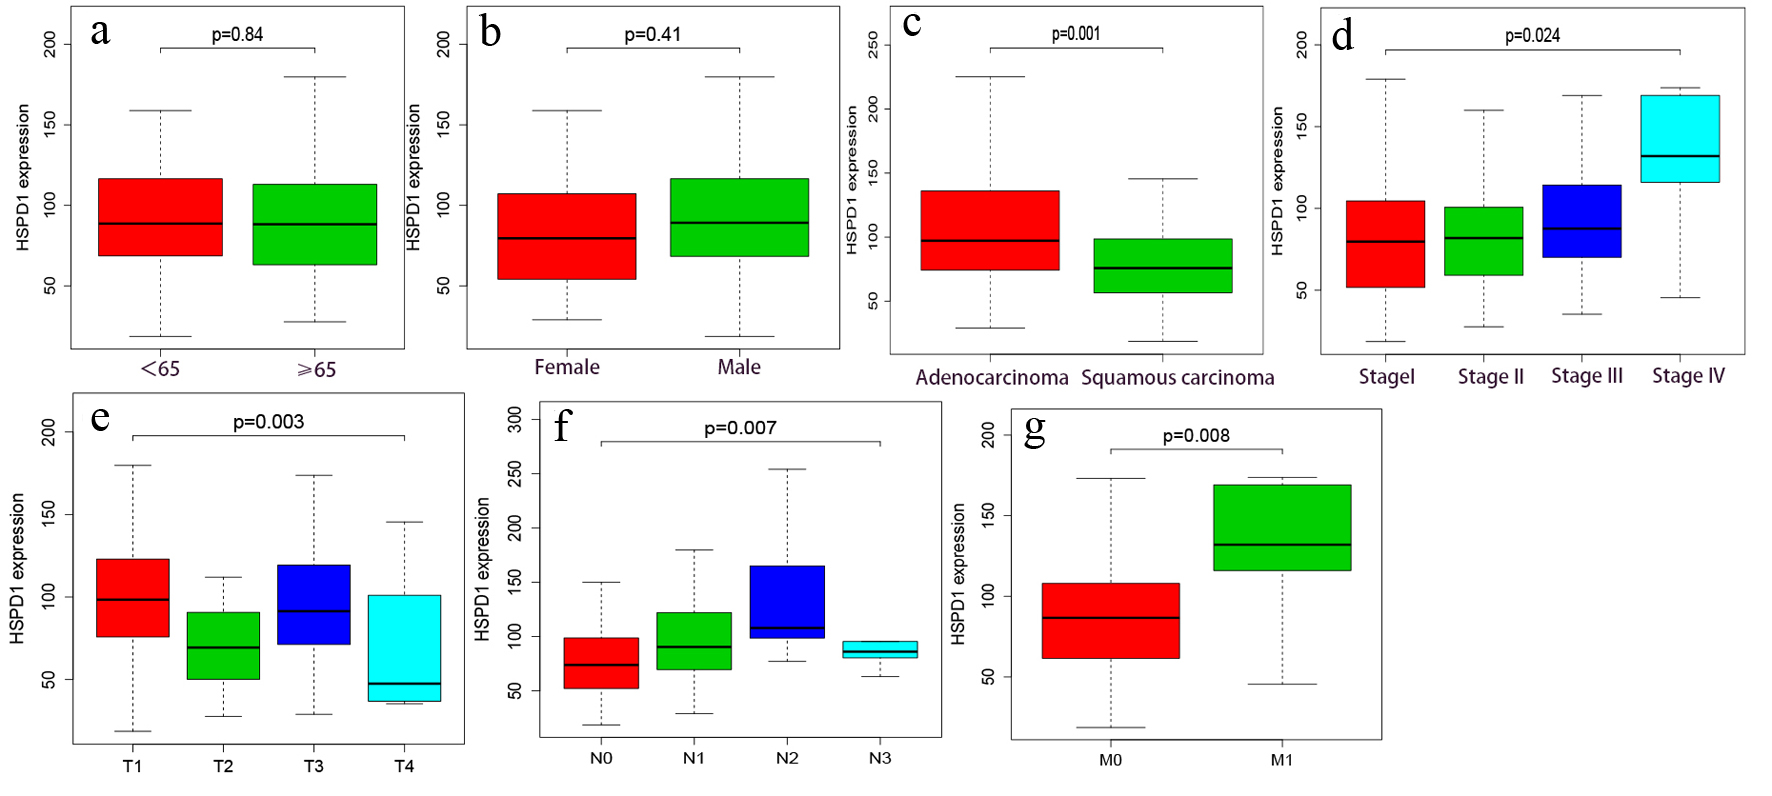
Figure 3. Association of HSPD1 expression with clinical variables based on TCGA data. (a) Age. (b) Gender. (c) Histological type. (d) Clinical stage. (e) T classification. (f) N classification. (g) M classification. HSPD1: heat shock protein family D (Hsp60) member 1; TCGA: The Cancer Genome Atlas.
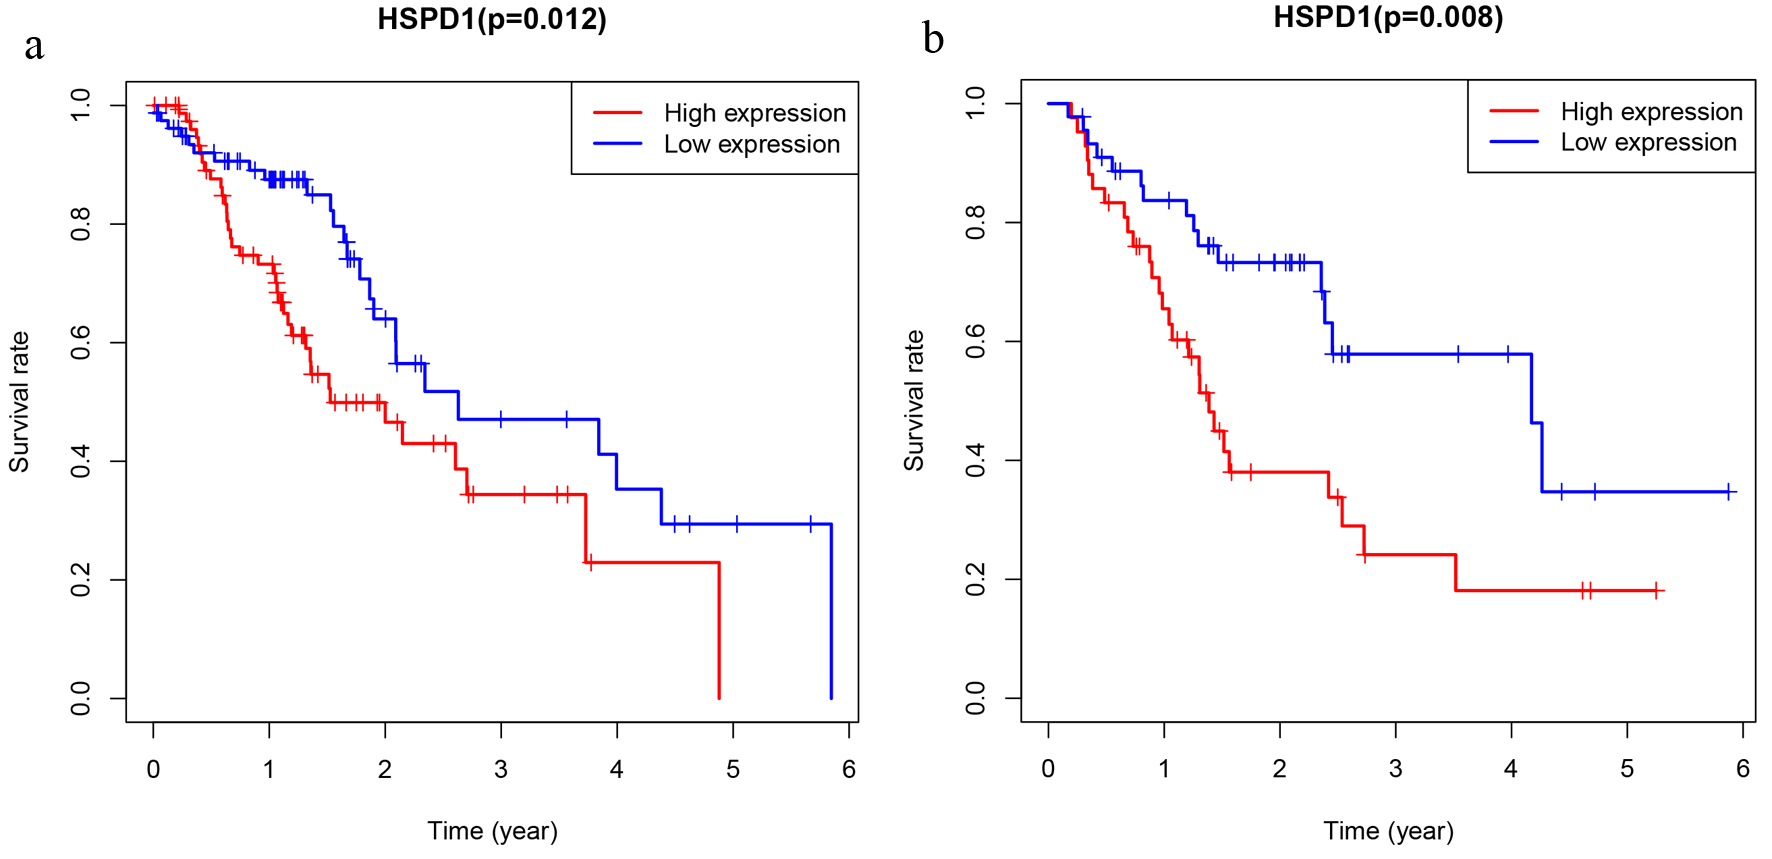
Figure 4. The prognostic significance of HSPD1 in esophagus cancer. Kaplan-Meier method and log-rank test were performed based on expression level of HSPD1 in esophagus cancer cohort from TCGA database (a) and our study (b). HSPD1: heat shock protein family D (Hsp60) member 1; TCGA: The Cancer Genome Atlas.
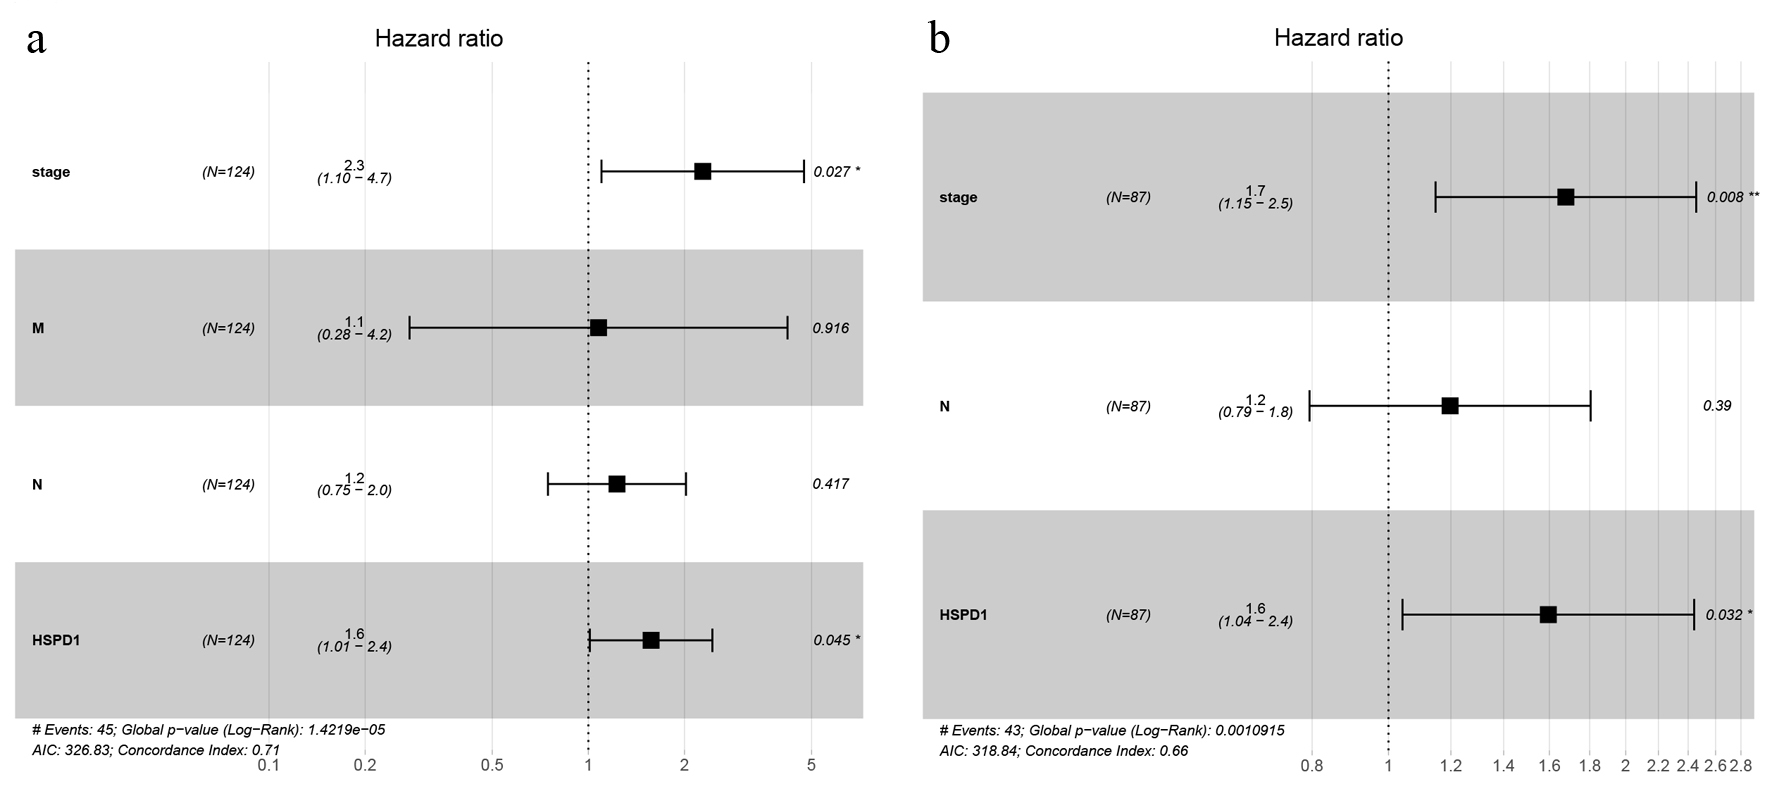
Figure 5. Forest plot of multivariate Cox regression analyses of overall survival in esophagus cancer cohort from TCGA database (a) and our study (b). TCGA: The Cancer Genome Atlas.
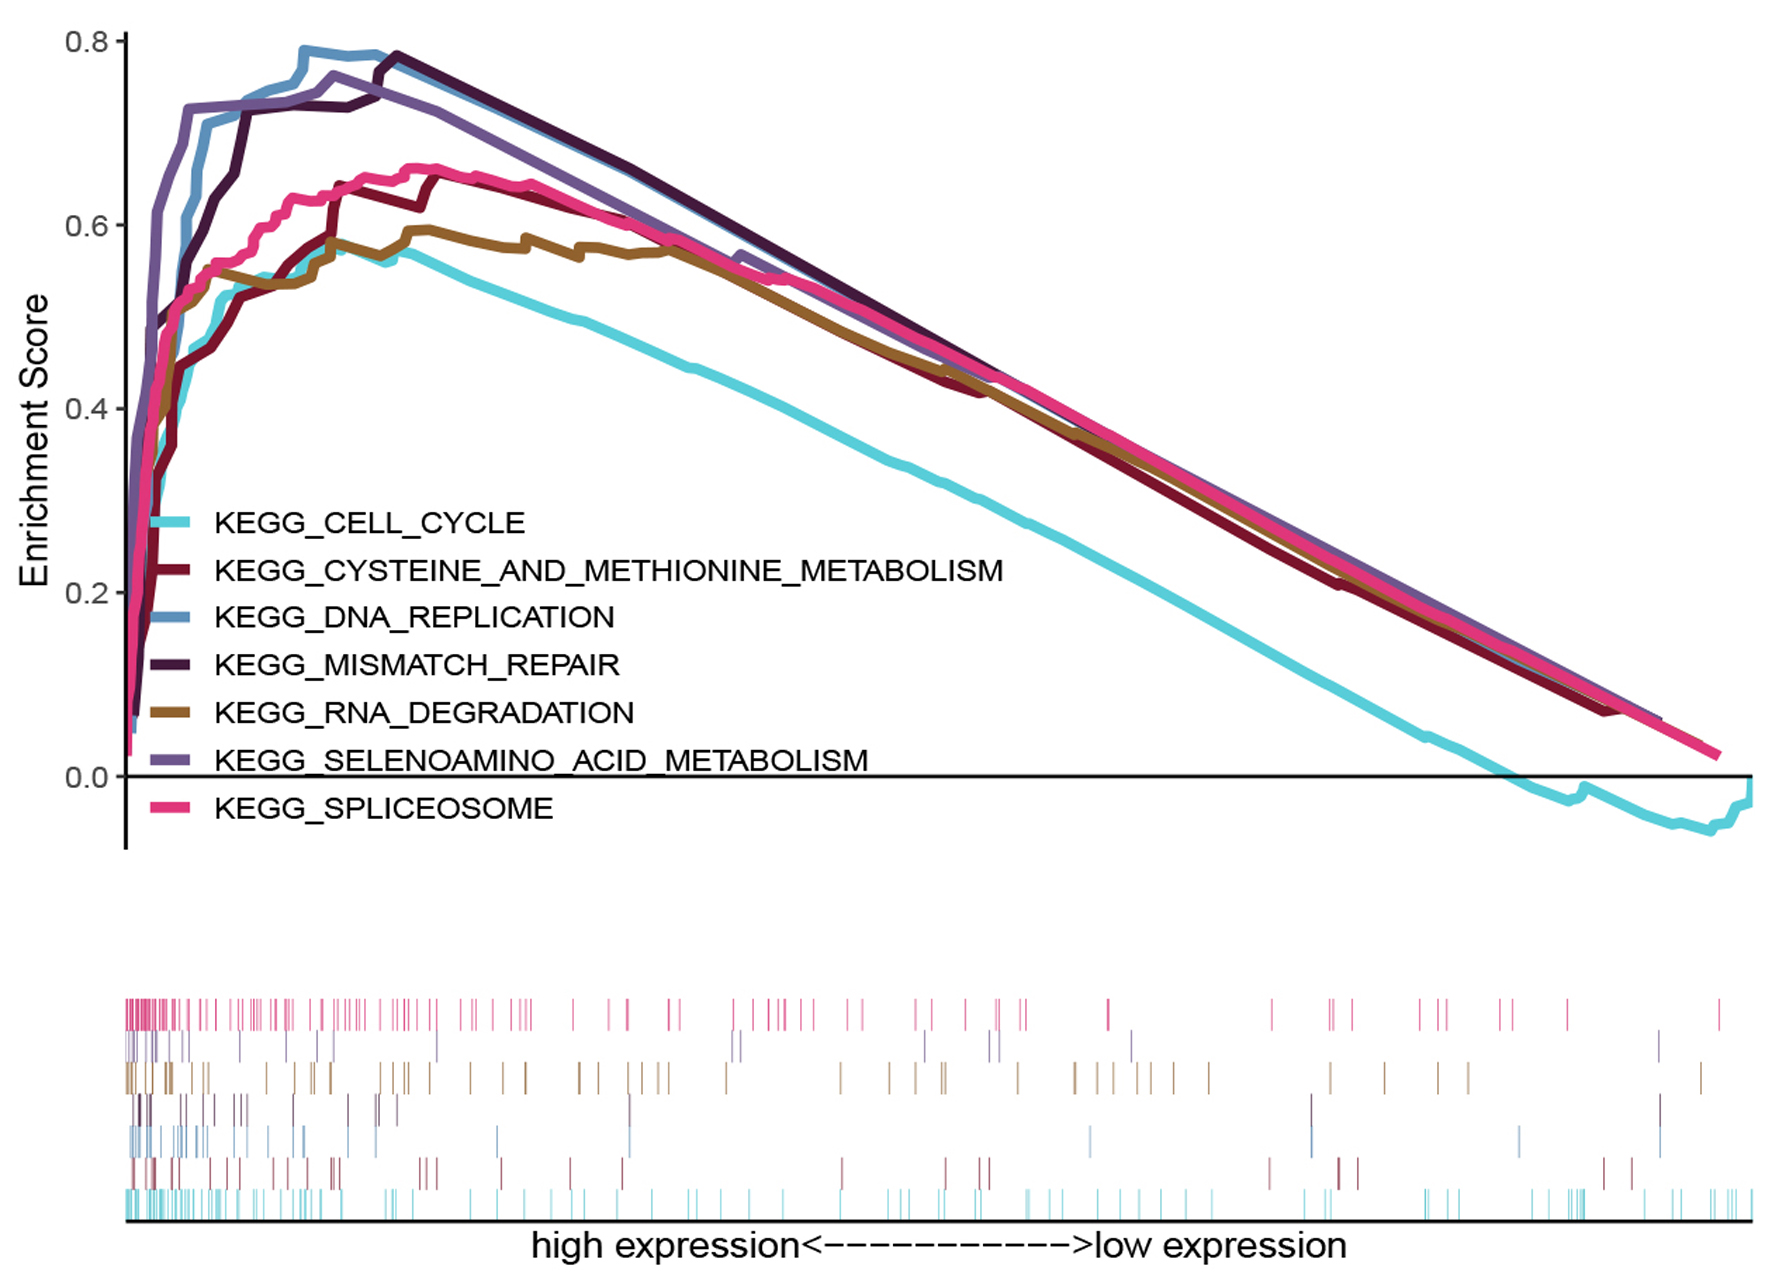
Figure 6. KEGG enrichment plots from GSEA. The GSEA results revealed that genes involved in cysteine and methionine metabolism, spliceosome, selenoamino acid metabolism, mismatch repair, RNA degration, DNA replication and cell cycle were differentially enriched in HSPD1-associated esophagus cancer. HSPD1: heat shock protein family D (Hsp60) member 1; GSEA: gene set enrichment analysis.
Tables
Table 1. HSPD1 Expression in Esophagus Cancer Tissues and Adjacent Non-Neoplastic Tissues
| Group | n | HSPD1 expression | P value |
|---|
| Low (%) | High (%) |
|---|
| *P < 0.05. HSPD1: heat shock protein family D (Hsp60) member 1. |
| Normal | 20 | 18 (90%) | 2 (10%) | < 0.001* |
| Tumor | 87 | 40 (46%) | 47 (54%) | |
Table 2. Logistic Regression of HSPD1 Expression and Clinicopathological Characteristics in TCGA Database
| Clinical characteristics | n | Odds ratio in expression | P value |
|---|
| *P < 0.05. HSPD1: heat shock protein family D (Hsp60) member 1; TCGA: The Cancer Genome Atlas. |
| Age | | | |
| < 65 vs. ≥ 65 | 159 | 0.995 (0.520 - 1.92) | 0.893 |
| Gender | | | |
| Female vs. male | 159 | 1.359 (0.56 - 3.39) | 0.45 |
| Pathology type | | | |
| Adenocarcinoma vs. squamous carcinoma | 158 | 0.488 (0.257 - 0.916) | 0.027* |
| Stage | | | |
| I-II vs. III-IV | 140 | 1.823 (0.923 - 3.646) | 0.086 |
| T | | | |
| T0-2 vs. T3-4 | 144 | 1.863 (0.962 - 3.648) | 0.067 |
| N | | | |
| N0 vs. N1-3 | 142 | 2.109 (1.083 - 4.167) | 0.029* |
| M | | | |
| M0 vs. M1 | 128 | 7.875 (1.343 - 149.581) | 0.057 |
Table 3. Associations Between HSPD1 Expression and Clinicopathological Characteristics in Our Esophagus Cancer Patients
| Characteristics | n | HSPD1 protein expression | P value |
|---|
| Low (%) | High (%) |
|---|
| *P < 0.05. HSPD1: heat shock protein family D (Hsp60) member 1. |
| Age | | | | 0.996 |
| ≥ 65 | 50 | 23 (46.0) | 27 (54.0) | |
| < 65 | 37 | 17 (45.9) | 20 (54.1) | |
| Stage | | | | 0.001* |
| I-II | 42 | 27 (64.3) | 15 (35.7) | |
| III-IV | 45 | 13 (28.9) | 32 (71.1) | |
| T | | | | 0.381 |
| T0-T2 | 50 | 25 (50.0) | 25 (50.0) | |
| T3-T4 | 37 | 15 (40.5) | 22 (59.5) | |
| N | | | | 0.014* |
| N0 | 42 | 25 (59.5) | 17 (40.5) | |
| N1-N3 | 45 | 15 (33.3) | 30 (66.7) | |
| M | | | | 0.335 |
| M0 | 80 | 38 (47.5) | 42 (52.5) | |
| M1 | 7 | 2 (28.6) | 5 (71.4) | |
| Histological type | | | | 0.116 |
| Squamous carcinoma | 75 | 37 (49.3) | 38 (50.7) | |
| Adenocarcinoma | 12 | 3 (25.0) | 9 (75.0) | |
| Histological grade | | | | < 0.001* |
| Well | 40 | 27 (67.5) | 13 (32.5) | |
| Moderately/poorly | 47 | 13 (27.7) | 34 (72.3) | |