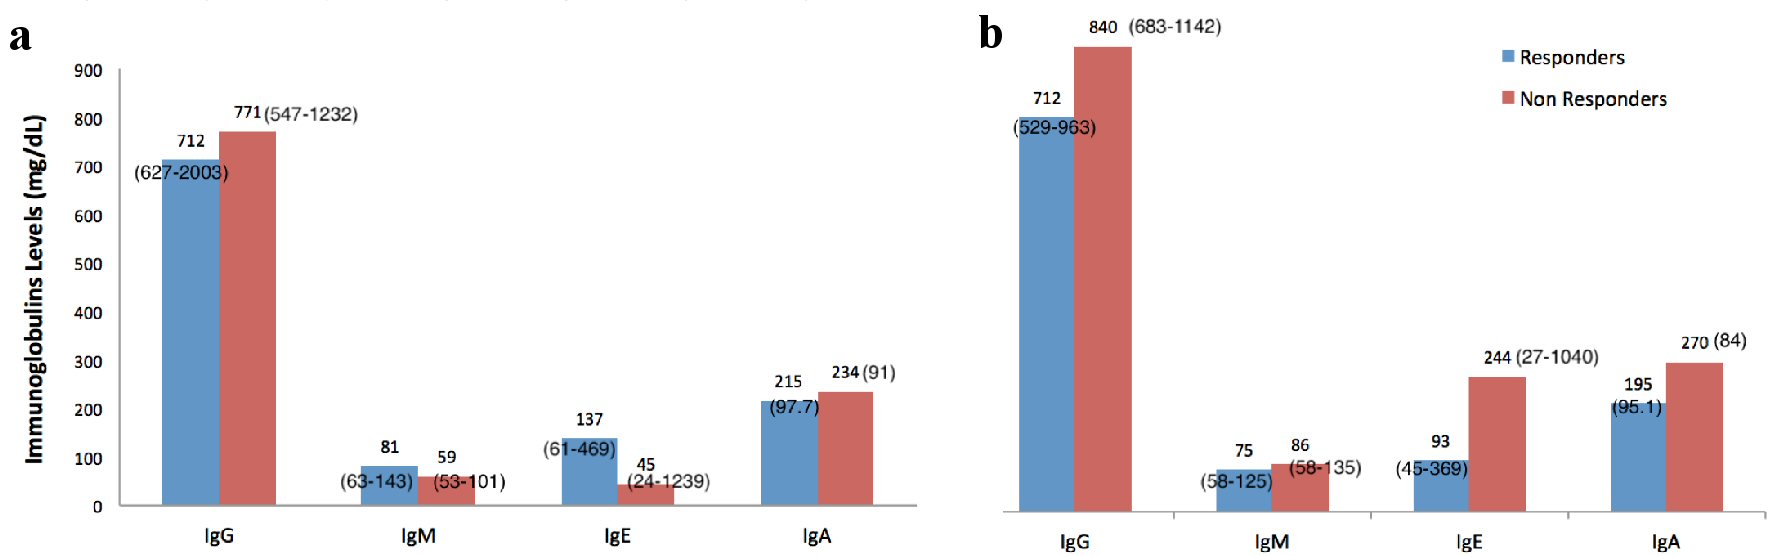
Figure 1. Immunoglobulins levels and patients’ microbiological (a) and clinical response (b). Data are presented as mean and SD when normally distributed and as median and interquartile range when not normally distributed. SD: standard deviation.
| Journal of Clinical Medicine Research, ISSN 1918-3003 print, 1918-3011 online, Open Access |
| Article copyright, the authors; Journal compilation copyright, J Clin Med Res and Elmer Press Inc |
| Journal website https://www.jocmr.org |
Short Communication
Volume 13, Number 1, January 2021, pages 64-72
Correlation of Immunoglobulins and Lymphocytes Levels With the Clinical and Microbiological Response of Septic Patients With Gram-Negative Bacteremia
Figures
Tables
| Variablea, b | Microbiological response (18 patients, 75%) | No microbiological response (6 patients, 25%) | P value |
|---|---|---|---|
| aContinuous data presented as mean and SD when normally distributed. bCategorical data presented as number (proportion). cContinuous data presented as median and interquartile range when not normally distributed. APACHE II: Acute Physiology and Chronic Health Evaluation II; SOFA: Sequential Organ Failure Assessment; CRP: C-reactive protein; Ig: immunoglobulin; WBCs: white blood cells; NK: natural killer; HLA: human leukocyte antigen; SD: standard deviation. | |||
| Age (years) | 54 (16.4) | 53 (20.5) | 0.8 |
| Female, n (%) | 7 (87) | 1 (12.5) | 0.6 |
| APACHE II score | 11 (6.9) | 13 (8.3) | 0.5 |
| SOFA score | 7.2 (4.0) | 9 (4.2) | 0.4 |
| CRP (mg/dL) | 12 (9.7) | 10 (8.5) | 0.6 |
| Fever, n (%) | 13 (54) | 2 (8.3) | 0.4 |
| Days to microbiological response (18 patients, %) | 6.5 (1.3) | ||
| Clinical response (%) | 12 (75) | 4 (25) | 1 |
| Admission typeb | |||
| Multi-injured, n (%) | 5 (83) | 1 (17) | |
| ARDS-pneumonia (%) | 4 (80) | 1 (20) | |
| Brain hemorrhage-coma (%) | 4 (80) | 1 (20) | |
| Traumatic brain injury (%) | 2 (67) | 1 (33) | |
| Stroke (%) | 1 (100) | ||
| Status epileptics (%) | 2 (100) | ||
| Pancreatitis (%) | 1(100) | ||
| Amyotrophic lateral sclerosis (%) | 1 (100) | ||
| Ig concentrations (mg/dL)a, c | |||
| IgG | 712 (627 - 1,003) | 771 (547 - 1,232) | 0.4 |
| IgM | 81 (63 - 143) | 59 (53 - 101) | 1.0 |
| IgE | 137 (61 - 469) | 45 (24 - 1,239) | 0.7 |
| IgA | 215 (97,7) | 234 (91) | 0.1 |
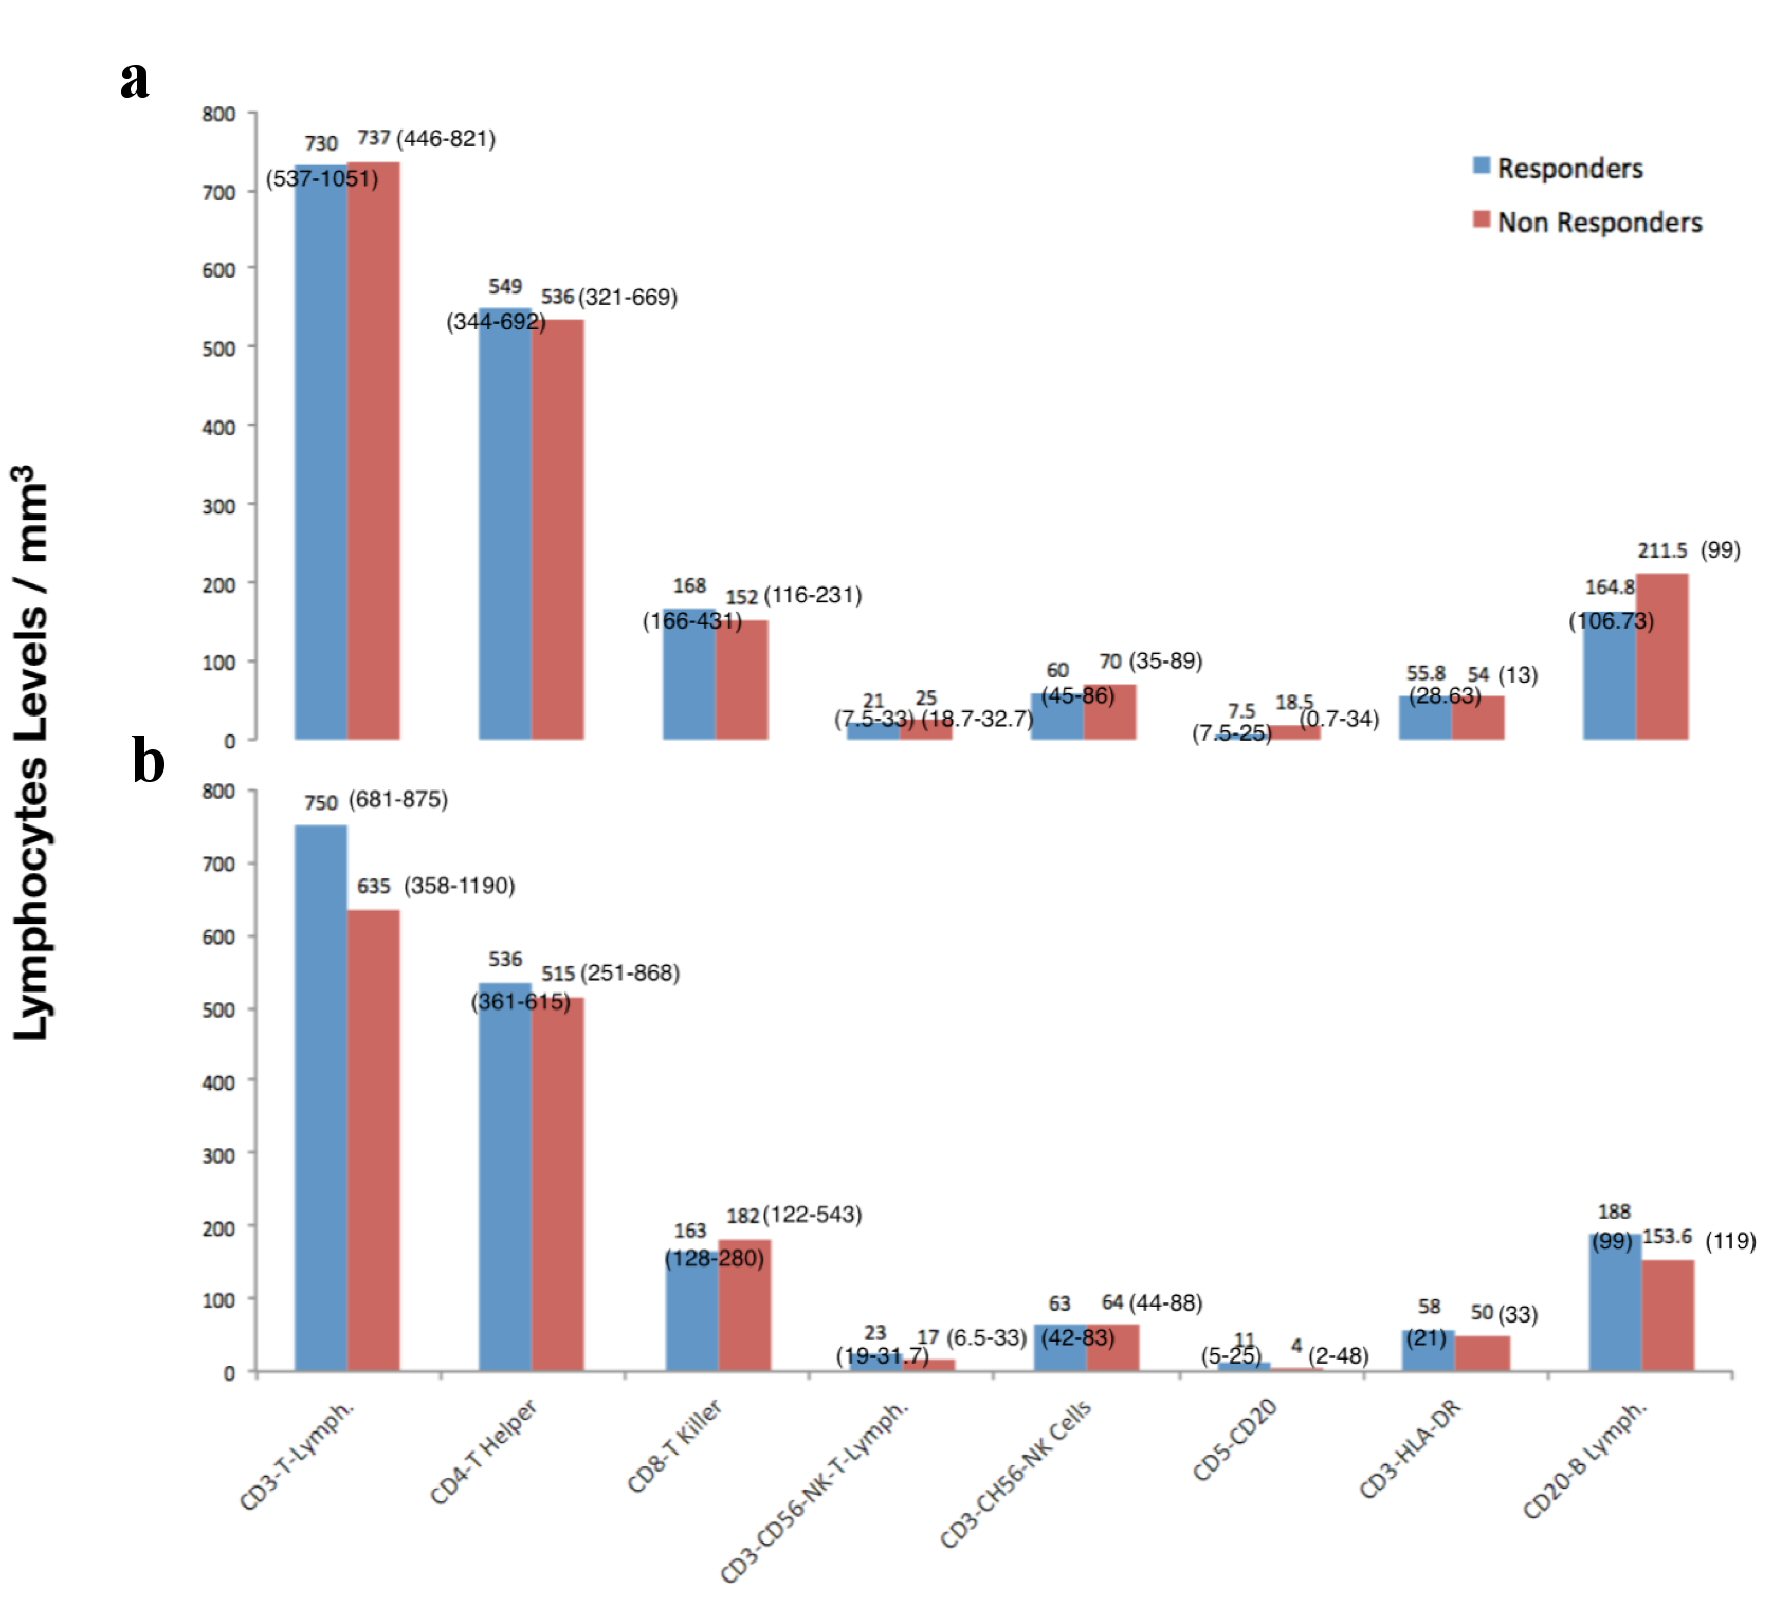
| Lymphocytes and WBCs concentrations (absolute number/mm3)a, c | |||
| WBCs | 9,450 (8,667 - 11,975) | 10,750 (5,425 - 16,145) | 0.8 |
| Lymphocytes | 9.6 (7.7 - 12) | 10 (8 - 12) | 0.6 |
| CD3-T-lymphocytes | 730 (537 - 1,051) | 737 (446 - 812) | 0.6 |
| CD4-T helper | 549 (344 - 692) | 536 (321 - 669) | 1.0 |
| CD8-T killer | 168 (126 - 431) | 152 (116 - 231) | 0.3 |
| CD3-CD56-NK-T-lymphocytes | 21 (7.5 - 33) | 25 (18.7 - 32.7) | 0.4 |
| CD3-CH56-NK cells | 60 (45 - 86) | 70 (35 - 89) | 0.7 |
| CD5-CD20 | 7.5 (7.5 - 25) | 18.5 (0.7 - 34) | 0.8 |
| CD3-HLA-DR | 55.8 (28.63) | 54 (13) | 0.8 |
| CD20-B lymphocytes | 164.8 (106.73) | 211.5 (99) | 0.3 |
| CD4/CD8 ratio | 2.3 (1.2) | 1.7 (0.9) | 0.3 |
| Variablea, b | Clinical response (16 patients, 64%) | No clinical response (8 patients, 36%) | P value |
|---|---|---|---|
| aContinuous data presented as mean and SD when normally distributed. bCategorical data presented as number (proportion). cContinuous data presented as median and interquartile range when not normally distributed. APACHE II: Acute Physiology and Chronic Health Evaluation II; SOFA: Sequential Organ Failure Assessment; CRP: C-reactive protein; Ig: immunoglobulin; WBCs: white blood cells; NK: natural killer; HLA: human leukocyte antigen; SD: standard deviation. | |||
| Age (years) | 55.6 (17.5) | 51.6 (16.8) | 0.6 |
| Female, n (%) | 5 (20.8) | 3 (16) | 0.4 |
| APACHE II score | 13.5 (6.7) | 8.3 (7.1) | 0.1 |
| SOFA score | 8.2 (3.9) | 6.7 (4.4) | 0.4 |
| CRP (mg/dL) | 10.6 (6.5) | 15.5 (13.3) | 0.3 |
| Fever, n (%) | 10 (59) | 7 (41) | 0.5 |
| Days to clinical response (16 patients, %) | 4 (1.2) | ||
| Microbiological response, n (%) | 12 (67) | 6 (33) | 1 |
| Early microbiological response, n (%) | 5 (83) | 1 (17) | 0.6 |
| Admission typeb | |||
| Multi-injured, n (%) | 4 (67) | 2 (33) | |
| ARDS-pneumonia (%) | 4 (80) | 1 (20) | |
| Brain hemorrhage-coma (%) | 3 (60) | 2 (40) | |
| Traumatic brain injury (%) | 2 (67) | 1 (33) | |
| Stroke (%) | 1 (100) | ||
| Status epileptics (%) | 2 (100) | ||
| Pancreatitis (%) | 1 (100) | ||
| Amyotrophic lateral sclerosis (%) | 1 (100) | ||
| Ig concentrationsa, c | |||
| IgG | 712 (529 - 963) | 840 (683 - 1,142) | 0.3 |
| IgM | 75 (58 - 125) | 86 (58 - 135) | 0.8 |
| IgE | 93 (45 - 369) | 244 (27 - 1,040) | 0.6 |
| IgA | 195 (91.5) | 270 (84) | 0.06 |
| Lymphocytes and WBCs concentrations (absolute number/mm3)a, c | |||
| WBCs | 9,100 (8,602 - 12,175) | 10,670 (5,525 - 21,180) | 0.6 |
| Lymphocytes | 9.6 (8.2 - 10.9) | 10.3 (6.9 - 14.2) | 0.9 |
| CD3-T-lymphocytes | 750 (681 - 875) | 635 (358 - 1,190) | 0.6 |
| CD4-T helper | 563 (361 - 615) | 515 (251 - 867) | |
| CD8-T killer | 163 (128 - 280) | 182 (122 - 543) | 0.6 |
| CD3-CD56-NK-T-lymphocytes | 23 (19 - 31.7) | 17 (6.5 - 33) | 0.6 |
| CD3-CH56-NK cells | 63 (42 - 83) | 64 (44 - 88) | 0.7 |
| CD5-CD20 | 11 (5 - 25) | 4 (2 - 48) | 0.4 |
| CD3-HLA-DR | 58 (21) | 50 (33) | 0.5 |
| CD20-B lymphocytes | 188 (99) | 153 (119) | 0.4 |
| CD4/CD8 ratio | 2.2 (1) | 2 (1.4) | 0.7 |