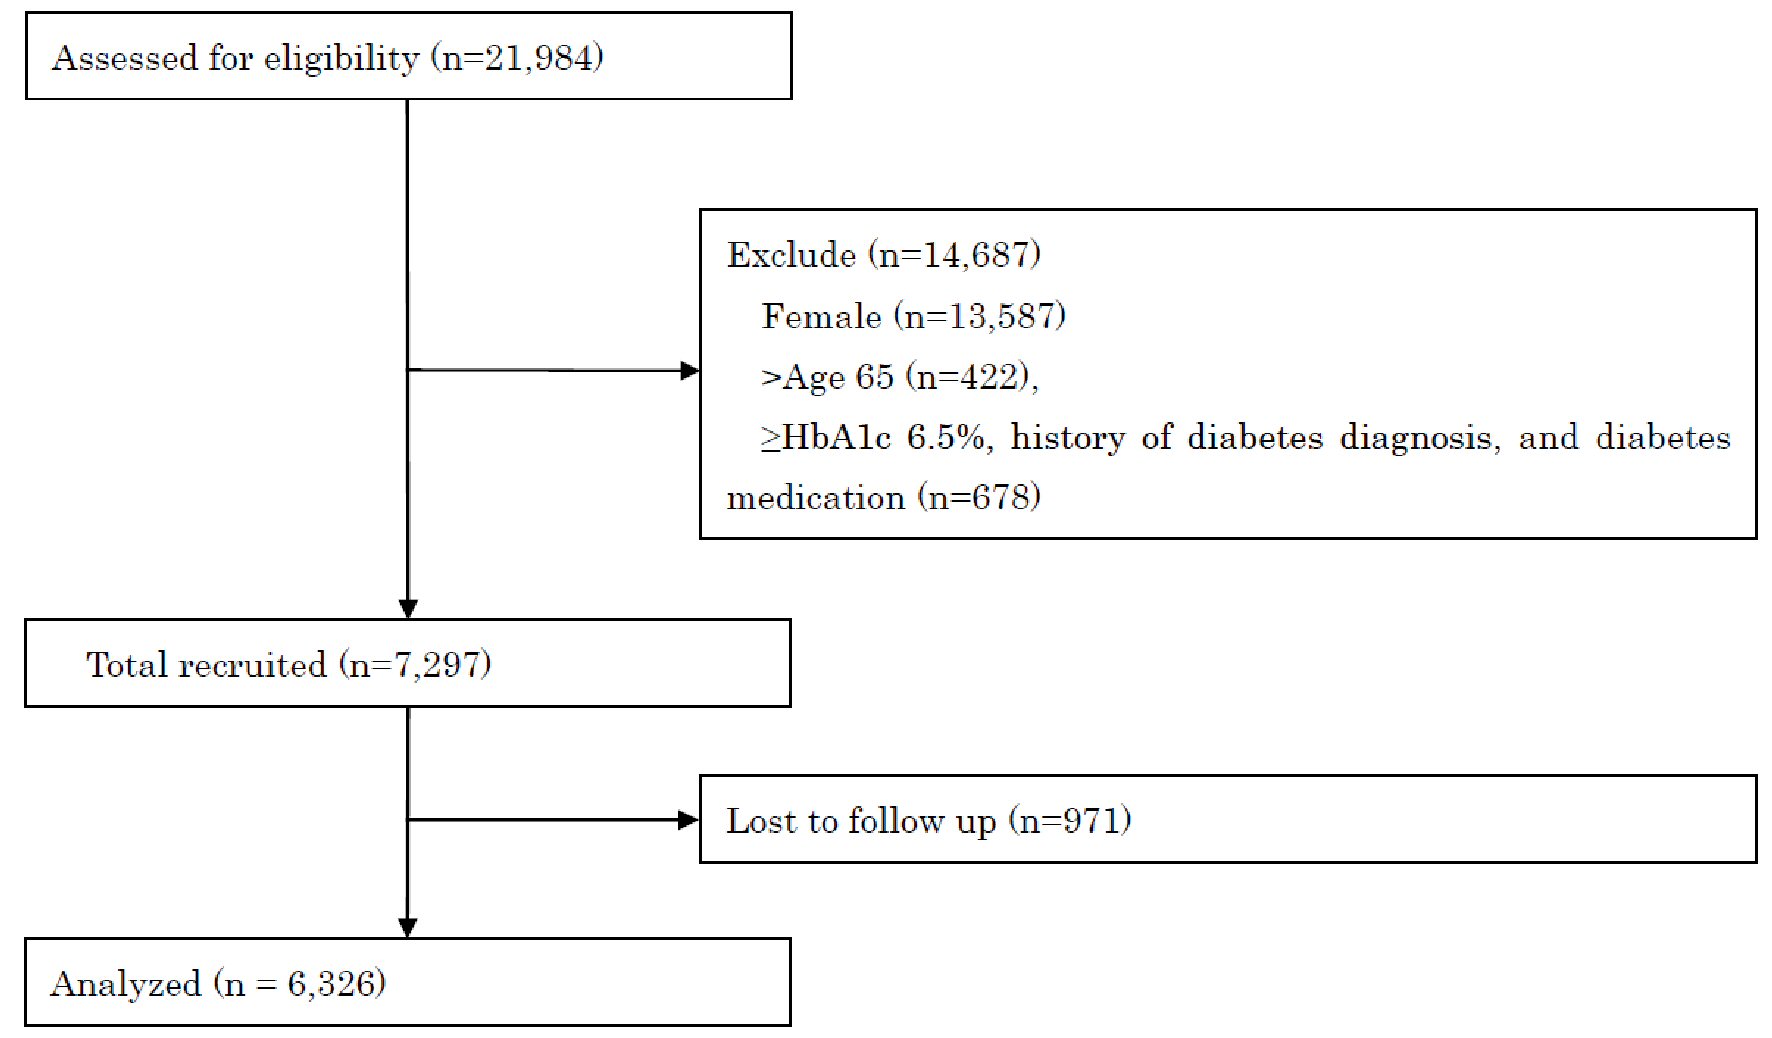
Figure 1. STROBE flow-chart of participants. STROBE: Strengthening the Reporting of Observational Studies in Epidemiology; HbA1c: HbA1c: hemoglobin A1c.
| Journal of Clinical Medicine Research, ISSN 1918-3003 print, 1918-3011 online, Open Access |
| Article copyright, the authors; Journal compilation copyright, J Clin Med Res and Elmer Press Inc |
| Journal website https://www.jocmr.org |
Original Article
Volume 12, Number 12, December 2020, pages 816-823
Association Between Psychological Distress and Stress-Related Symptoms and Increased Risk of Type 2 Diabetes in Male Individuals: An Observational Study
Figures
Tables
| Variables | All (n = 6,326) | Non-diabetes (n = 6,197) | New-onset diabetes (n = 129) | P value |
|---|---|---|---|---|
| Mean (standard deviation) or n (%). BMI: body mass index; HDL-C: high-density lipoprotein cholesterol; HbA1c: hemoglobin A1c. | ||||
| Age, years | 47.4 (9.5) | 47.3 (9.5) | 52.3 (8.4) | < 0.001 |
| BMI, kg/m2 | 23.44 (3.38) | 23.37 (3.31) | 26.94 (4.61) | < 0.001 |
| Smoking, n (%) | 2,096 (33.1) | 2,048 (33.0) | 48 (37.2) | 0.320 |
| Exercise, n (%) | ||||
| Exercise habit | 922 (26.3) | 898 (26.2) | 24 (30.4) | 0.403 |
| Physical activity | 1,490 (42.5) | 1,453 (42.4) | 37 (47.4) | 0.370 |
| Fast walking speed | 1,970 (56.1) | 1,931 (56.3) | 39 (49.4) | 0.220 |
| Dietary habits, n (%) | ||||
| Skipping breakfast | 753 (21.5%) | 736 (21.5%) | 17 (21.5%) | 0.992 |
| Late-night dinner | 1,381 (39.4%) | 1,356 (39.6%) | 25 (31.6%) | 0.154 |
| Drinking alcohol, n (%) | ||||
| Everyday | 1,684 (34.5%) | 1,651 (34.5%) | 33 (32.0%) | 0.351 |
| Blood pressure, mm Hg | ||||
| Systolic | 126.2 (15.1) | 126.0 (15.0) | 134.1 (17.5) | < 0.001 |
| Diastolic | 79.6 (10.6) | 79.5 (10.6) | 85.1 (11.1) | < 0.001 |
| Laboratory data | ||||
| Triglycerides, mg/dL | 119.1 (97.8) | 118.2 (97.8) | 163.7 (89.1) | < 0.001 |
| HDL-C, mg/dL | 62.1 (15.9) | 62.3 (15.9) | 54.6 (12.9) | < 0.001 |
| HbA1c, % | 5.54 (0.31) | 5.53 (0.30) | 6.13 (0.25) | < 0.001 |
| Psychological variables, points | ||||
| Vigor | 2.2 (0.8) | 2.2 (0.8) | 2.3 (0.9) | 0.905 |
| Anger-irritability | 2.1 (0.8) | 2.1 (0.8) | 2.1 (0.8) | 0.423 |
| Fatigue | 2.1 (0.8) | 2.1 (0.8) | 2.1 (0.8) | 0.477 |
| Anxiety | 2.0 (0.7) | 2.0 (0.7) | 2.0 (0.7) | 0.796 |
| Depression | 1.6 (0.6) | 1.6 (0.6) | 1.6 (0.6) | 0.830 |
| Somatic symptom, points | ||||
| Total score | 1.6 (0.5) | 1.6 (0.5) | 1.7 (0.6) | 0.121 |
| Variables | Prevalence, % | Adjusted hazard ratioa | P value |
|---|---|---|---|
| aAdjusted for age, body mass index, and hemoglobin A1c. *P value < 0.05. | |||
| Psychological variables | |||
| Vigor | 47.7 | 0.88 (0.62 - 1.25) | 0.478 |
| Anger-irritability | 39.8 | 1.29 (0.91 - 1.83) | 0.156 |
| Fatigue | 45.6 | 1.06 (0.74 - 1.51) | 0.753 |
| Anxiety | 47.7 | 0.89 (0.62 - 1.26) | 0.506 |
| Depression | 31.4 | 1.54 (1.07 - 2.22) | 0.020* |
| Stress-related symptom | |||
| 1. Dizziness | 4.8 | 1.07 (0.47 - 2.45) | 0.864 |
| 2. Joints pain | 11.7 | 1.20 (0.72 - 2.00) | 0.490 |
| 3. Headache | 10.6 | 1.98 (1.18 - 3.34) | 0.010* |
| 4. Shoulder stiffness | 33.2 | 1.56 (1.10 - 2.23) | 0.014* |
| 5. Lumbago | 28.8 | 1.10 (0.75 - 1.61) | 0.626 |
| 6. Tired eyes | 38.6 | 1.24 (0.87 - 1.77) | 0.234 |
| 7. Short of breath | 5.1 | 1.37 (0.71 - 2.63) | 0.345 |
| 8. Bowel problems | 11.9 | 1.28 (0.72 - 2.29) | 0.398 |
| 9. Appetite loss | 4.3 | 1.43 (0.62 - 3.33) | 0.403 |
| 10. Constipation/diarrhea | 14.3 | 1.71 (1.04 - 2.80) | 0.034* |
| 11. Insomnia | 15.5 | 1.07 (0.67 - 1.70) | 0.784 |
| Variables | Prevalence, % | Adjusted hazard ratioa | P value |
|---|---|---|---|
| aAdjusted for age, body mass index, and hemoglobin A1c. *P value < 0.05. | |||
| Depression subscale | |||
| 1. I have been depressed | 19.8 | 1.18 (0.77 - 1.82) | 0.441 |
| 2. I have thought that doing anything was a hassle | 12.8 | 1.21 (0.71 - 2.09) | 0.482 |
| 3. I have been unable to concentrate | 11.2 | 1.34 (0.75 - 2.39) | 0.323 |
| 4. I have felt gloomy | 20.5 | 1.30 (0.83 - 2.02) | 0.252 |
| 5. I have been unable to handle work | 5.4 | 2.18 (1.14 - 4.19) | 0.019* |
| 6. I have felt sad | 8.5 | 1.93 (1.14 - 3.26) | 0.015* |
| Variables | Vigor | Anger-irritability | Fatigue | Anxiety | Depression |
|---|---|---|---|---|---|
| Dietary habits | |||||
| Skipping breakfast | -0.001 | 0.065 | 0.059 | 0.055 | 0.076 |
| P value | 0.930 | < 0.001 | < 0.001 | < 0.001 | < 0.001 |
| Late-night dinner | -0.026 | 0.118 | 0.165 | 0.122 | 0.126 |
| P value | 0.133 | < 0.001 | < 0.001 | < 0.001 | < 0.001 |
| Drinking alcohol | |||||
| Everyday | 0.001 | 0.019 | -0.024 | 0.011 | -0.005 |
| P value | 0.929 | 0.197 | 0.097 | 0.461 | 0.710 |