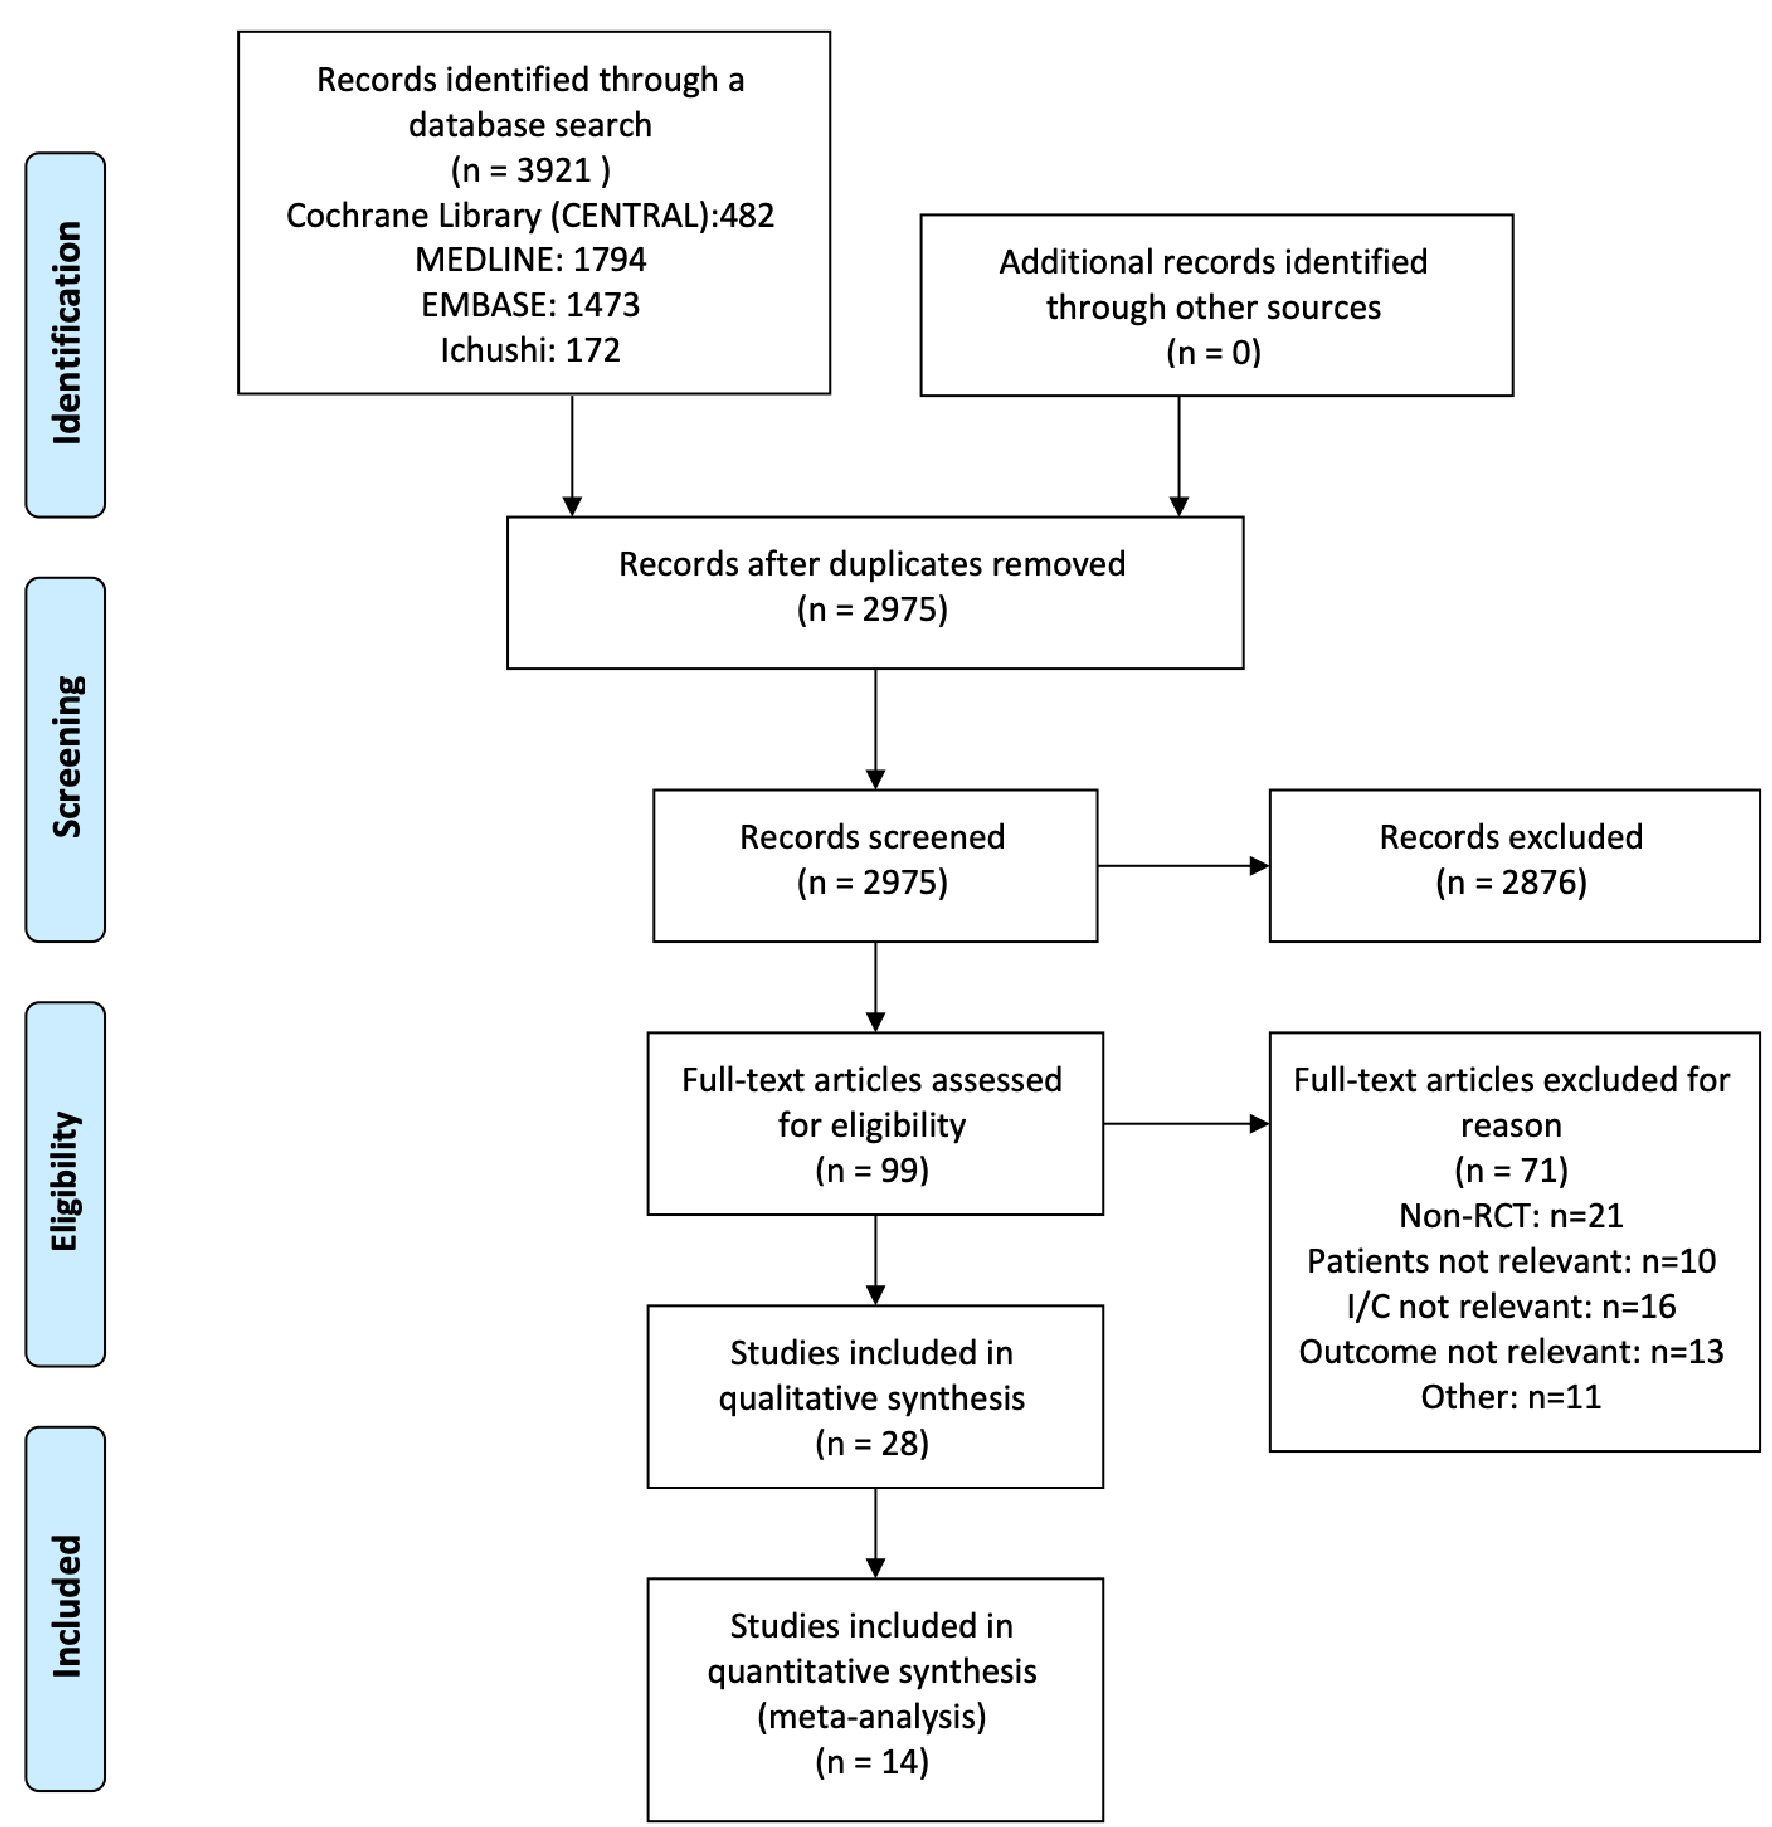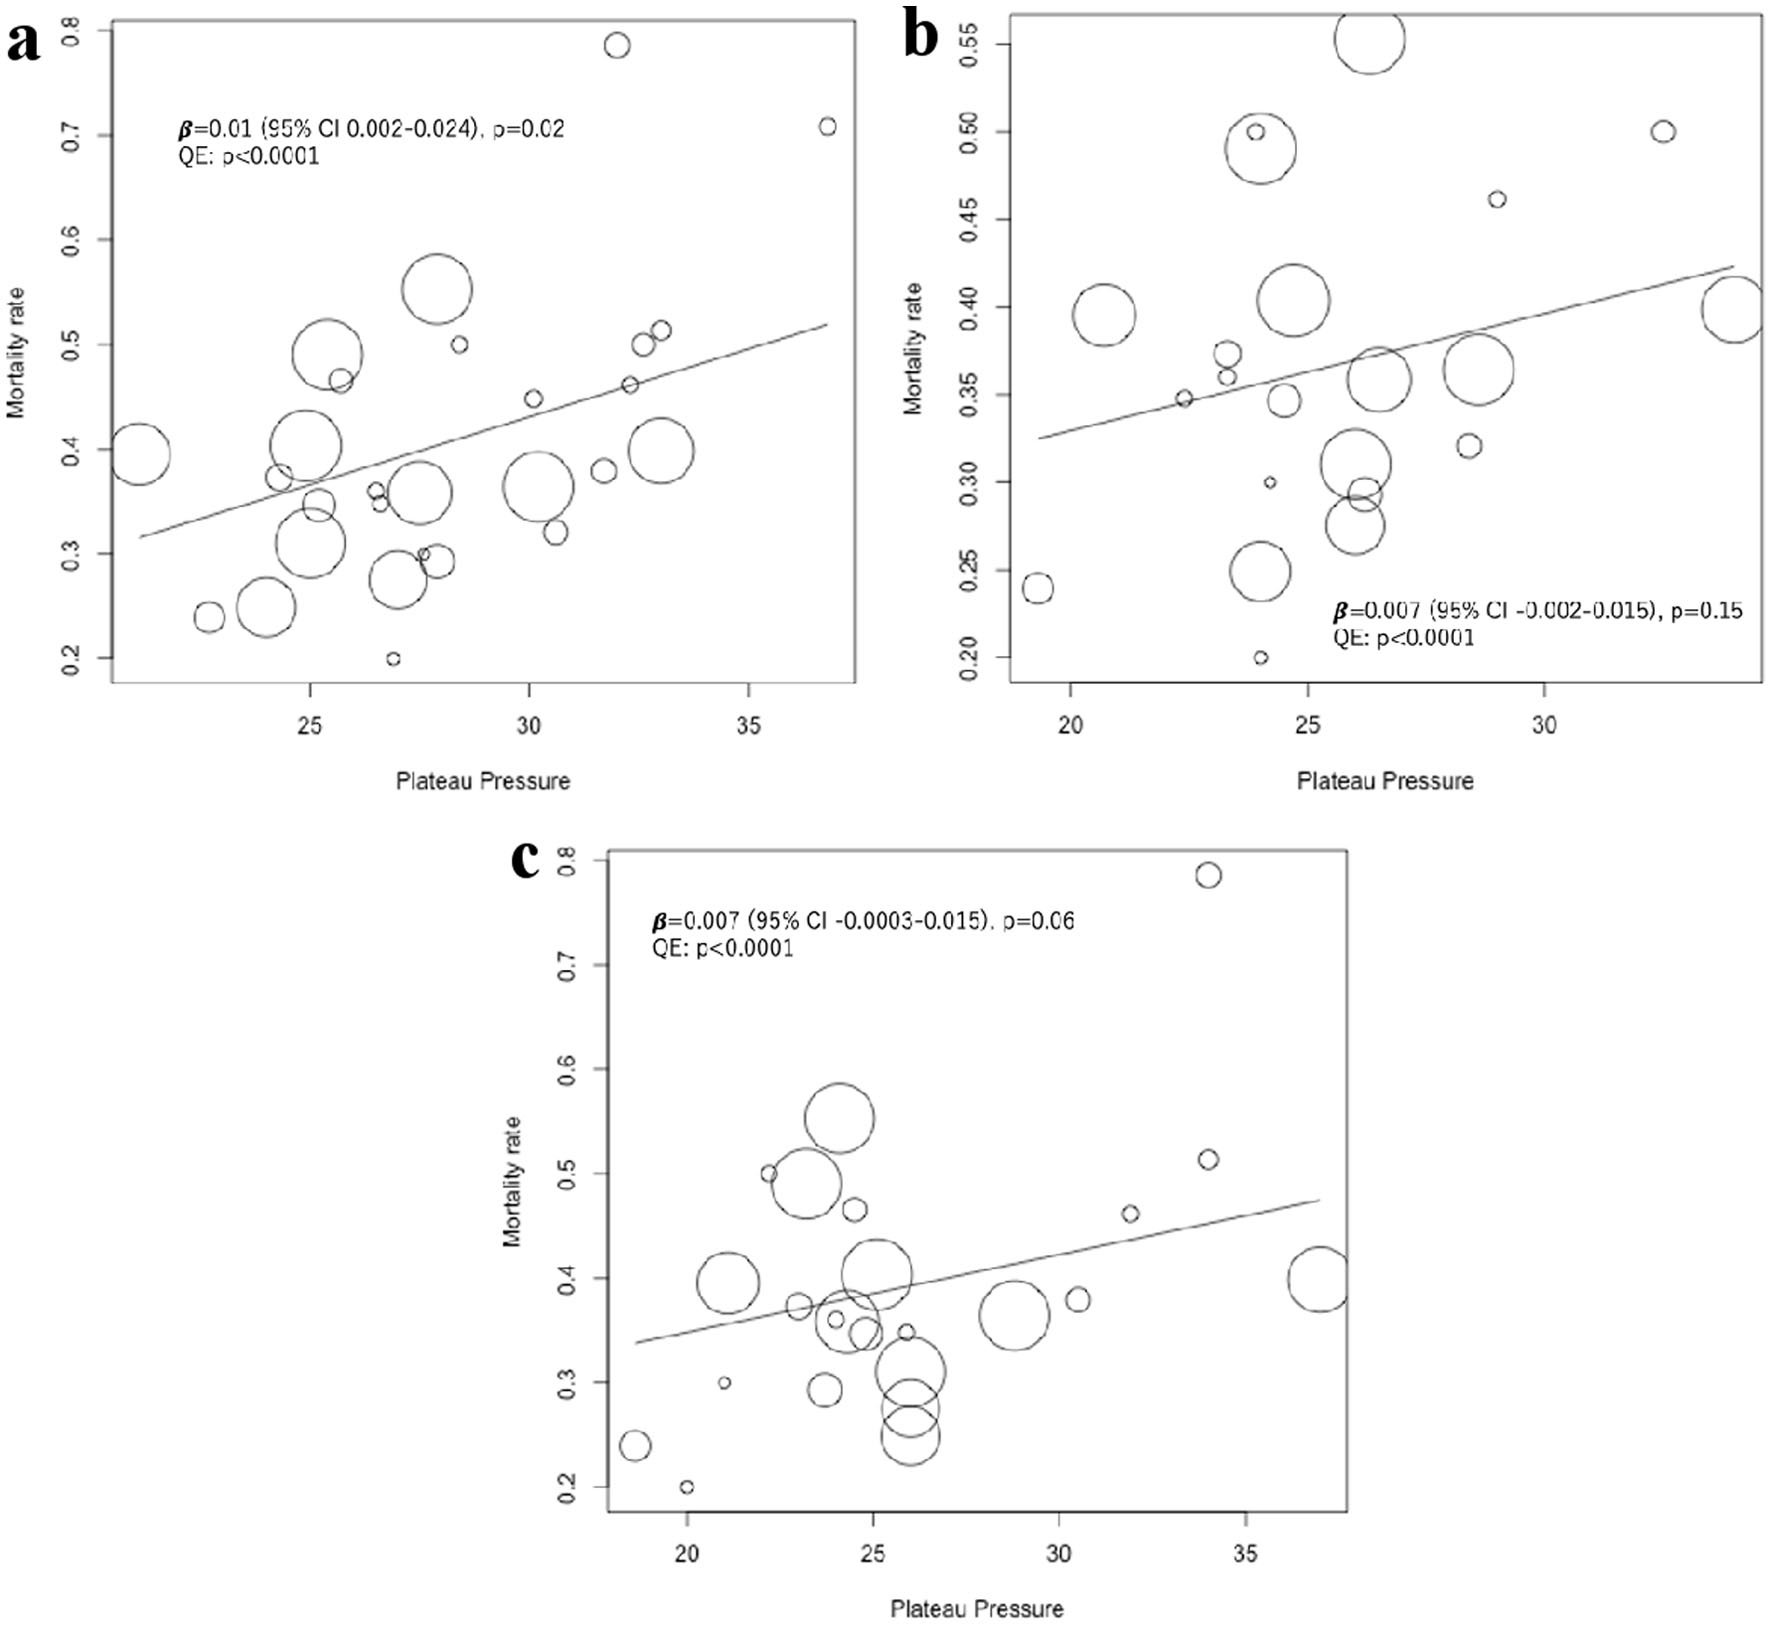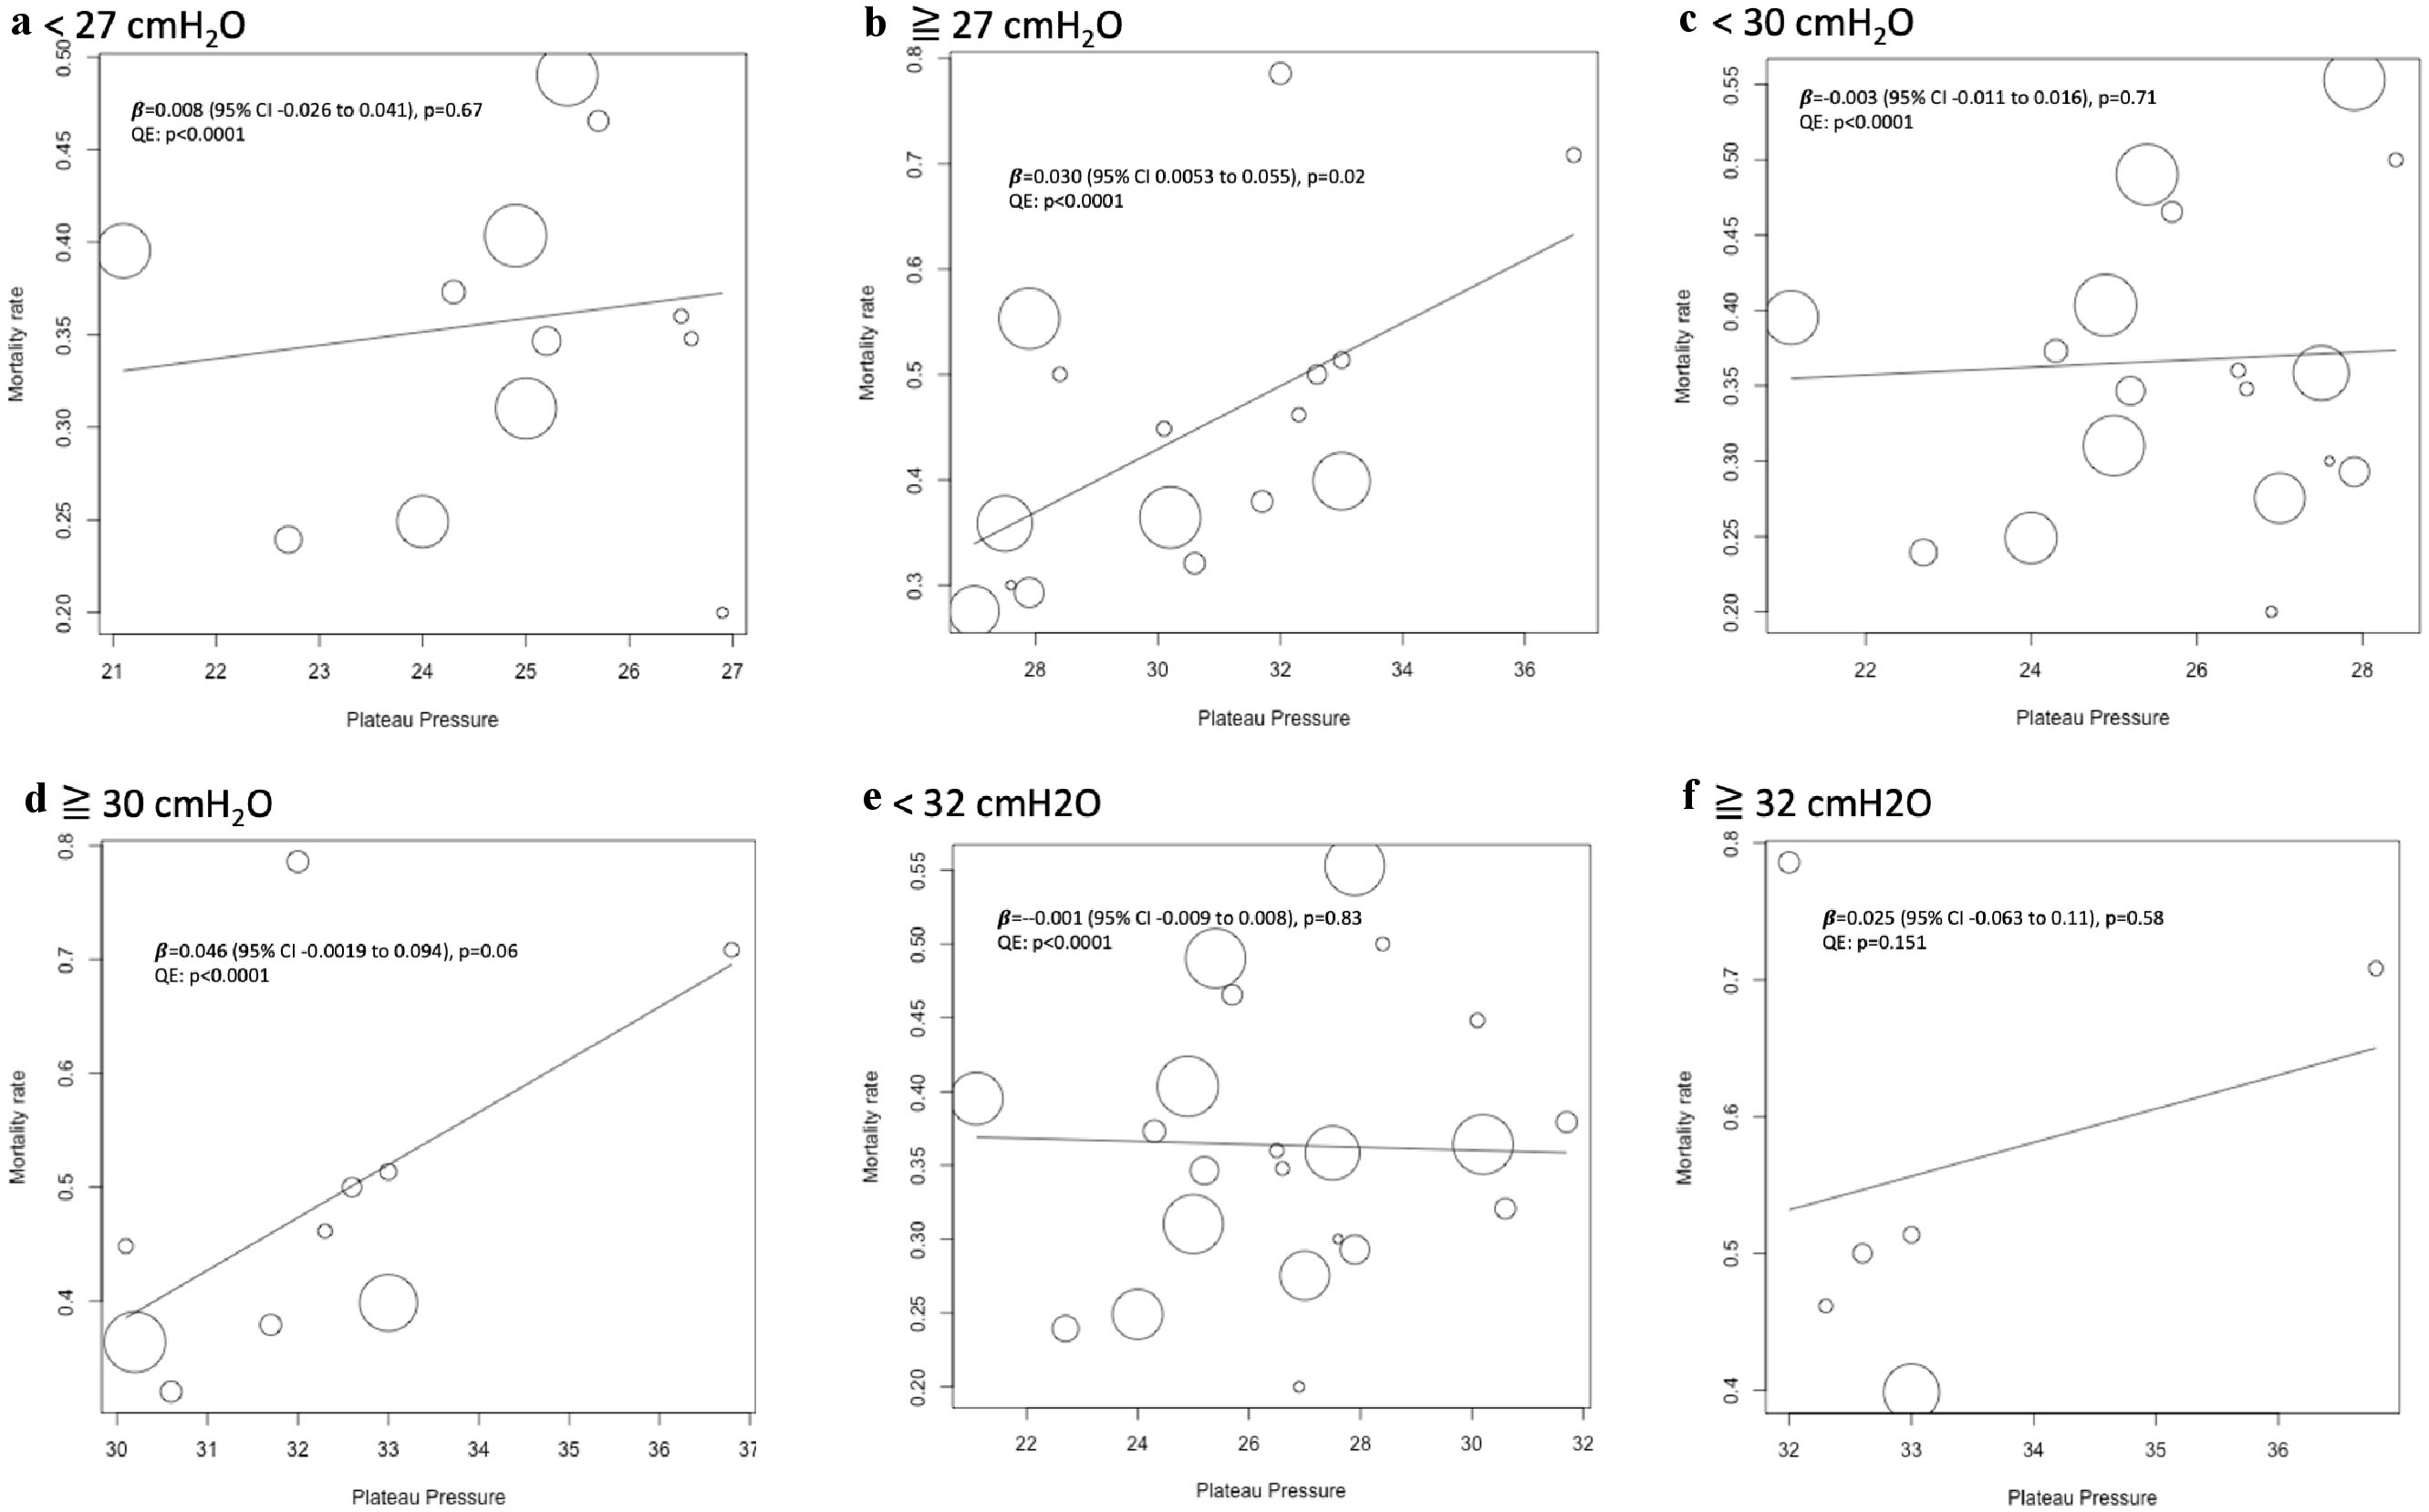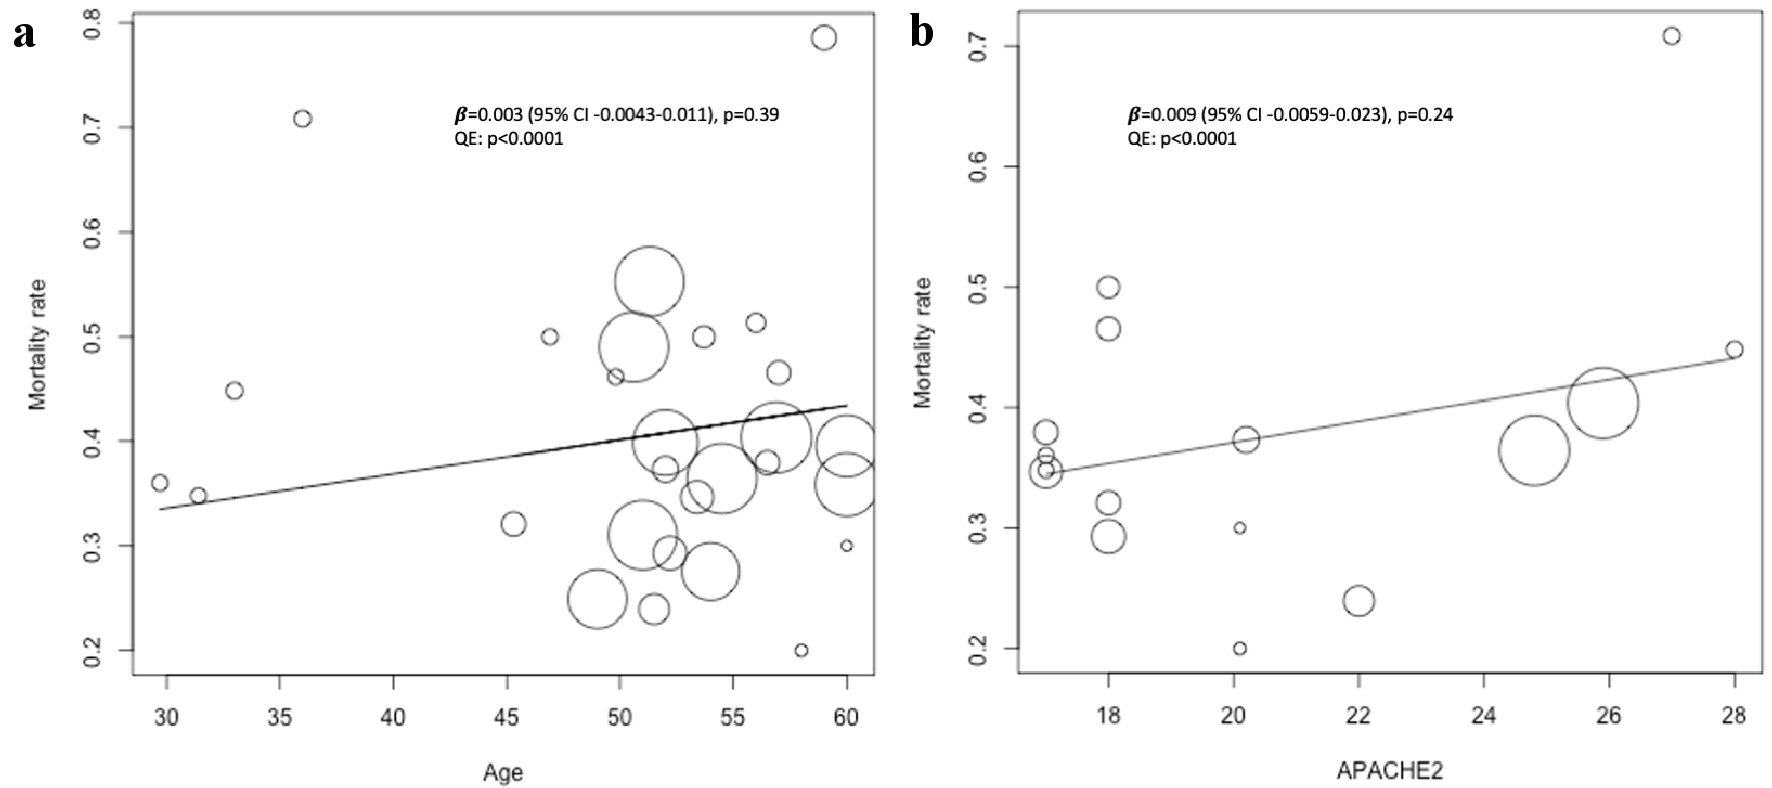
Figure 1. Flow diagram (search, inclusion, and exclusion).
| Journal of Clinical Medicine Research, ISSN 1918-3003 print, 1918-3011 online, Open Access |
| Article copyright, the authors; Journal compilation copyright, J Clin Med Res and Elmer Press Inc |
| Journal website https://www.jocmr.org |
Original Article
Volume 13, Number 1, January 2021, pages 48-63
Optimal Upper Limits of Plateau Pressure for Patients With Acute Respiratory Distress Syndrome During the First Seven Days: A Meta-Regression Analysis
Figures


Tables
| Author, year | Sample size (n) | Country | Inclusion criteria | Intervention | Control | ||||||
|---|---|---|---|---|---|---|---|---|---|---|---|
| Ventilator modes | Tidal volume | Airway pressure | PEEP | Ventilator modes | Tidal volume | Airway pressure | PEEP | ||||
| aPEEP > 20 cm H2O permitted if profoundly hypoxemic. bPflex: PEEP set on day 1 at the lower inflection point on the pressure-volume curve of the respiratory system. cARDSnet protocol. dRM: PCV driving pressure of 15 cm H2O with a PEEP of 25 cm H2O for 1 min, 35 cm H2O for 1 min and 45 cm H2O for 2 min. eRM: PCV, peak pressure between 50 and 60 cm H2O, and PEEP 35 - 45 cm H2O. fPflux = the maximum compliance PEEP. gRM 40s breath-hold at 40 cm H2O. AC: assist control; ASV: adaptive support ventilation; ARDS: acute respiratory distress syndrome; HFO: high frequency oscillation; HFOV: high frequency oscillation ventilation; IBW: ideal body weight; LIS: lung injury score; MV: minute volume; PEEP: positive end-expiratory pressure; PBW: predicted body weight; PCV: pressure control ventilation; Ppeak: peak airway pressure; Pplat: plateau pressure; Pflex: pressure at the lower inflection point; PSV: pressure support ventilation; PRVC: pressure-regulated volume control; RM: recruitment management; SIMV: synchronized intermittent-mandatory ventilation; SRM: staircase recruitment management ; VCV: volume-control ventilation. | |||||||||||
| Brower et al, 1999 [21] | 52 | USA | 1. PaO2/FiO2 ≤ 200 mm Hg | AC or SIMV/VCV | 5 - 8 mL/kg IBW | Pplat ≤ 30 cm H2O | Predetermined protocol | AC or SIMV/VCV | 10 - 12 mL/kg IBW | Pplat: ≤ 45 - 55 cm H2O | Predetermined protocol |
| 2. Bilateral infiltrates | Titrated to FiO2 - PEEP table | Titrated to FiO2 - PEEP table | |||||||||
| Range: 5 - 20 cm H2O | Range: 5 - 20 cm H2Oa | ||||||||||
| Villar et al, 2006 [22] | 103 | International | 1. PaO2/FiO2 ≤ 200 mm Hg | AC/VCV | 5 - 8 mL/kg PBW | Ppeak ≤ 35 - 40 cm H2O | Pflexb + 2 cm H2O (day1) or 13 cm H2O | AC/VCV | 9 - 11 mL/kg PBW | Ppeak: ≤ 35 - 40 cm H2O | PEEP ≥ 5 cm H2O |
| 2. Bilateral infiltrates | |||||||||||
| 3. Meet above criteria during 24 h on standard ventilator settings | |||||||||||
| Hodgson et al, 2011 [23] | 20 | Australia | 1. PaO2/FiO2 ≤ 200 mm Hg | PCV with SRM | < 6 mL/kg IBW | Pplat ≤ 30 cm H2O | 2.5 cm H2O above the derecruitment point | VCV | < 6 mL/kg IBW | Pplat ≤ 30 cm H2O | Predetermined protocolc |
| 2. Bilateral infiltrates | Titrated to FiO2 - PEEP table | ||||||||||
| 3. Age > 15 years old | Range: 5 - 24 cm H2O | ||||||||||
| Agarwal et al, 2013 [24] | 48 | India | 1. PaO2/FiO2 ≤ 200 mm Hg | ASV | %MV was set according to the initial minute ventilation attained with VCV | Pplat ≤ 35 cm H2O | Predetermined protocolc | VCV | < 6 mL/kg IBW | Pplat ≤ 30 - 35 cm H2O | Predetermined protocolc |
| 2. Bilateral infiltrates | Titrated to FiO2 - PEEP table | Titrated to FiO2 - PEEP table | |||||||||
| 3. Acute onset dyspnea (< 7 days) | Range: 5 - 24 cm H2O | Range: 5 - 24 cm H2O | |||||||||
| Amato et al, 1998 [25] | 53 | Brazil | 1. PaO2/FiO2 ≤ 200 mm Hg | Pressure-limited modes (PSV, PCV, PRVC) | < 6 mL/kg IBW | Driving pressure ≤ 20 cm H2O | 2 cm H2O above Pflex | AC/VCV | 12 mL/kg IBW | - | Predetermined protocol |
| 2. Bilateral infiltrates | Ppeak ≤ 40 cm H2O | Titrated to FiO2 - PEEP table | |||||||||
| 3. LIS ≥ 2.5 | Range: 5 - 24 cm H2O | ||||||||||
| 4. One or more underlying disease processes known to be associated with ARDS | |||||||||||
| Cavalcanti et al, 2017 [1] | 1,023 | International | 1. PaO2/FiO2 ≤ 200 mm Hg with PEEP of ≥ 10 cm H2O | VCV + RMd | 4 - 6 mL/kg IBW | Pplat ≤ 30 cm H2O | PEEP associated set with best compliance + 2 cm H2O | VCV | 4 - 6 mL/kg IBW | Pplat ≤ 30 cm H2O | Predetermined protocolc |
| 2. Bilateral infiltrates | Titrated to FiO2 - PEEP table | ||||||||||
| 3. Mechanical ventilation for < 72 h prior to inclusion | |||||||||||
| Brower et al, 2004 [26] | 549 | USA | 1. PaO2/FiO2 ≤ 300 mm Hg | AC/VCV | 6 mL/kg IBW | Pplat ≤ 30 cm H2O | Higher PEEP at least 12 cm H2O | AC/VCV | 6 mL/kg IBW | Pplat ≤ 30 cm H2O | Lower PEEP at least 5 cm H2O |
| 2. Bilateral infiltrates | |||||||||||
| Kacmarek et al, 2016 [4] | 200 | USA | 1. PaO2/FiO2 ≤ 300 mm Hg | PCV with RMe | 4 - 8 mL/kg IBW | Pplat ≤ 30 cm H2O | 3 cm H2O above Pflexf | VCV | 4 - 8 mL/kg IBW | Pplat ≤ 30 cm H2O | Predetermined protocolc |
| 2. Bilateral infiltrates | Titrated to FiO2 - PEEP table | ||||||||||
| 3. Age > 18 years old | Range: 5 - 24 cm H2O | ||||||||||
| 4. Within 48 h of meeting above criteria | |||||||||||
| Mercat et al, 2008 [27] | 767 | France | 1. PaO2/FiO2 ≤ 150 mm Hg for > 12 h with PEEP of ≥ 8 cm H2O | AC/VCV | 6 mL/kg IBW | Pplat ≤ 30 cm H2O | PEEP was kept as high as possible without increasing the maximal inspiratory Pplat above 28 to 30 cm H2O | AC/VCV | 6 mL/kg IBW | Pplat ≤ 30 cm H2O | Between 5 and 9 cm H2O |
| 2. Bilateral infiltrates | |||||||||||
| 3. Acute onset dyspnea (<48 h) | |||||||||||
| Esteban et al, 2000 [28] | 79 | Spain | 1. PaO2/FiO2 ≤ 200 mm Hg | PCV | - | Pplat ≤ 35 cm H2O | PEEP ≥ 5 cm H2O | VCV | - | Pplat ≤ 35 cm H2O | PEEP ≥ 5 cm H2O |
| 2. Bilateral infiltrates | |||||||||||
| 3. One or more underlying disease processes known to be associated with ARDS | |||||||||||
| Brochard et al, 1998 [29] | 106 | France | 1. LIS ≥ 2.5 for less than 72 h | AC/PCV | 6-10 mL/kg IBW | Ppeak ≤ 25 cm H2O | The lowest PEEP which can be above 200 mm Hg of PaO2/FiO2 during pure oxygen before randomization | AC/VCV | 10 - 15 mL/kg IBW | Pplat ≤ 60 cm H2O | The lowest PEEP which can be above 200 mm Hg of PaO2/FiO2 during pure oxygen before randomization |
| 2. Bilateral infiltrates | |||||||||||
| 3. Age above 17 and below 76 years old | |||||||||||
| Meade et al, 2008 [3] | 985 | Canada, Australia | 1. PaO2/FiO2 ≤ 250 mm Hg | AC/PCV with RMg | 4-8 mL/kg IBW | Pplat ≤ 40 cm H2O | Determined by a single pressure-volume curve analysis at enrollment (Range: 5 - 24 cm H2O) | AC/VCV | 4 - 8 mL/kg IBW | Pplat ≤ 30 cm H2O | Predetermined protocolc |
| Saudi Arabia | 2. Bilateral infiltrates | Titrated to FiO2 - PEEP table | |||||||||
| 3. New respiratory symptom (< 28 days) | Range: 5 - 24 cm H2O | ||||||||||
| ARDSnet, 2000 [8] | 861 | USA | 1. PaO2/FiO2 ≤ 300 mm Hg | AC/VCV | 6 mL/kg IBW (4 - 8 mL/kg IBW) | Pplat ≤ 30 cm H2O | Predetermined protocolc | AC/VCV | 12 mL/kg IBW | Pplat ≤ 50 cm H2O | Predetermined protocolc |
| 2. Bilateral infiltrates | Titrated to FiO2 - PEEP table | Titrated to FiO2 - PEEP table | |||||||||
| 3. Within 36 h of meeting above criteria | Range: 5 - 24 cm H2O | Range: 5 - 24 cm H2O | |||||||||
| Zhou et al, 2017 [2] | 138 | China | 1. PaO2/FiO2 ≤ 250 mm Hg | APRV | Not restricted | Phigh ≤ 30 cm H2O | Minimum PEEP level to atelectasis | VCV | 6 mL/kg IBW | Pplat ≤ 30 cm H2O | Adjusted by the PEEP - FiO2 table |
| 2. Bilateral infiltrates | |||||||||||
| 3. Mechanical ventilation for < 48 h prior to inclusion | |||||||||||
| Author, year | Intervention comparison | Population | Tidal volume, mL/kg/PBW | Plateau pressure, cm H2O | PEEP, cm H2O | ||||||||
|---|---|---|---|---|---|---|---|---|---|---|---|---|---|
| Age | Severity score | PaO2/FiO2 | Day1 | Day3 | Day7 | Day1 | Day3 | Day7 | Day1 | Day3 | Day7 | ||
| Data are presented as mean (SD) if there is no asterisk. aData are presented as median (IQR). bData are presented as mean (SE). cData are measured at 36 h after study enrollment. APACHE: acute physiology and chronic health evaluation; IQR: interquartile range; LIS: lung injury score; PBW: predicted body weight; PEEP: positive end-expiratory pressure; SAPS: simplified acute physiology score; SD: standard deviation; SE: standard error; SOFA: sequential organ failure assessment. | |||||||||||||
| Brower et al, 1999 [21] | Intervention | 46.9 (17.1) | LIS: 2.8 (0.5) | 129 (51) | 7.8 (0.4) | 7.3 (0.9) | 7.5 (1) | 28.4 (7.7) | 23.9 (5.3) | 22.2 (6.1) | 9.7 (3) | 7.9 (4.5) | 5.6 (4.2) |
| APACHE 3: 90.6 (26.4) | |||||||||||||
| Control | 49.8 (14.4) | LIS: 2.7 (0.5) | 150 (69) | 10.2 (0.7) | 10 (1) | 10 (0.7) | 32.3 (7.3) | 29 (8.2) | 31.9 (10.8) | 8.7 (3.5) | 7.8 (4.2) | 6 (4.2) | |
| APACHE 3: 84.6 (27.1) | |||||||||||||
| Villar et al, 2006 [22] | Intervention | 45.3 (26 - 62)a | LIS: 2.9 (0.4) | - | 7.3 (0.9) | 7.1 (0.9) | - | 30.6 (6) | 28.4 (5.4) | - | 14.1 (2.8) | 11.2 (3.1) | - |
| APACHE 2: 18 (7) | |||||||||||||
| Control | 53.7 (40 - 69)a | LIS: 2.8 (0.5) | - | 10.2 (1.2) | 10 (1) | - | 32.6 (6.2) | 32.5 (7.5) | - | 9 (2.7) | 8.7 (2.8) | - | |
| APACHE 2: 18 (6) | |||||||||||||
| Hodgson et al, 2011 [23] | Intervention | 60 (15.8) | APACHE 2: 20.1 (3)b | - | - | - | - | 27.6 (1.5)b | 24.2 (2.4)b | 21 (2.1)b | 15 (1)b | 12.1 (1.5)b | 8.5 (1.8)b |
| SOFA: 8.6 (0.9)b | |||||||||||||
| Control | 58 (12.6) | APACHE 2: 20.1 (3)b | - | - | - | - | 26.9 (1.4)b | 24 (2.1)b | 20 (3.4)b | 10 (0.5)b | 9.3 (1.4)b | 7.8 (2)b | |
| SOFA: 8.4 (0.5)b | |||||||||||||
| Agarwal et al, 2013 [24] | Intervention | 31.4 (14.9) | APACHE 2: 17 (8.9) | 107.3 (41.9) | - | - | - | 26.6 (8.7) | 22.4 (13.2) | 25.9 (11.9) | 12.6 (4.9) | 9.3 (4.9) | 10.1 (5.5) |
| SOFA: 7.4 (4) | |||||||||||||
| Control | 29.7 (11.6) | APACHE 2: 17 (9.7) | 96.6 (34.5) | - | - | - | 26.5 (4.1) | 23.3 (11.1) | 24.0 (8.6) | 12.1 (3.8) | 9.3 (4.4) | 8.1 (3.9) | |
| SOFA: 8.2 (4.4) | |||||||||||||
| Amato et al, 1998 [25] | Intervention | 33 (13) | LIS: 3.4 (0.4) | 112 (10) | 348 (6)c | - | - | 30.1 (0.7)c | - | - | 16.4 (0.4)c | - | - |
| APACHE 2: 28 (7) | |||||||||||||
| Control | 36 (14) | LIS: 3.2 (0.4) | 134 (14) | 768 (13)c | - | - | 36.8 (0.9)c | - | - | 8.7 (0.4)c | - | - | |
| APACHE 2: 27 (6) | |||||||||||||
| Cavalcanti et al, 2017 [1] | Intervention | 51.3 (17.4) | SAPS 3: 63.5 (18.1) | 119 (43.5) | 5.6 (1.1) | 5.8 (1.6) | 6.1 (1.3) | 27.9 (4.5) | 26.3 (5.7) | 24.1 (6.1) | 16.2 (3.9) | 14.2 (4.2) | 11.6 (4.0) |
| Control | 50.6 (17.4) | SAPS 3: 62.7 (18.1) | 117.2 (41.9) | 5.7 (0.6) | 5.8 (0.5) | 6.2 (1.4) | 25.4 (4.5) | 24.0 (5.8) | 23.2 (6.0) | 12.0 (3.4) | 10.5 (3.7) | 9.6 (3.2) | |
| Brower et al, 2004 [26] | Intervention | 54 (17) | APACHE 3: 96 33) | 151 (67) | 6 (0.9) | 5.8 (1) | 5.8 (1.2) | 27 (6) | 26 (7) | 26 (6) | 14.7 (3.5) | 12.9 (4.5) | 12.9 (4) |
| Control | 49 (17) | APACHE 3: 91 (30) | 165 (77) | 6.1 (0.8) | 6.1 (1.1) | 6.2 (1.3) | 24 (7) | 24 (6) | 26 (8) | 8.9 (3.5) | 8.5 (3.7) | 8.4 (4.3) | |
| Kacmarek et al, 2016 [4] | Intervention | 52.2 (15.1) | APACHE 2: 18 (10) | 133.4 (43.5) | 5.6 (1.1) | 5.8 (1.2) | 6.8 (1.5) | 27.9 (3.8) | 26.2 (3.9) | 23.7 (6) | 15.8 (3.8) | 14.3 (3.9) | 11.2 (4.4) |
| Control | 53.4 (14.5) | APACHE 2: 17 (6) | 128.3 (30.5) | 6.2 (0.7) | 6.4 (1.1) | 6.7 (1.6) | 25.2 (4.6) | 24.5 (5.1) | 24.8 (5.9) | 11.6 (2.5) | 10.7 (3.3) | 10.5 (3.9) | |
| Mercat et al, 2008 [27] | Intervention | 60 (16) | SAPS2: 50 (16) | 144 (58) | 6.1 (0.3) | 6.2 (0.5) | 6.8 (1.3) | 27.5 (2.4) | 26.5 (4.2) | 24.3 (5.8) | 14.6 (3.2) | 13.4 (4.7) | 8.9 (5.1) |
| Control | 60 (15) | SAPS2: 49 (16) | 143 (57) | 6.1 (0.4) | 6.2 (0.6) | 6.4 (0.9) | 21.1 (4.7) | 20.7 (5) | 21.1 (5.6) | 7.1 (1.8) | 6.7 (1.8) | 6.2 (2.1) | |
| Esteban et al, 2000 [28] | Intervention | 56 (17) | LIS: 2.8 (0.6) | 126 (47) | 8 (1.9) | 8.1 (2.4) | 33 (6) | 34 (8) | 11 (4) | 10 (4) | |||
| SAPS2: 39 (14) | |||||||||||||
| Control | 54 (16) | LIS: 2.9 (0.5) | 131 (48) | 8 (2.5) | 8.3 (2.6) | 32 (5) | 34 (7) | 12 (4) | 12 (5) | ||||
| SAPS2: 42 (17) | |||||||||||||
| Brochard et al, 1998 [29] | Intervention | 57 (15.3) | LIS: 3 (0.3) | 144 (61) | 7.1 (1.3) | 7.4 (1.3) | 25.7 (5) | 24.5 (5.7) | 10.7 (2.9) | 9.6 (3) | |||
| APACHE 2: 18 (7) | |||||||||||||
| SAPS2: 35 (12) | |||||||||||||
| Control | 56.5 (15.3) | LIS: 3 (0.3) | 155 (68) | 10.3 (1.7) | 10.7 (1.8) | 31.7 (6.6) | 30.5 (9.4) | 10.7 (2.3) | 8.5 (2.8) | ||||
| APACHE 2: 17 (8) | |||||||||||||
| SAPS2: 36 (13) | |||||||||||||
| Meade et al, 2008 [3] | Intervention | 54.5 (16.5) | APACHE 2: 24.8 (7.8) | 144.8 (47.9) | 6.8 (1.4) | 6.9 (1.5) | 6.9 (1.3) | 30.2 (6.3) | 28.6 (6) | 28.8 (6.3) | 15.6 (3.9) | 11.8 (4.1) | 10.3 (4.3) |
| Control | 56.9 (16.5) | APACHE 2: 25.9 (7.7) | 144.6 (49.2) | 6.8 (1.3) | 6.7 (1.5) | 7 (1.6) | 24.9 (5.1) | 24.7 (5.7) | 25.1 (6.8) | 10.1 (3) | 8.8 (3) | 8 (3.1) | |
| ARDSnet, 2000 [8] | Intervention | 51 (17) | APACHE 3: 81 (28) | 138 (64) | 6.2 (0.9) | 6.2 (1.1) | 6.5 (1.4) | 25 (7) | 26 (7) | 26 (7) | 9.4 (3.6) | 9.2 (3.6) | 8.1 (3.4) |
| Control | 52 (18) | APACHE 3: 84 (28) | 134 (58) | 11.8 (0.8) | 11.8 (0.8) | 11.4 (1.4) | 33 (9) | 34 (9) | 37 (9) | 8.6 (3.6) | 8.6 (4.2) | 9.1 (4.2) | |
| Zhou et al, 2017 [2] | Intervention | 51.5 (15) | APACHE 2: 22.0 (7.9) | 121.7 (46.8) | 7.3 (1.2) | 7.8 (1.9) | 7.4 (1.2) | 22.7 (4.3) | 19.3 (3.9) | 18.6 (4.5) | 7.0 (1.6) | 6.9 (1.8) | 6.5 (1.3) |
| Control | 52.0 (15.1) | APACHE 2: 20.2 (7.6) | 138.3 (56.1) | 7.2 (1.1) | 7.7 (1.1) | 7.5 (1.0) | 24.3 (4.3) | 23.3 (4.6) | 23.0 (4.6) | 12.0 (2.1) | 10.4 (2.8) | 10.3 (2.1) | |
| Total events (below cutoff) | Total (below cutoff) | Total events (over cutoff) | Total (over cutoff) | RR | 95% CI | P value | I2 | |
|---|---|---|---|---|---|---|---|---|
| CI: confidential interval; RR: risk ratio. | ||||||||
| Day 1 | ||||||||
| 27 cm H2O | 805 | 2,003 | 813 | 1,957 | 0.99 | 0.86 to 1.13 | 0.88 | 59% |
| 30 cm H2O | 379 | 1,024 | 378 | 988 | 1.00 | 0.78 to 1.28 | 0.99 | 69% |
| 32 cm H2O | 177 | 540 | 225 | 529 | 0.77 | 0.66 to 0.89 | 0.0007 | 0% |
| Day 3 | ||||||||
| 27 cm H2O | 352 | 966 | 356 | 930 | 0.96 | 0.72 to 1.27 | 0.75 | 76% |
| 30 cm H2O | 151 | 485 | 196 | 479 | 0.76 | 0.64 to 0.90 | 0.002 | 0% |
| 32 cm H2O | 151 | 485 | 196 | 479 | 0.76 | 0.64 to 0.90 | 0.002 | 0% |
| Day 7 | ||||||||
| 27 cm H2O | 379 | 1,024 | 378 | 988 | 1.00 | 0.78 to 1.28 | 0.99 | 69% |
| 30 cm H2O | 174 | 516 | 205 | 513 | 0.95 | 0.69 to 1.31 | 0.76 | 55% |
| 32 cm H2O | 147 | 458 | 183 | 455 | 0.82 | 0.65 to 1.04 | 0.10 | 16% |