Figures
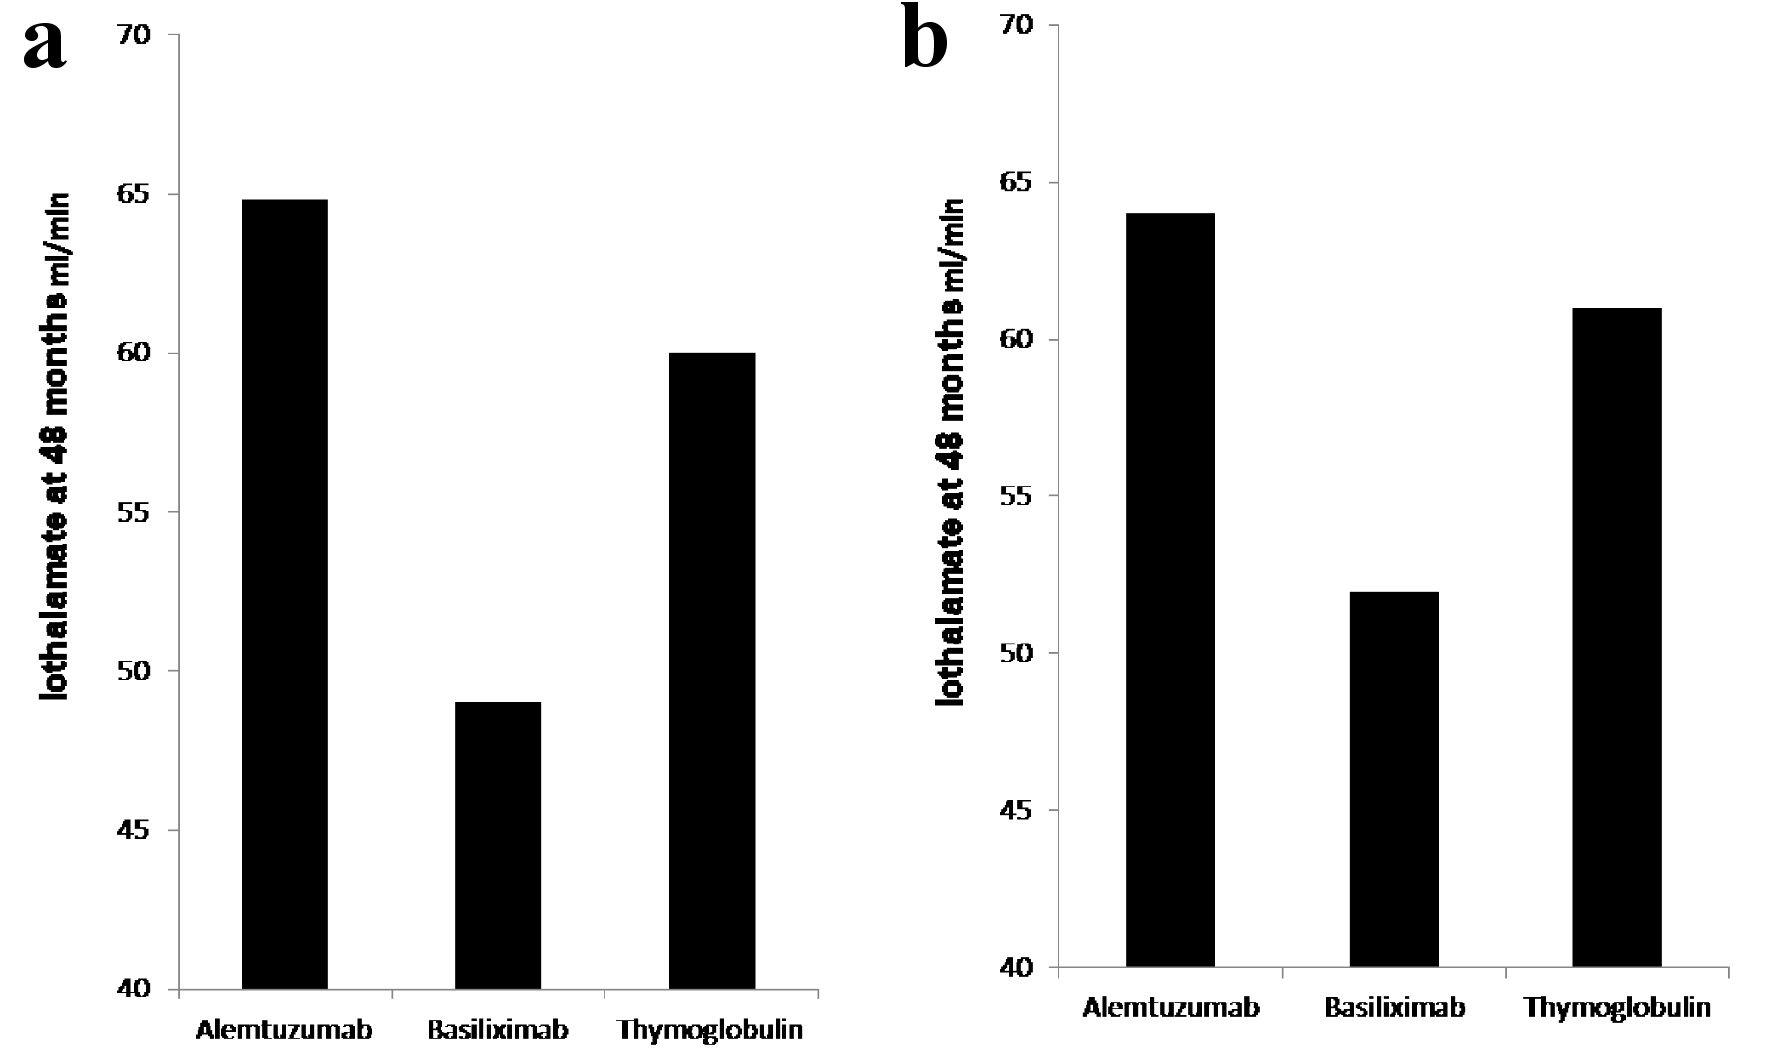
Figure 1. (a) Iothalamate clearance at 48 months. Recipients induced with basiliximab (149 patients) showed significant decline in iothalamate clearance at 49 when compared to alemtuzumab (264 patients) at 64.8 and thymoglobulin (236 patients) at 60 with P = 0.007. (b) Iothalamate clearance at 48 months, after excluding of recipients from donors with KDPI > 85%. Recipients induced with basiliximab (129 patients) showed significant decline in iothalamate clearance at 52 when compared to alemtuzumab (256 patients) at 64 and thymoglobulin (229 patients) at 61 with P = 0.02.
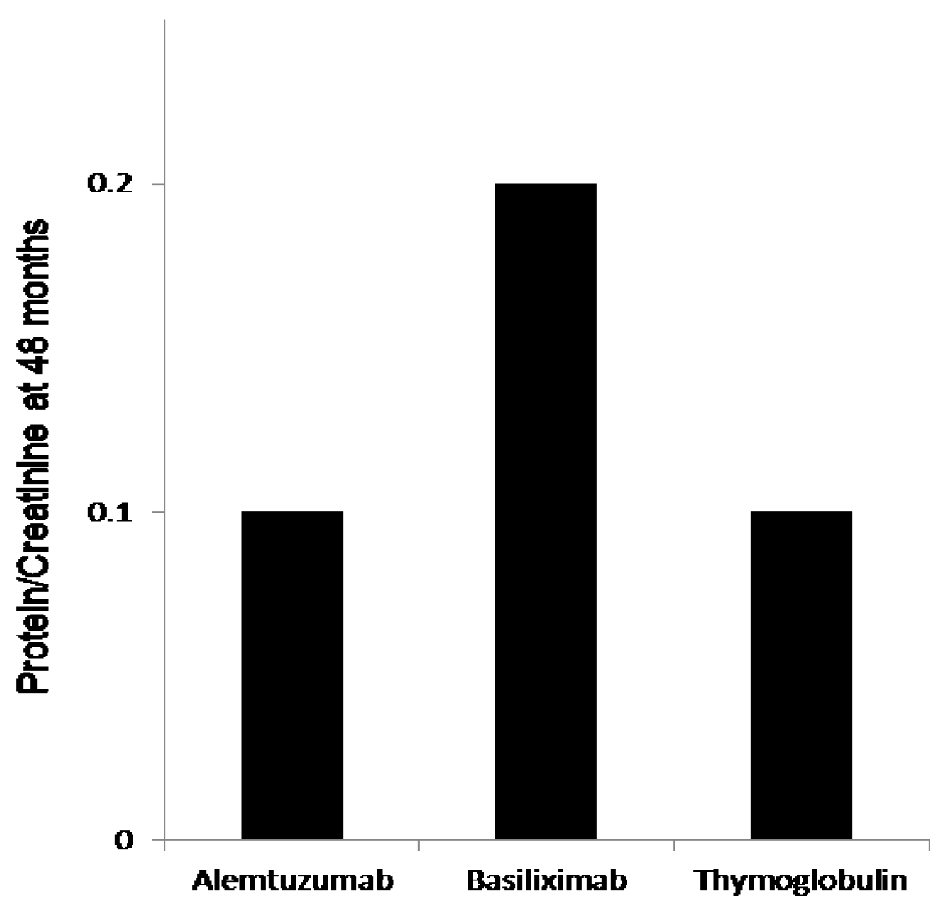
Figure 2. The 48 months protein creatinine ratio measurement showed significantly elevated mean protein/creatinine when measured at 48 months at 0.2 when compared to protein/creatinine of 0.1 with both alemtuzumab and thymoglobulin when used for induction, P < 0.03.
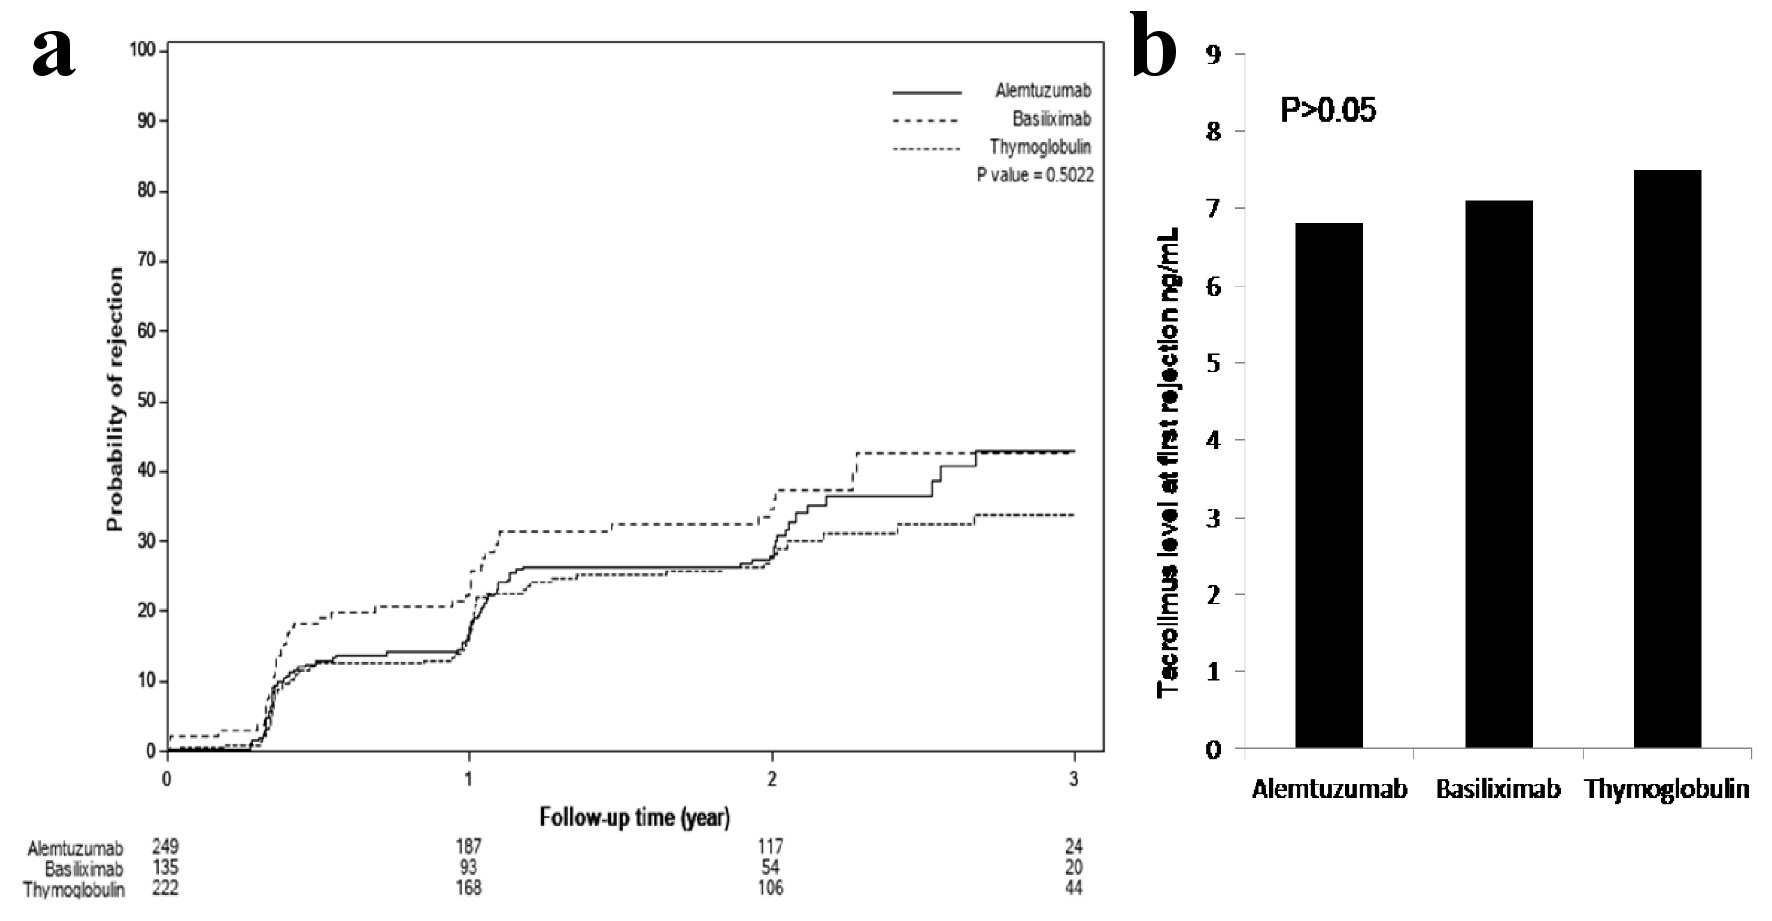
Figure 3. (a) Time to first rejection, based on protocoled or indicated biopsies, showed no significant differences among the three groups (P > 0.05). (b) Tacrolimus level checked within the 24 - 48 h prior to first diagnosed rejection showed acceptable therapeutic levels and no differences among the three groups: 7.7 ± 3.8 ng/mL with thymoglobulin, 6.8 ± 2.5 ng/mL with alemtuzumab and 7.3 ± 3.1 ng/mL with basiliximab group (P > 0.05).
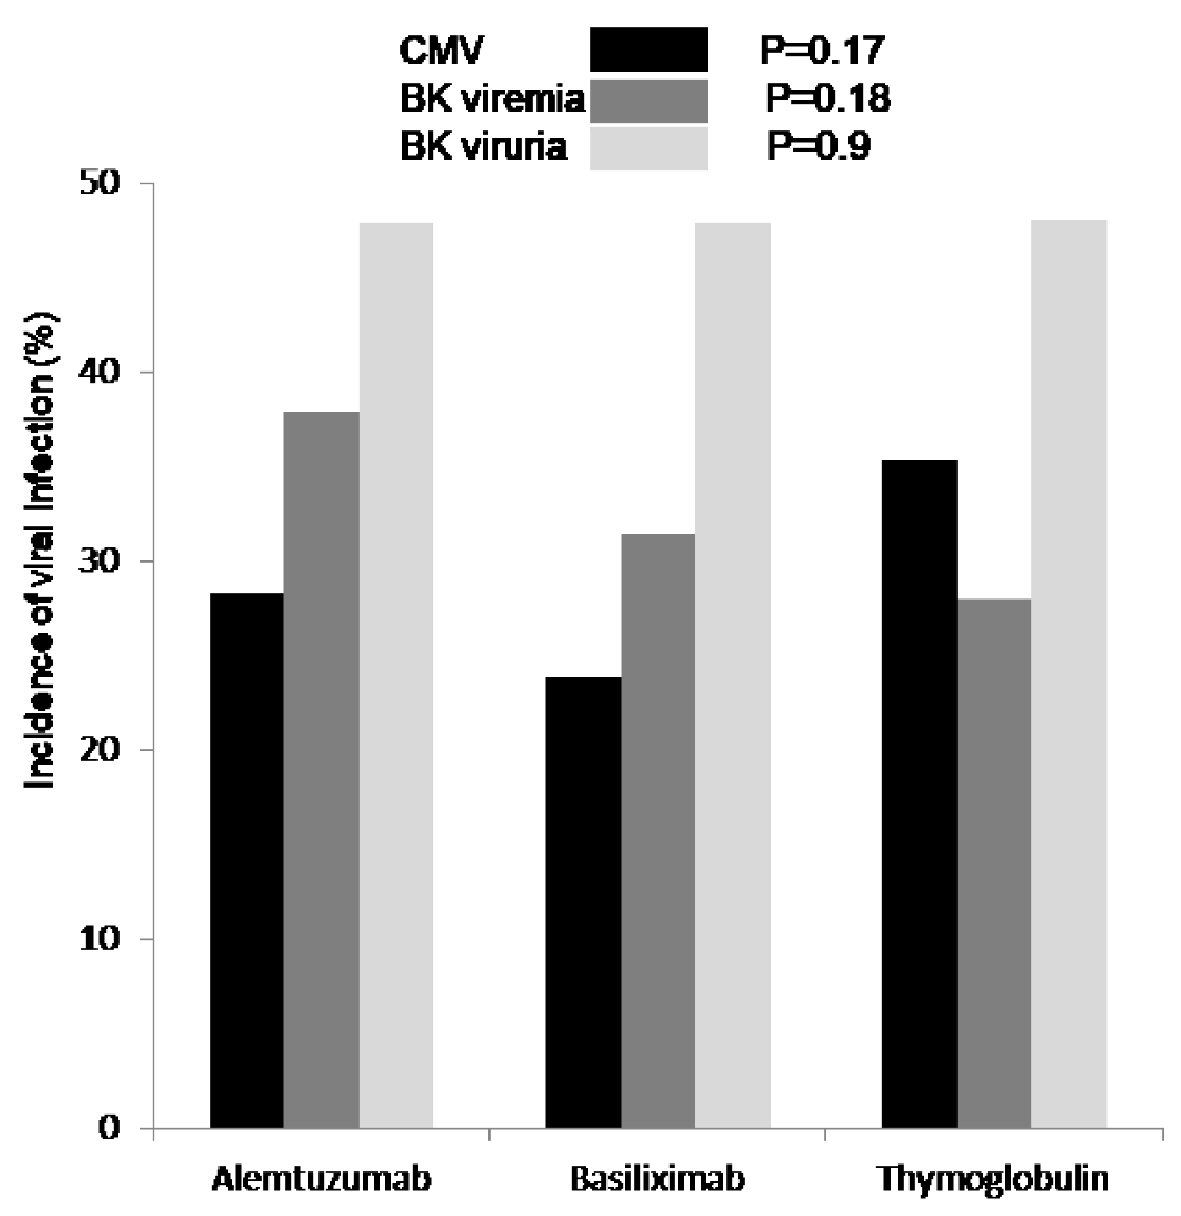
Figure 4. First diagnosed CMV viremia (black), based on screening test and/or symptoms, was reported as percentage of patients who tested positive and showed no difference among the three groups (P = 0.17). Incidence of BK viremia (grey) was higher in patients who received alemtuzumab for induction but not significant (P = 0.18). Incidence of BK viruria (white) was similar in all patients group (P = 0.9). CMV: cytomegalovirus; BK: polyomavirus.
Tables
Table 1. Patients Demographics
| Alemtuzumab | Basiliximab | Thymoglobulin | P value |
|---|
| Totally, 649 patients were enrolled. Age was significantly higher in group received basiliximab as expected based on immunosuppressive induction protocol (patients 65 years of age and older). Thymoglobulin induction group has equal female and male distribution when compared to alemtuzumab and basiliximab. |
| Age | | | | < 0.0001 |
| N | 264 | 149 | 236 | |
| Mean (SD) | 51.9 (12.2) | 72.6 (7.8) | 56.4 (12.9) | |
| Sex | | | | 0.0006 |
| Female | 91 (34.5%) | 54 (36.2%) | 119 (50.4%) | |
| Male | 173 (65.5%) | 95 (63.8%) | 117 (49.6%) | |
| Race | | | | 0.3546 |
| Missing | 79 | 57 | 47 | |
| White | 83 (44.9%) | 50 (54.3%) | 79 (41.8%) | |
| Black/African American | 89 (48.1%) | 37 (40.2%) | 99 (52.4%) | |
| Other | 13 (7.0%) | 5 (5.4%) | 11 (5.8%) | |
| Diabetes mellitus | | | | 0.1079 |
| No | 184 (69.7%) | 89 (59.7%) | 160 (67.8%) | |
| Yes | 80 (30.3%) | 60 (40.3%) | 76 (32.2%) | |
| Smoking status | | | | 0.9290 |
| No | 166 (62.9%) | 91 (61.1%) | 148 (62.7%) | |
| Yes | 98 (37.1%) | 58 (38.9%) | 88 (37.3%) | |
| BMI | | | | 0.22021 |
| Mean (SD) | 29.2 (5.6) | 28.6 (5.1) | 28.3 (5.8) | |
Table 2. Rejection Severity
| Alemtuzumab (n = 35) | Basiliximab (n = 27) | Thymoglobulin (n = 27) | P value |
|---|
| First diagnosed rejection classified according to Banff 2017 criteria showed no significant difference among the three induction agents. Patients who received basiliximab for induction had 7.4% increase incidence of IIB rejection when compared to 2.9% with alemtuzumab and 0% with thymoglobulin (P = 0.3). |
| Rejection severity | | | | 0.3813 |
| Borderline | 19 (55.9%) | 14 (51.9%) | 21 (77.8%) | |
| IA | 8 (23.5%) | 7 (25.9%) | 5 (18.5%) | |
| IB | 5 (14.7%) | 2 (7.4%) | 0 (0.0%) | |
| IIA | 1 (2.9%) | 1 (3.7%) | 1 (3.7%) | |
| IIB | 1 (2.9%) | 2 (7.4%) | 0 (0.0%) | |