Journal of Clinical Medicine Research, ISSN 1918-3003 print, 1918-3011 online, Open Access
Article copyright, the authors; Journal compilation copyright, J Clin Med Res and Elmer Press Inc
Journal website https://www.jocmr.org

Original Article

Volume 12, Number 11, November 2020, pages 734-739


Associations Between High Levels of High-Density Lipoprotein Cholesterol and the Presence and Severity of Coronary Artery Disease in Patients Who Have Undergone Coronary Computed Tomography Angiography

Figure

Figure 1.
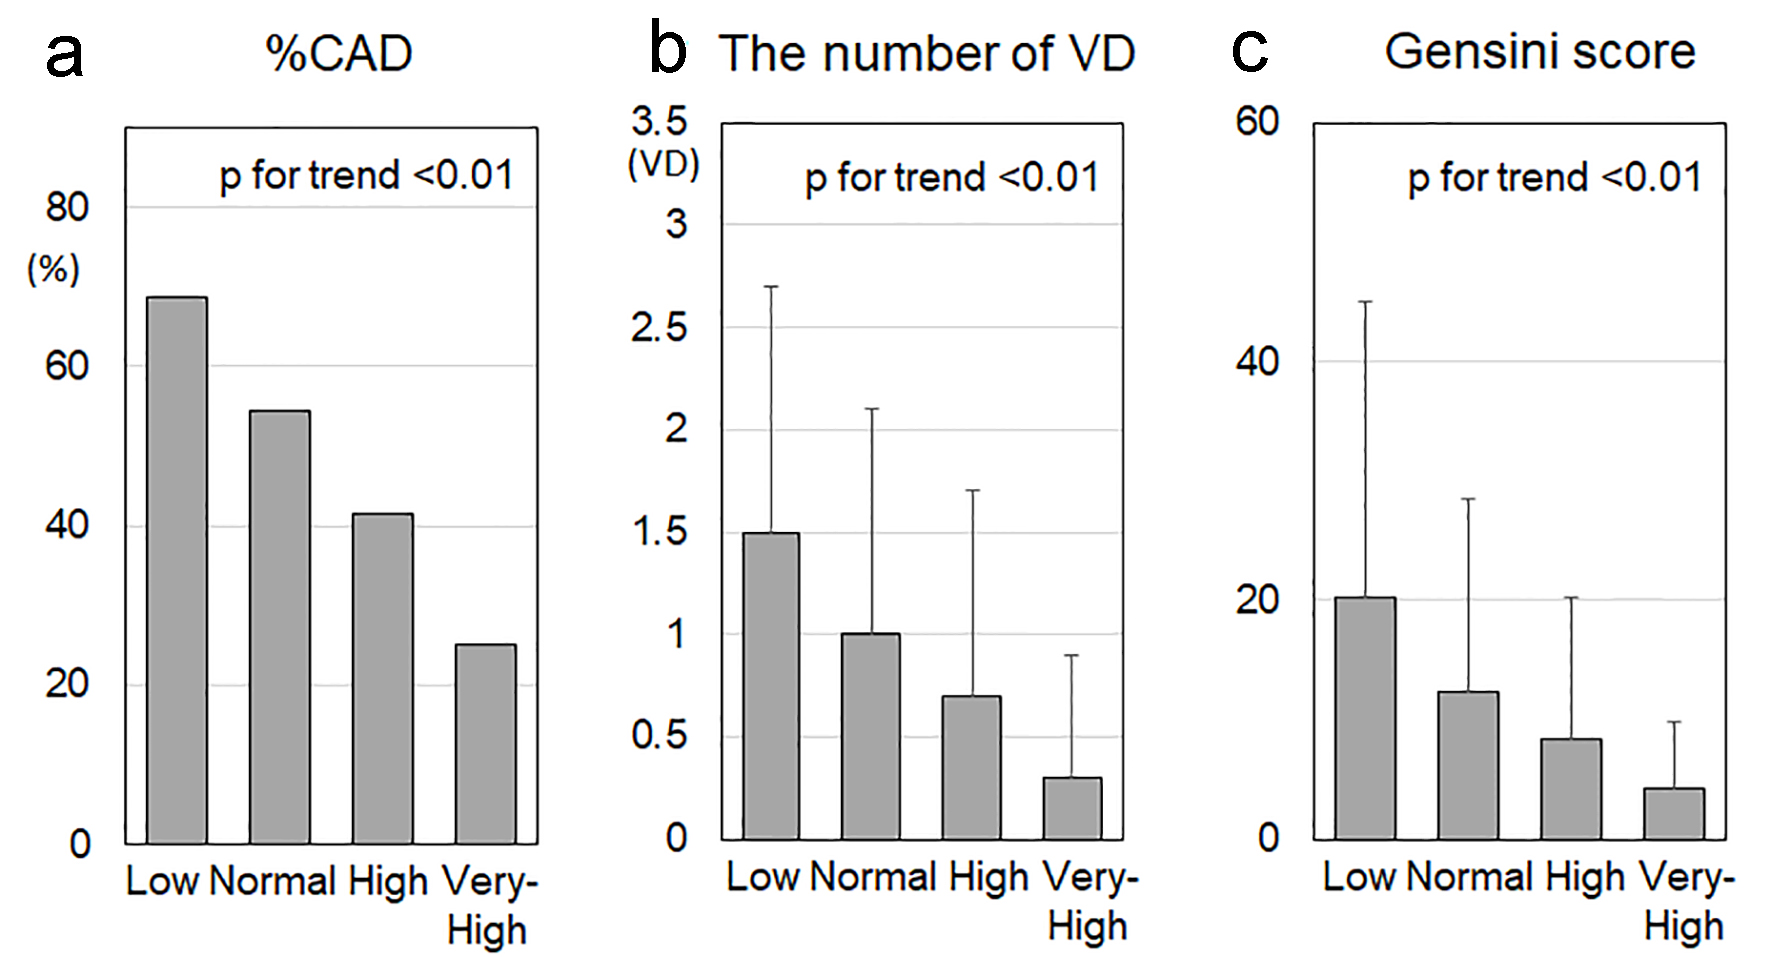
Figure 1. %CAD (a), number of VD (b) and Gensini score (c) in the low, normal, high and very-high HDL-C groups. CAD: coronary artery disease; VD: vessel disease; HDL-C: high-density lipoprotein cholesterol. P < 0.05, *P < 0.01, **P < 0.001, ***P < 0.0001.

Tables

Table 1. Patient Characteristics in All Patients and the Low, Normal, High and Very-High HDL-C Groups
 
All patients (n = 1,016)Low HDL-C (n = 115)Normal HDL-C (n = 530)High HDL-C (n = 335)Very-high HDL-C (n = 36)P for trend
Continuous variables are expressed as mean ± standard deviation. BMI: body mass index; DL: dyslipidemia; TG: triglyceride; HDL-C: high-density lipoprotein cholesterol; LDL-C: low-density lipoprotein cholesterol; DM: diabetes mellitus; HbA1c: hemoglobin A1c; FBS: fasting blood sugar; HTN: hypertension; SBP: systolic blood pressure; DBP: diastolic blood pressure; EPA: eicosapentaenoic acid; DPP-4I: dipeptidyl peptidase-4 inhibitor; ARB/ACEI: angiotensin II receptor blocker/angiotensin-converting-enzyme inhibitor; CCB: calcium channel blocker.
Age (years)66 ± 1264 ± 1165 ± 1266 ± 1164 ± 110.40
Male, n (%)494 (49)85 (74)289 (55)110 (33)10 (28)< 0.01
BMI, kg/m223.9 ± 3.825.0 ± 3.924.7 ± 3.822.6 ± 3.321.3 ± 2.9< 0.01
Smoking, n (%)342 (34)58 (50)193 (36)82 (25)9 (25)< 0.01
DL, n (%)547 (54)74 (64)298 (56)163 (30)12 (33)< 0.01
  TG, mg/dL136 ± 98188 ± 104149 ± 112103 ± 5475 ± 29< 0.01
  HDL-C, mg/dL56 ± 1635 ± 450 ± 570 ± 8101 ± 10< 0.01
  LDL-C, mg/dL115 ± 32113 ± 39116 ± 31117 ± 31109 ± 380.46
DM, n (%)206 (20)31 (27)122 (23)50 (15)3 (8.3)< 0.01
  HbA1c, %6.0 ± 0.96.1 ± 0.96.0 ± 0.95.9 ± 0.85.9 ± 1.00.18
  FBS, mg/dL108 ± 30109 ± 24110 ± 33106 ± 29104 ± 200.33
HTN, n (%)645 (64)80 (70)359 (68)186 (56)20 (56)< 0.01
  SBP, mm Hg136 ± 19135 ± 18136 ± 20135 ± 19137 ± 190.63
  DBP, mm Hg78 ± 1379 ± 1278 ± 1377 ± 1275 ± 140.47
Medications
  Statin, n (%)319 (31)34 (30)177 (33)99 (30)9 (25)0.50
  Fibrate, n (%)11 (1.1)2 (1.7)6 (1.1)3 (0.9)0 (0)0.81
  Ezetimib, n (%)18 (1.8)1 (0.9)10 (1.9)7 (2.1)0 (0)0.70
  EPA, n (%)33 (3.2)4 (3.5)19 (3.6)10 (3.0)0 (0)0.68
  Biguanide, n (%)64 (6.3)13 (11)35 (6.6)16 (4.8)0 (0)0.03
  DPP-4I, n (%)110 (11)12 (10)73 (14)23 (6.9)2 (5.6)0.01
  Insulin, n (%)29 (2.9)6 (5.2)13 (2.5)8 (2.4)2 (5.6)0.28
  ARB/ACEI, n (%)369 (36)49 (43)207 (39)103 (31)10 (28)0.02
  CCB, n (%)384 (38)45 (39)206 (39)119 (36)14 (39)0.78
  β-blocker, n (%)91 (9.0)12 (10)53 (10)24 (7.2)2 (5.6)0.41
  Diuretics, n (%)88 (8.7)7 (6.1)57 (11)22 (6.6)2 (5.6)0.10


Table 2. Independent Predictors of CAD
 
OR95% CIP value
OR: odds ratio; CI: confidence interval; BMI: body mass index; SBP: systolic blood pressure; DBP: diastolic blood pressure; TG: triglyceride; HDL-C: high-density lipoprotein cholesterol; LDL-C: low-density lipoprotein cholesterol; HbA1c: hemoglobin A1c.
Age1.051.04 - 1.07< 0.0001
Male2.061.52 - 2.81< 0.0001
BMI0.990.95 - 1.030.73
SBP1.021.01 - 1.03< 0.01
DBP1.000.99 - 1.010.87
TG1.001.00 - 1.000.60
HDL-C0.980.97 - 0.99< 0.0001
LDL-C1.000.99 - 1.000.58
HbA1c1.321.12 - 1.57< 0.01