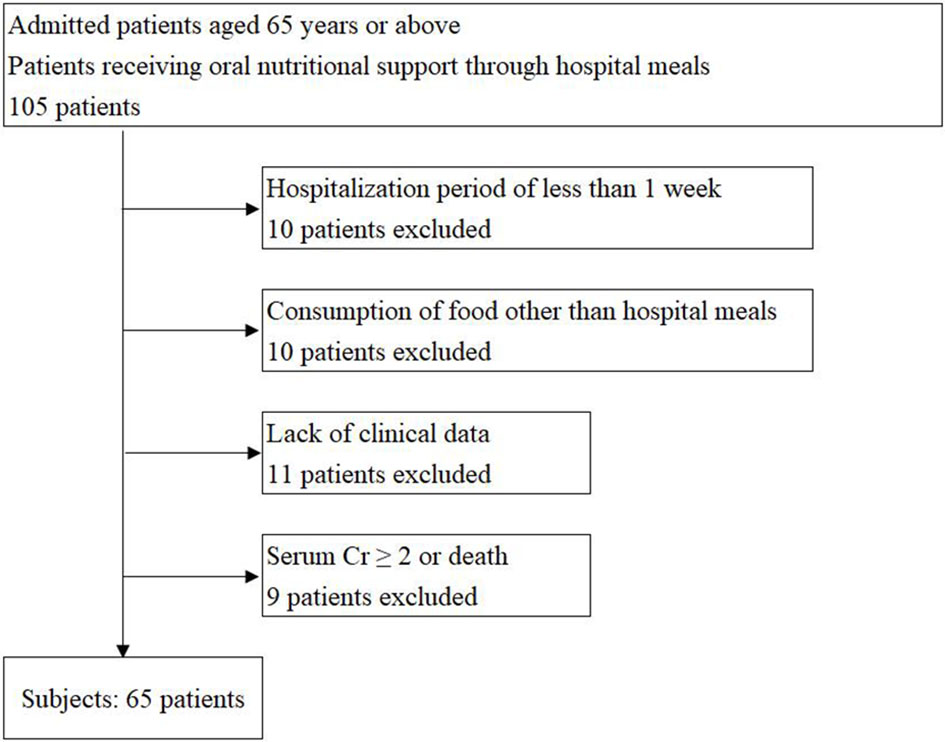
Figure 1. Flow diagram of the selection criteria for patients. Cr: creatinine.
| Journal of Clinical Medicine Research, ISSN 1918-3003 print, 1918-3011 online, Open Access |
| Article copyright, the authors; Journal compilation copyright, J Clin Med Res and Elmer Press Inc |
| Journal website https://www.jocmr.org |
Original Article
Volume 12, Number 11, November 2020, pages 705-710
Influence of Geriatric Patients’ Food Preferences on the Selection of Discharge Destination
Figures
Tables
| Data are expressed as mean ± standard deviation. The main diseases for admission included chronic heart failure, bronchial pneumonia, chronic obstructive pulmonary disease, and type 2 diabetes; however, these conditions had been treated in the acute care hospital, and thus, patients’ condition became stable. Alb: serum albumin; FPG: fasting plasma glucose; BUN: blood urea nitrogen; Cr: creatinine; eGFR: estimated glomerular filtration rate. | |
| Number of patients (male/female) | 65 (31/34) |
| Age (years) | 80.0 ± 8.2 |
| Body mass index (kg/m2) | 20.8 ± 3.9 |
| Charlson comorbidity index (score) | 2.4 ± 1.4 |
| Duration of hospitalization (days) | 62.2 ± 39.3 |
| Alb ((g/dL) | 3.4 ± 0.5 |
| FPG (mg/dL) | 102.3 ± 28.9 |
| BUN (mg/dL) | 17.9 ± 7.3 |
| Cr (mg/dL) | 0.9 ± 0.3 |
| eGFR (mL/min/1.73 m2) | 66.9 ± 21.7 |
| Not approved for nursing care service (number of patients) | 6 |
| Approved for nursing care service (number of patients) | 59 |
| Assistance required 1 (number of patients) | 0 |
| Assistance required 2 (number of patients) | 6 |
| Nursing care required 1 (number of patients) | 7 |
| Nursing care required 2 (number of patients) | 13 |
| Nursing care required 3 (number of patients) | 10 |
| Nursing care required 4 (number of patients) | 16 |
| Nursing care required 5 (number of patients) | 7 |
| Before eatinga | After eatingb | P value | |
|---|---|---|---|
| aCalorie intake calculated from the menu served to patients. bCalorie intake calculated from actual food consumption. cP < 0.001, paired t-test. Data are expressed as mean ± standard deviation. NPC/N: nonprotein calorie/nitrogen. | |||
| Number of patients | 65 | 65 | |
| Energy (kcal/day) | 1,747 ± 119 | 1,341 ± 283 | 0.000c |
| Energy (kcal/kg/day) | 36.2 ± 8.1 | 26.9 ± 5.7 | 0.000c |
| Protein (g/day) | 62.5 ± 10.6 | 53.0 ± 10.4 | 0.000c |
| Protein (g/kg/day) | 1.3 ± 0.4 | 1.1 ± 0.2 | 0.000c |
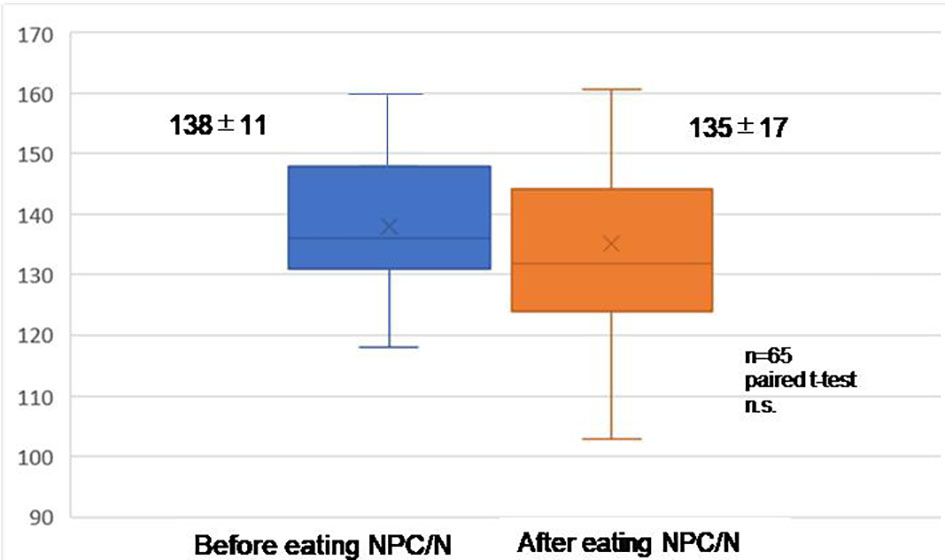
| NPC/N | 138 ± 11.0 | 135.1 ± 16.6 | 0.246 |
| NPC/N (maximum value - minimum value) | (148 - 118) | (218 - 103) | |
| Partial regression coefficient | OR | 95% confidence interval | P value | ||
|---|---|---|---|---|---|
| Upper limit | Lower limit | ||||
| aNPC/N of food consumed, n = 65, logistic regression analysis. bP < 0.05. cP < 0.01. OR: odds ratio; Alb: serum albumin; eGFR: estimated glomerular filtration rate; NPC/N: nonprotein calorie/nitrogen. | |||||
| Age | -0.017 | 0.983 | 0.851 | 1.14 | 0.815 |
| Sex | -5.090 | 0.006 | 0.000 | 0.272 | 0.008c |
| Nursing care level | 0.255 | 1.290 | 0.626 | 2.680 | 0.485 |
| Hospitalization duration | 0.068 | 1.070 | 1.020 | 1.130 | 0.009c |
| Alb | 3.186 | 24.200 | 1.600 | 365.000 | 0.022b |
| eGFR | -0.073 | 0.930 | 0.875 | 0.988 | 0.019b |
| NPC/Na | -0.222 | 0.801 | 0.698 | 0.920 | 0.002c |
| Partial regression coefficient | OR | 95% confidence interval | P value | ||
|---|---|---|---|---|---|
| Upper limit | Lower limit | ||||
| aNPC/N calculated from hospital meal menu, n = 65, logistic regression analysis. OR: odds ratio; Alb: serum albumin; eGFR: estimated glomerular filtration rate; NPC/N: nonprotein calorie/nitrogen. | |||||
| Age | -0.082 | 0.921 | 0.809 | 1.050 | 0.211 |
| Sex | -1.599 | 0.202 | 0.030 | 1.360 | 0.100 |
| Nursing care level | 0.140 | 1.150 | 0.627 | 2.100 | 0.654 |
| Hospitalization duration | 0.020 | 1.020 | 0.986 | 1.060 | 0.243 |
| Alb | 0.247 | 1.280 | 0.155 | 10.600 | 0.818 |
| eGFR | 0.020 | 1.020 | 0.963 | 1.080 | 0.494 |
| NPC/N¶ | 1.541 | 4.670 | 0.000 | 0.000 | 0.995 |