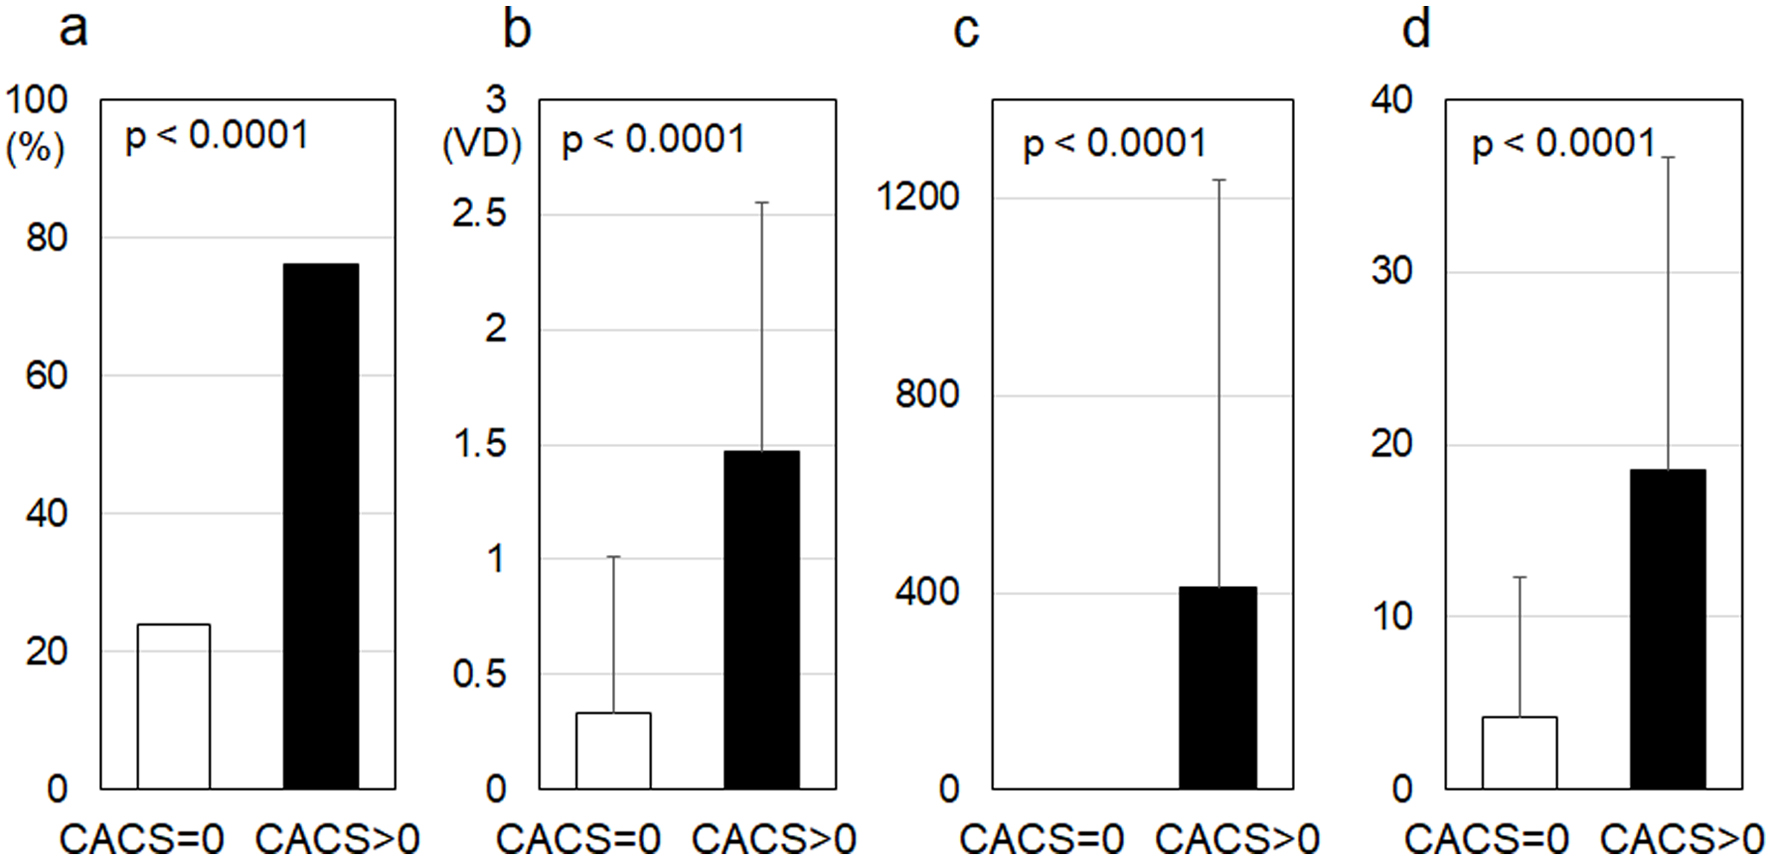
Figure 1. %CAD (a), number of VD (b), CACS (c) and Gensini score (d) in the CACS = 0 and CACS > 0 groups. CAD: coronary artery disease; number of VD: number of significantly stenosed coronary vessels; CACS: coronary artery calcium score.
| Journal of Clinical Medicine Research, ISSN 1918-3003 print, 1918-3011 online, Open Access |
| Article copyright, the authors; Journal compilation copyright, J Clin Med Res and Elmer Press Inc |
| Journal website https://www.jocmr.org |
Original Article
Volume 12, Number 10, October 2020, pages 662-667
A Coronary Artery Calcium Score of Zero in Patients Who Have Undergone Coronary Computed Tomography Angiography Is Associated With Freedom From Major Adverse Cardiovascular Events
Figures
Tables
| CACS = 0 group (n = 202) | CACS > 0 group (n = 300) | P value (CACS = 0 vs. CACS > 0 | |
|---|---|---|---|
| Continuous variables are expressed as mean ± SD. BMI: body mass index; VFA, visceral fat area; HTN: hypertension; SBP: systolic blood pressure; DBP: diastolic blood pressure; DM: diabetes mellitus; HbA1c: hemoglobin A1c; FBG: fasting blood glucose; DL: dyslipidemia; TG: triglyceride; HDL-C: high-density lipoprotein cholesterol; LDL-C: low-density lipoprotein cholesterol; ARB/ACEI: angiotensin II receptor blocker/angiotensin-converting enzyme inhibitor; CCB: calcium channel blocker; DPP-4I: dipeptidyl peptidase-4 inhibitor | |||
| Age, years | 62 ± 12 | 69 ± 9 | < 0.0001 |
| Gender (male), n (%) | 79 (39) | 171 (57) | < 0.0001 |
| Family history, n (%) | 49 (25) | 74 (25) | 0.917 |
| Smoking, n (%) | 53 (26) | 124 (41) | 0.001 |
| BMI, kg/m2 | 23.7 ± 3.5 | 24.2 ± 3.6 | 0.104 |
| VFA, mm2 | 116 ± 55 | 115 ± 57 | 0.819 |
| HTN, n (%) | 113 (56) | 236 (79) | < 0.0001 |
| SBP, mm Hg | 131 ± 16 | 139 ± 20 | < 0.0001 |
| DBP, mm Hg | 77 ± 12 | 77 ± 12 | 0.522 |
| DM, n (%) | 32 (16) | 83 (28) | 0.002 |
| HbAlc, % | 5.8 ± 1.1 | 6.0 ± 1.2 | 0.059 |
| FBG, mg/dL | 106 ± 34 | 111 ± 34 | 0.073 |
| DL, n (%) | 112 (55) | 207 (69) | 0.002 |
| TG, mg/dL | 135 ± 84 | 132 ± 88 | 0.689 |
| HDL-C, mg/dL | 57 ± 16 | 53 ± 14 | 0.012 |
| LDL-C, mg/dL | 113 ± 32 | 112 ± 30 | 0.585 |
| Medications | |||
| ARB/ACEI, n (%) | 57 (28) | 142 (47) | < 0.0001 |
| CCB, n (%) | 63 (31) | 131 (44) | 0.005 |
| β-blocker, n (%) | 14 (6.9) | 35 (12) | 0.080 |
| Diuretic, n (%) | 14 (6.9) | 42 (14) | 0.136 |
| Statin, n (%) | 48 (24) | 133 (44) | < 0.0001 |
| Sulfonylurea, n (%) | 9 (4.5) | 39 (13) | 0.001 |
| Biguanide, n (%) | 12 (5.9) | 25 (8.3) | 0.314 |
| DPP-4I, n (%) | 14 (6.9) | 43 (14) | 0.010 |
| Insulin, n (%) | 7 (3.5) | 11 (3.7) | 0.905 |
| Factors | OR (95% CI) | P value |
|---|---|---|
| MACE: major adverse cardiovascular events; OR: odds ratio; CI: confidence interval; VFA: visceral fat area; HTN: hypertension; DM: diabetes mellitus; DL: dyslipidemia; CACS: coronary artery calcium score. | ||
| Age | 1.013 (0.977 - 1.049) | 0.488 |
| Gender (male) | 2.091 (0.923 - 4.734) | 0.077 |
| VFA | 1.001 (0.995 - 1.007) | 0.821 |
| Smoking | 1.472 (0.710 - 3.053) | 0.299 |
| Family history | 0.682 (0.287 - 1.623) | 0.387 |
| HTN | 1.363 (0.609 - 3.052) | 0.451 |
| DM | 0.973 (0.462 - 2.048) | 0.941 |
| DL | 0.618 (0.309 - 1.236) | 0.173 |
| CACS = 0 | 0.405 (0.170 - 0.965) | 0.041 |