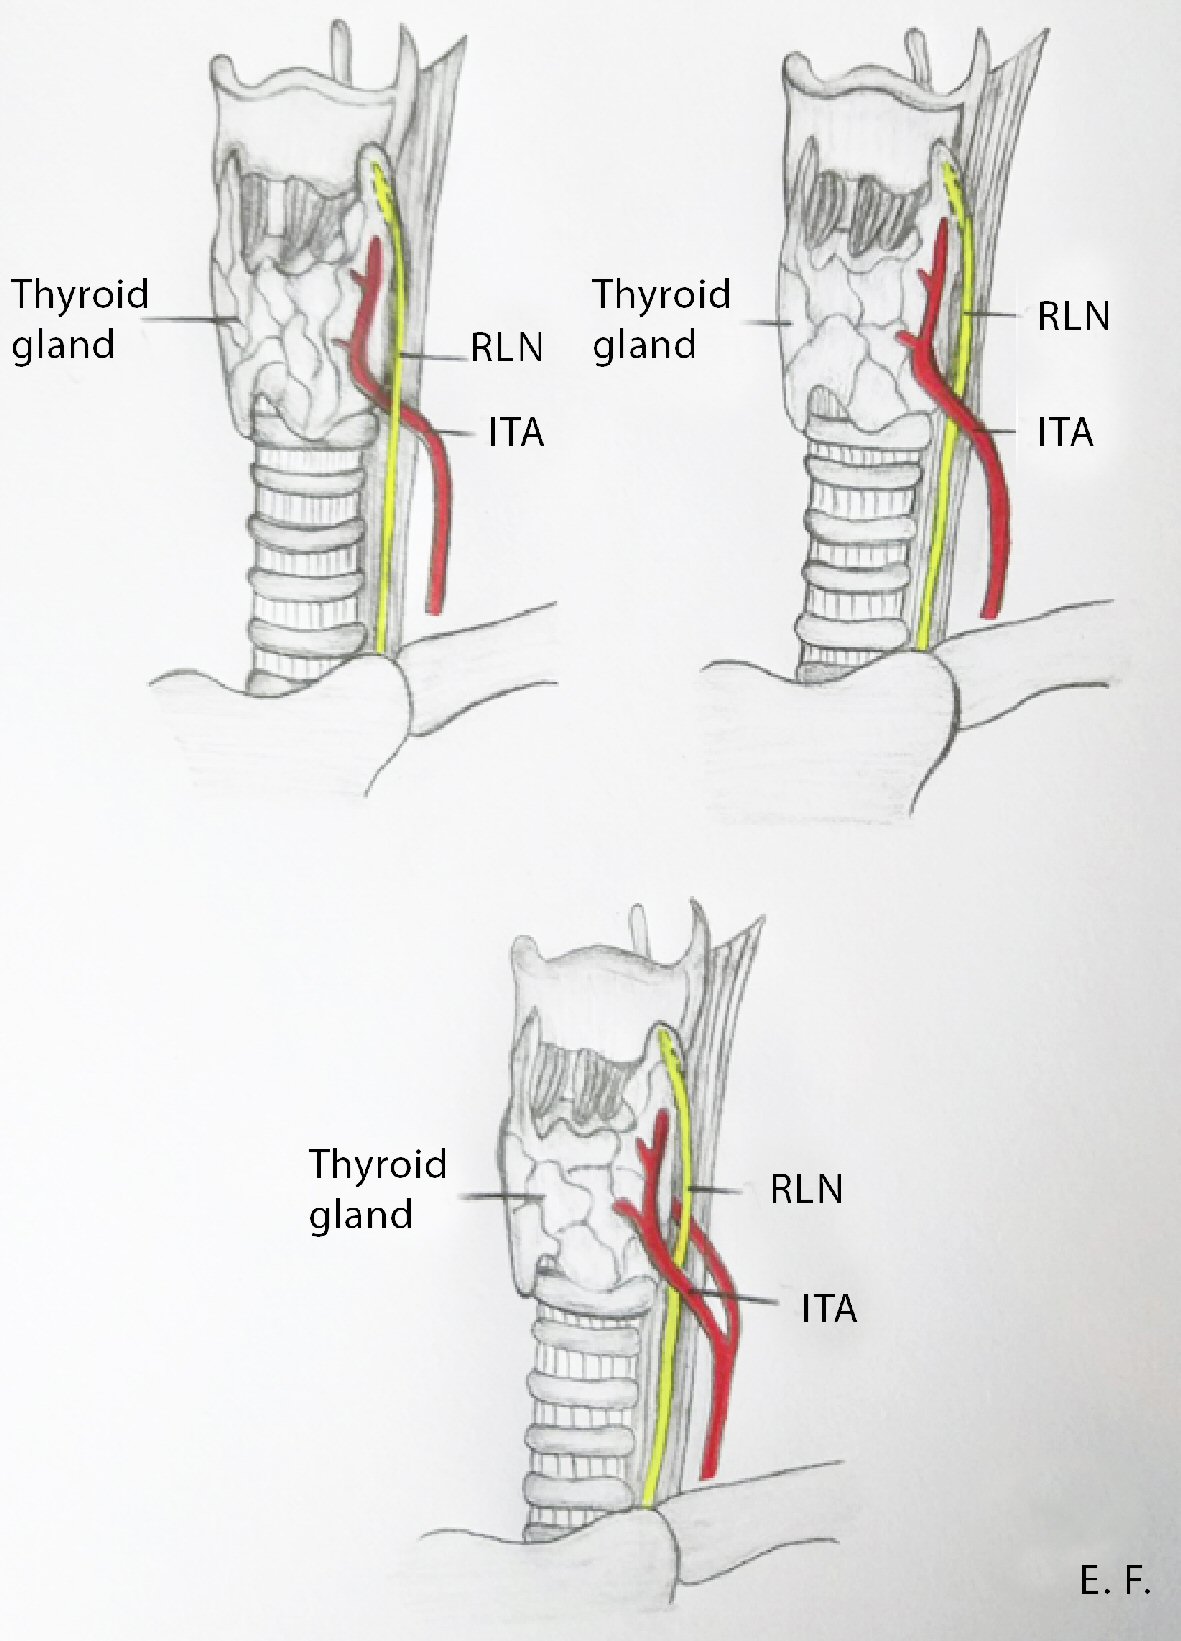
Figure 1. The anatomical relationships between the RLN and the ITA. RLN: recurrent laryngeal nerve; ITA: inferior thyroid artery.
| Journal of Clinical Medicine Research, ISSN 1918-3003 print, 1918-3011 online, Open Access |
| Article copyright, the authors; Journal compilation copyright, J Clin Med Res and Elmer Press Inc |
| Journal website https://www.jocmr.org |
Review
Volume 12, Number 10, October 2020, pages 640-646
The Anatomical Relationship of Inferior Thyroid Artery and Recurrent Laryngeal Nerve: A Review of the Literature and Its Clinical Importance
Figures
Tables
| Study | Type of patients | Number of RLN | RA | LA | A | RP | LP | P | B |
|---|---|---|---|---|---|---|---|---|---|
| C: cadavers; IP: intraoperative finding; RLN: recurrent laryngeal nerve; ITA: inferior thyroid artery; RA: right anterior, LA: left anterior, A: anterior, RP: right posterior, LP: left posterior, P: posterior, B: between. | |||||||||
| She et al, 2005 [1] | C | 99 | 30.3% | 38.4% | 31.3% | ||||
| Uen et al, 2006 [2] | C | 120 | 20.0% | 8.33% | 14.2% | 61.67% | 70.0% | 65.8% | 20.0% |
| Kuo et al, 2006 [3] | C | 91 | 20.9% | 59.3% | 19.7% | ||||
| Sultana et al, 2006 [4] | C | 120 | 27.5% | 30.8% | 40.0% | ||||
| Makay et al, 2008 [5] | IP | 487 | 23.8% | 18.9% | 21.4% | 63.66% | 70.6% | 67.2% | 12.9% |
| Altorjay et al, 2009 [6] | IP | 1,023 | 45.6% | 15.4% | 30.5% | 47.70% | 76.1% | 61.9% | 7.6% |
| Lee et al, 2009 [7] | C | 110 | 40.0% | 23.6% | 31.8% | 34.55% | 56.4% | 45.4% | 22.7% |
| Sun et al, 2010 [8] | IP | 566 | 1.94% | 64.8% | 31.9% | ||||
| Kaisha et al, 2011 [9] | C | 146 | 36.9% | 50.0% | 12.3% | ||||
| Matubis et al, 2011 [10] | C | 108 | 28.7% | 59.3% | 11.11% | ||||
| Zhang et al, 2011 [11] | C | 80 | 21.3% | 40.0% | 36.6% | ||||
| Lu et al, 2012 [12] | C | 100 | 22.0% | 43.0% | 35.0% | ||||
| Asgharpour et al, 2012 [13] | C | 246 | 32.9% | 35.8% | 31.3% | ||||
| Tang et al, 2012 [14] | C | 160 | 75.0% | 7.50% | 41.2% | 10.00% | 86.3% | 48.1% | 6.25% |
| Dai et al, 2014 [15] | IP | 342 | 30.9% | 62.9% | 6.14% | ||||
| Ozguner et al, 2014 [16] | C | 400 | 11.5% | 7.00% | 9.25% | 42.00% | 65.0% | 53.5% | 5.00% |
| Variables | Number of studies (number of nerves) | Anterior % (95% CI) | I2 % (95% CI) | Posterior % (95% CI) | I2 % (95% CI) | Between % (95% CI) | I2 % (95% CI) |
|---|---|---|---|---|---|---|---|
| CI: confidence interval. | |||||||
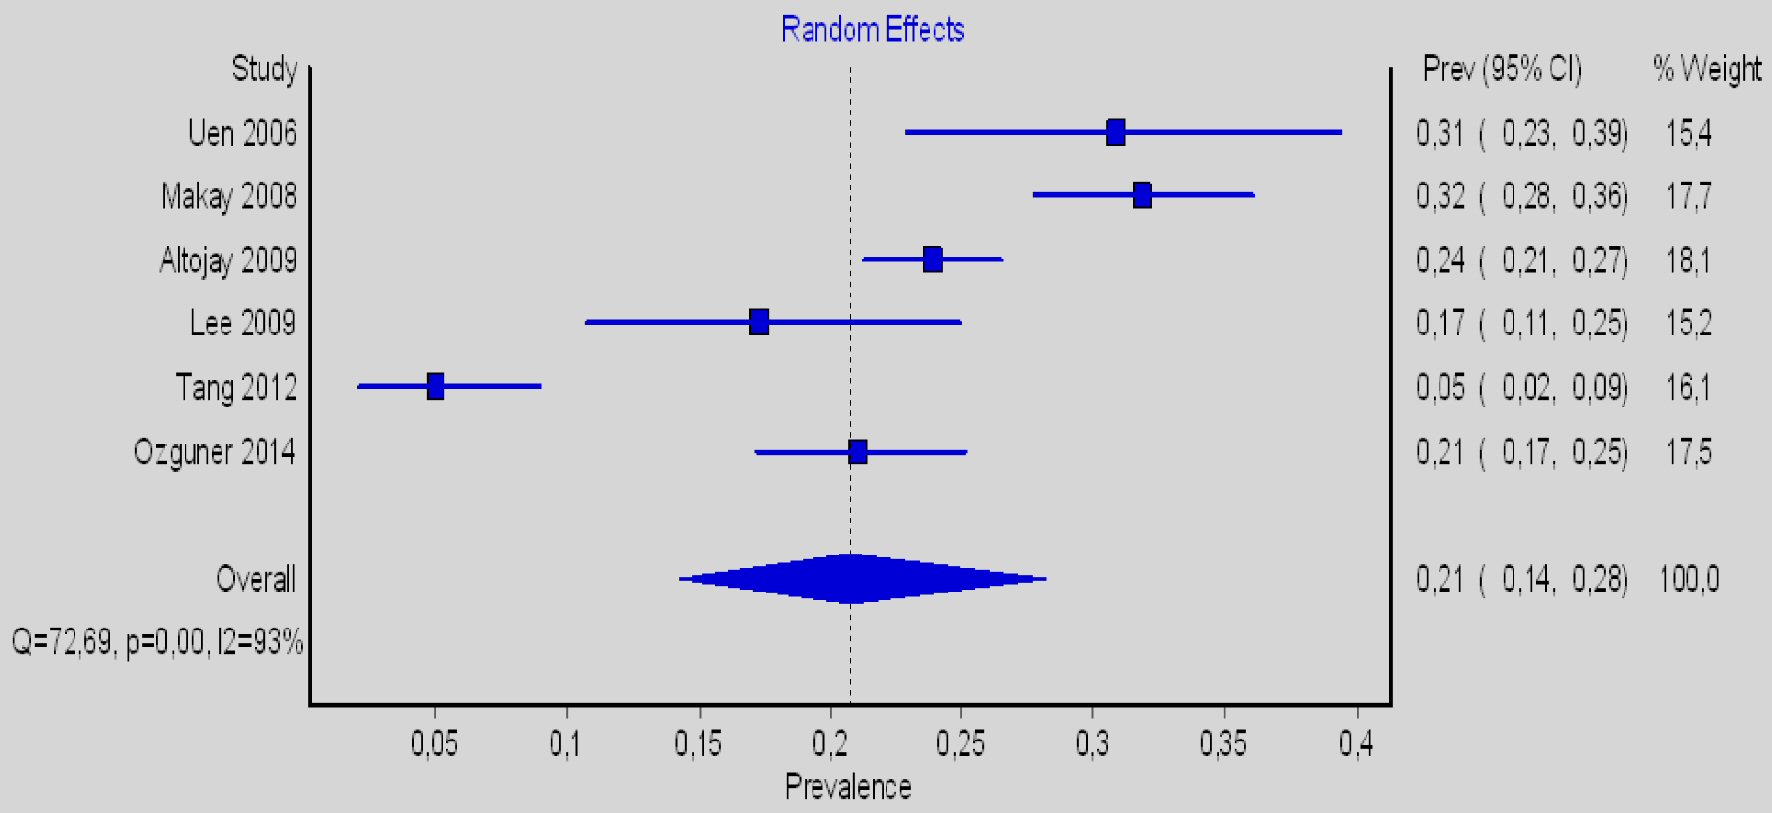
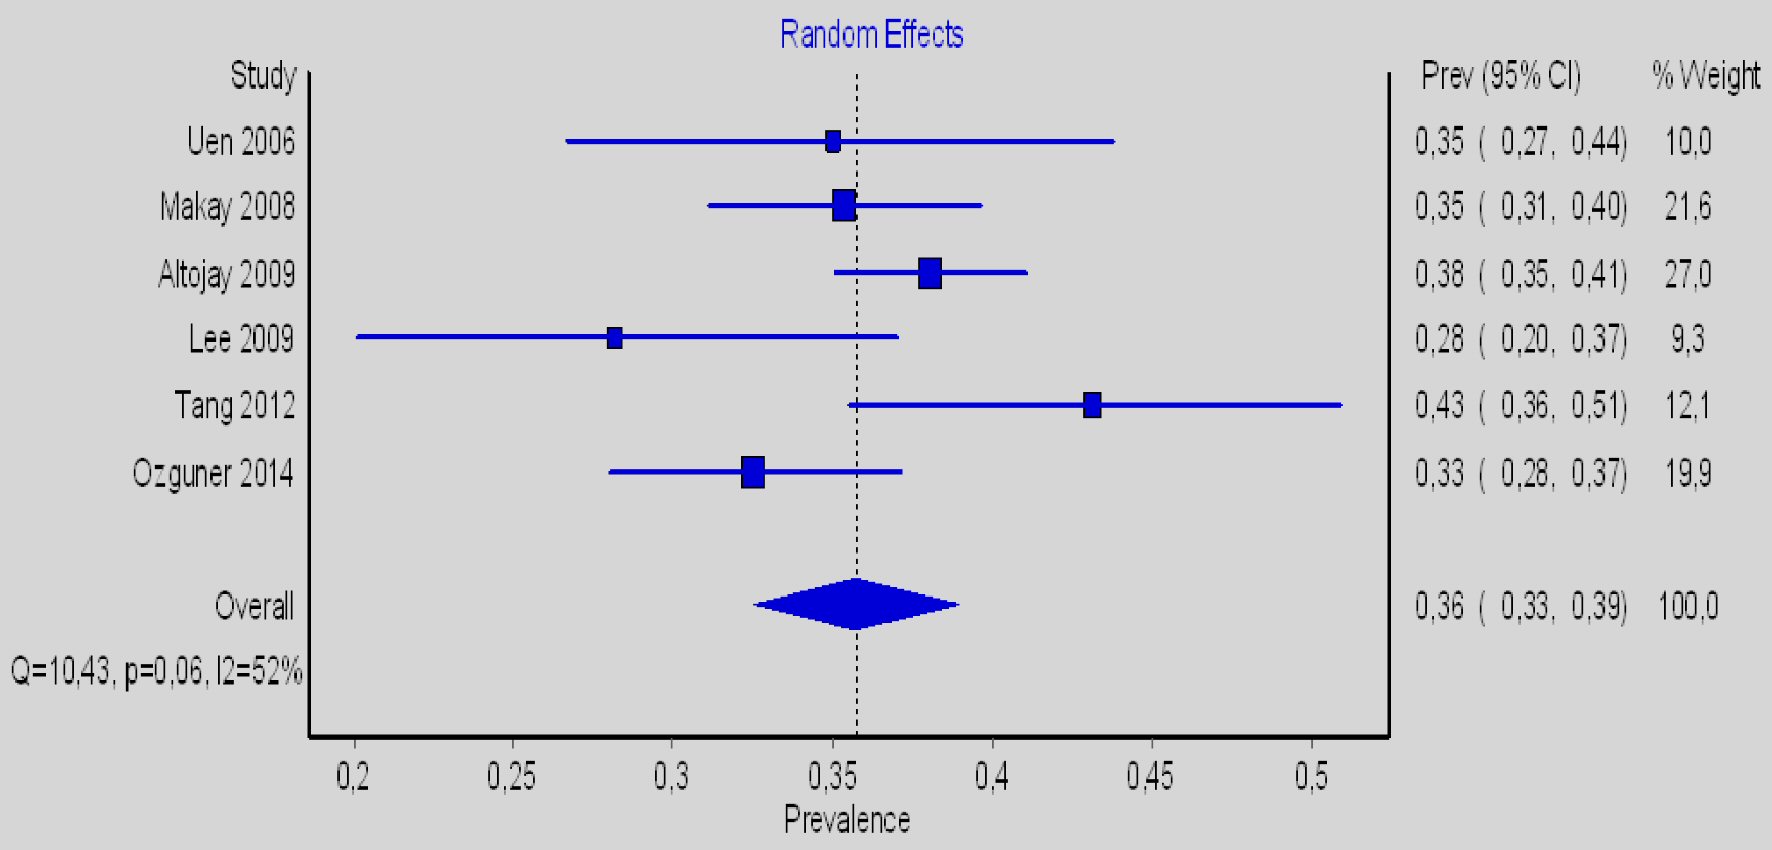
| Overall | 16 (4,198) | 23.9 (16.8 - 31.7) | 96.7 (95.6 - 97.4) | 52.1 (46.5 - 57.6) | 91.7 (88.1 - 94.2) | 18.9 (13.0 - 25.6) | 96.1(94.8 - 97.1) |
| Right | 6 (955) | 16.5 (8.96 - 25.7) | 95,9 (93.4 - 97.5) | 20.8 (14.2 - 28.2) | 93.1 (87.7 - 96.1) | ||
| Left | 6 (996) | 06.5 (4.31 - 9.10) | 77.2 (49.3 - 89.7) | 35.7 (32.6 - 38.9) | 52.1 (0 - 80.1) | ||