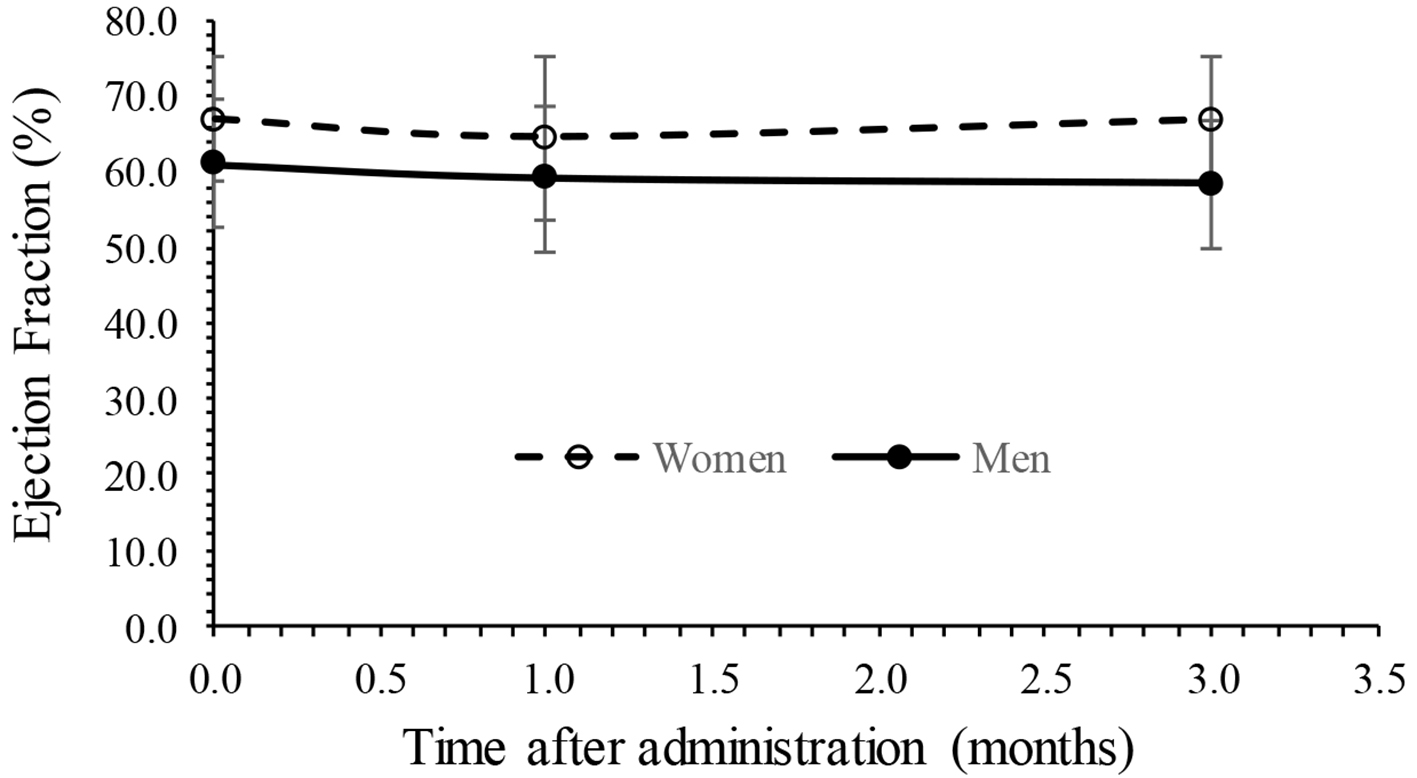
Figure 1. Interaction plot in EF between time and gender. EF: ejection fraction.
| Journal of Clinical Medicine Research, ISSN 1918-3003 print, 1918-3011 online, Open Access |
| Article copyright, the authors; Journal compilation copyright, J Clin Med Res and Elmer Press Inc |
| Journal website http://www.jocmr.org |
Original Article
Volume 12, Number 8, August 2020, pages 530-538
Gender Differences in Cardiac Function Following Three-Month Administration of Tofogliflozin in Patients With Diabetes Mellitus
Figures
Tables
| Variable | Men (N = 24) | Women (N = 32) |
|---|---|---|
| BMI: body mass index; NYHA: New York Heart Association; DPP-4: dipeptidyl peptidase-4; BG: biguanide; SU: sulphonylurea; ARB: angiotensin II receptor blocker; CCB: calcium channel blocker. | ||
| Age (years) | 80.2 ± 6.4 | 83.1 ± 6.4 |
| BMI | 23.1 ± 3.3 | 23.0 ± 3.5 |
| NYHA I/II (III, IV: none) | 22/2 | 28/2 |
| Co-administered drug | ||
| DPP-4 | 14 | 23 |
| BG | 7 | 11 |
| SU | 5 | 3 |
| Insulin | 0 | 0 |
| ARB | 6 | 6 |
| β-blocker | 5 | 4 |
| CCB | 10 | 17 |
| Diuretics | 4 | 13 |
| Variable | Baseline | 1 month | 3 months | P-value* |
|---|---|---|---|---|
| *Paired t-test compared to baseline with 3 months after administration. HbA1c: glycated hemoglobin; BNP: brain natriuretic peptide; eGFR: estimated glomerular filtration rate; BUN: blood urea nitrogen. | ||||
| HbA1c (%) | 7.4 ± 1.3 | 7.0 ± 1.0 | 6.7 ± 0.8 | < 0.01 |
| Body weight (kg) | 54.6 ± 10.9 | 52.5 ± 10.5 | 51.8 ± 10.1 | < 0.01 |
| Systolic blood pressure (mm Hg) | 138.4 ± 24.5 | 125.3 ± 16.9 | 128.0 ± 20.1 | < 0.01 |
| Diastolic blood pressure (mm Hg) | 72.0 ± 13.8 | 70.5 ± 11.5 | 72.5 ± 12.6 | 0.81 |
| Hematocrit | 37.9 ± 6.9 | 38.4 ± 5.9 | 38.4 ± 5.9 | 0.3 |
| BNP (pg/mL) | 222.8 ± 378.5 | 149.6 ± 240.2 | 186.8 ± 270.6 | 0.11 |
| eGFR | 60.5 ± 23.2 | 58.2 ± 24.3 | 59.3 ± 28.4 | 0.54 |
| BUN (mg/dL) | 19.9 ± 9.9 | 19.7 ± 7.2 | 19.5 ± 7.8 | 0.74 |
| Na+ (mEq/L) | 138.8 ± 3.5 | 139.5 ± 3.0 | 140.5 ± 3.3 | < 0.01 |
| K+ (mEq/L) | 4.2 ± 0.6 | 4.2 ± 0.5 | 4.2 ± 0.5 | 0.78 |
| Cl- (mEq/L) | 102.5 ± 12.2 | 104.4 ± 5.0 | 106.0 ± 3.3 | < 0.05 |
| Blood osmotic pressure (mOsm/L) | 292.8 ± 7.2 | 292.6 ± 7.3 | 295.1 ± 7.1 | < 0.05 |
| Variable | Baseline | 1 month | 3 months | P-value* |
|---|---|---|---|---|
| *Paired t-test compared to baseline with 3 months after administration. EF: ejection fraction; E/A: early filling/atrial filling; E/e': change in inflow E and mitral e' annular velocities; LAD: left atrial dimension; IVCmax: maximal diameter of inferior vena cava. | ||||
| EF | 64.5 ± 8.9 | 62.3 ± 10.6 | 63.3 ± 9.3 | 0.25 |
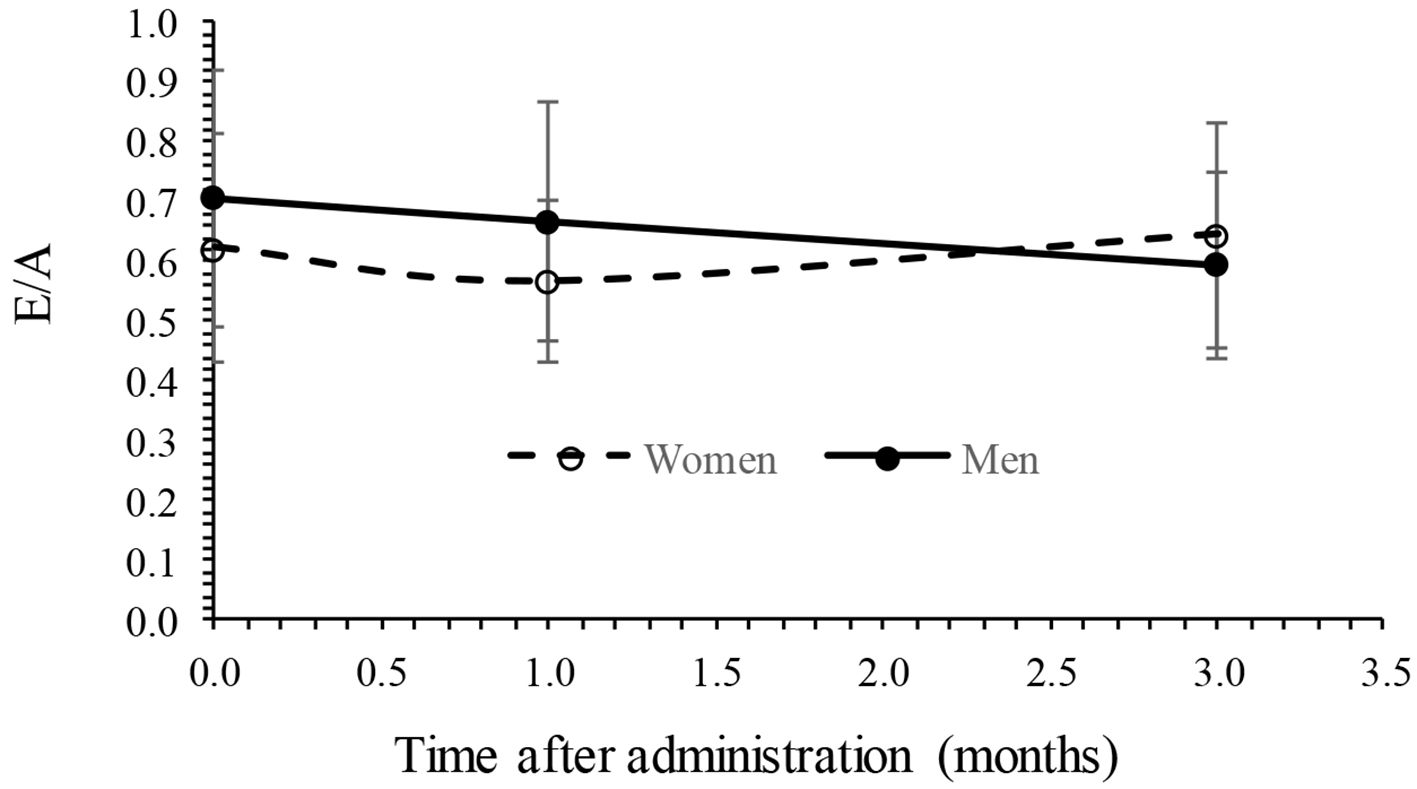
| E/A | 0.69 ± 0.32 | 0.60 ± 0.18 | 0.62 ± 0.17 | 0.31 |
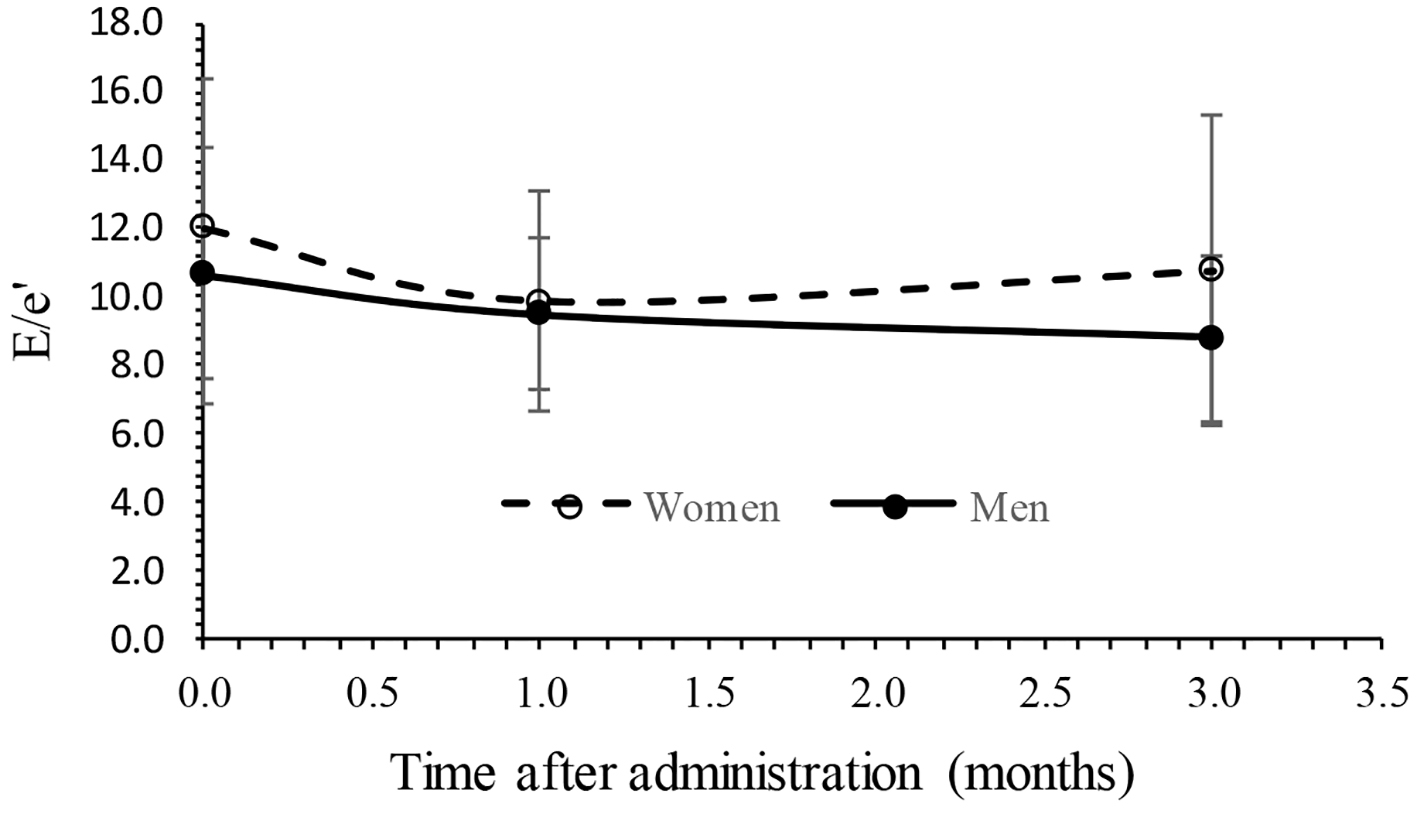
| E/e' | 11.7 ± 3.9 | 9.9 ± 2.9 | 10.1 ± 3.9 | < 0.05 |
| LAD (mm) | 38.8 ± 6.8 | 37.4 ± 6.7 | 37.6 ± 6.4 | 0.19 |
| IVCmax (mm) | 13.7 ± 3.5 | 13.5 ± 3.7 | 13.7 ± 3.6 | 0.61 |
| SOV | df | Sum sq. | Mean sq. | F | P-value |
|---|---|---|---|---|---|
| Analysis of variance table for the mixed effects model. EF: ejection fraction; SOV: source of variance; df: degree of freedom; Sum sq.: sum of squares; Mean sq.: mean squares; F: F statistic. | |||||
| Time | 2 | 125.1 | 62.5 | 2.4 | 0.10 |
| Subjects | 52 | 10,305.0 | 198.2 | 7.5 | < 0.01 |
| Gender | 1 | 1,796.5 | 1,796.5 | 9.1 | < 0.01 |
| Time × gender | 2 | 81.1 | 40.5 | 1.5 | 0.22 |
| Error | 105 | 2,760.2 | 26.3 | ||
| Total | 162 | 15,067.8 | |||
| SOV | df | Sum sq. | Mean sq. | F | P-value |
|---|---|---|---|---|---|
| Analysis of variance table for the mixed effects model. E/A: early filling/atrial filling; SOV: source of variance; Sum sq.: sum of squares; df: degree of freedom; Mean sq.: mean squares; F: F statistic. | |||||
| Time | 2 | 0.04 | 0.02 | 2.7 | 0.07 |
| Subjects | 35 | 2.6 | 0.1 | 8.9 | < 0.01 |
| Gender | 1 | 0.05 | 0.05 | 0.7 | 0.40 |
| Time × gender | 2 | 0.12 | 0.06 | 7.2 | < 0.01 |
| Error | 105 | 0.87 | 0.01 | ||
| Total | 162 | 3.7 | |||
| SOV | df | Sum sq. | Mean sq. | F | P-value |
|---|---|---|---|---|---|
| Analysis of variance table for the mixed effects model. E/e': change in inflow E and mitral e' annular velocities; SOV: source of variance; Sum sq.: sum of squares; df: degree of freedom; Mean sq.: mean squares; F: F statistic. | |||||
| Time | 2 | 60.9 | 30.5 | 11.5 | < 0.01 |
| Subjects | 52 | 1012.9 | 19.5 | 7.4 | < 0.01 |
| Gender | 1 | 36.9 | 36.9 | 1.9 | 0.17 |
| Time × gender | 2 | 11.1 | 5.6 | 2.1 | 0.13 |
| Error | 105 | 277.3 | 2.6 | ||
| Total | 162 | 1,399.1 | |||