| Volume of the thyroid gland, mL (n) | 37.3 ± 27.3 (181) | 25.5 ± 11.0 (22) | < 0.01* |
| Volume of thyroid nodule, mL (n) | 11.7 ± 7.1 (283) | 3.9 ± 2.4 (31) | < 0.01* |
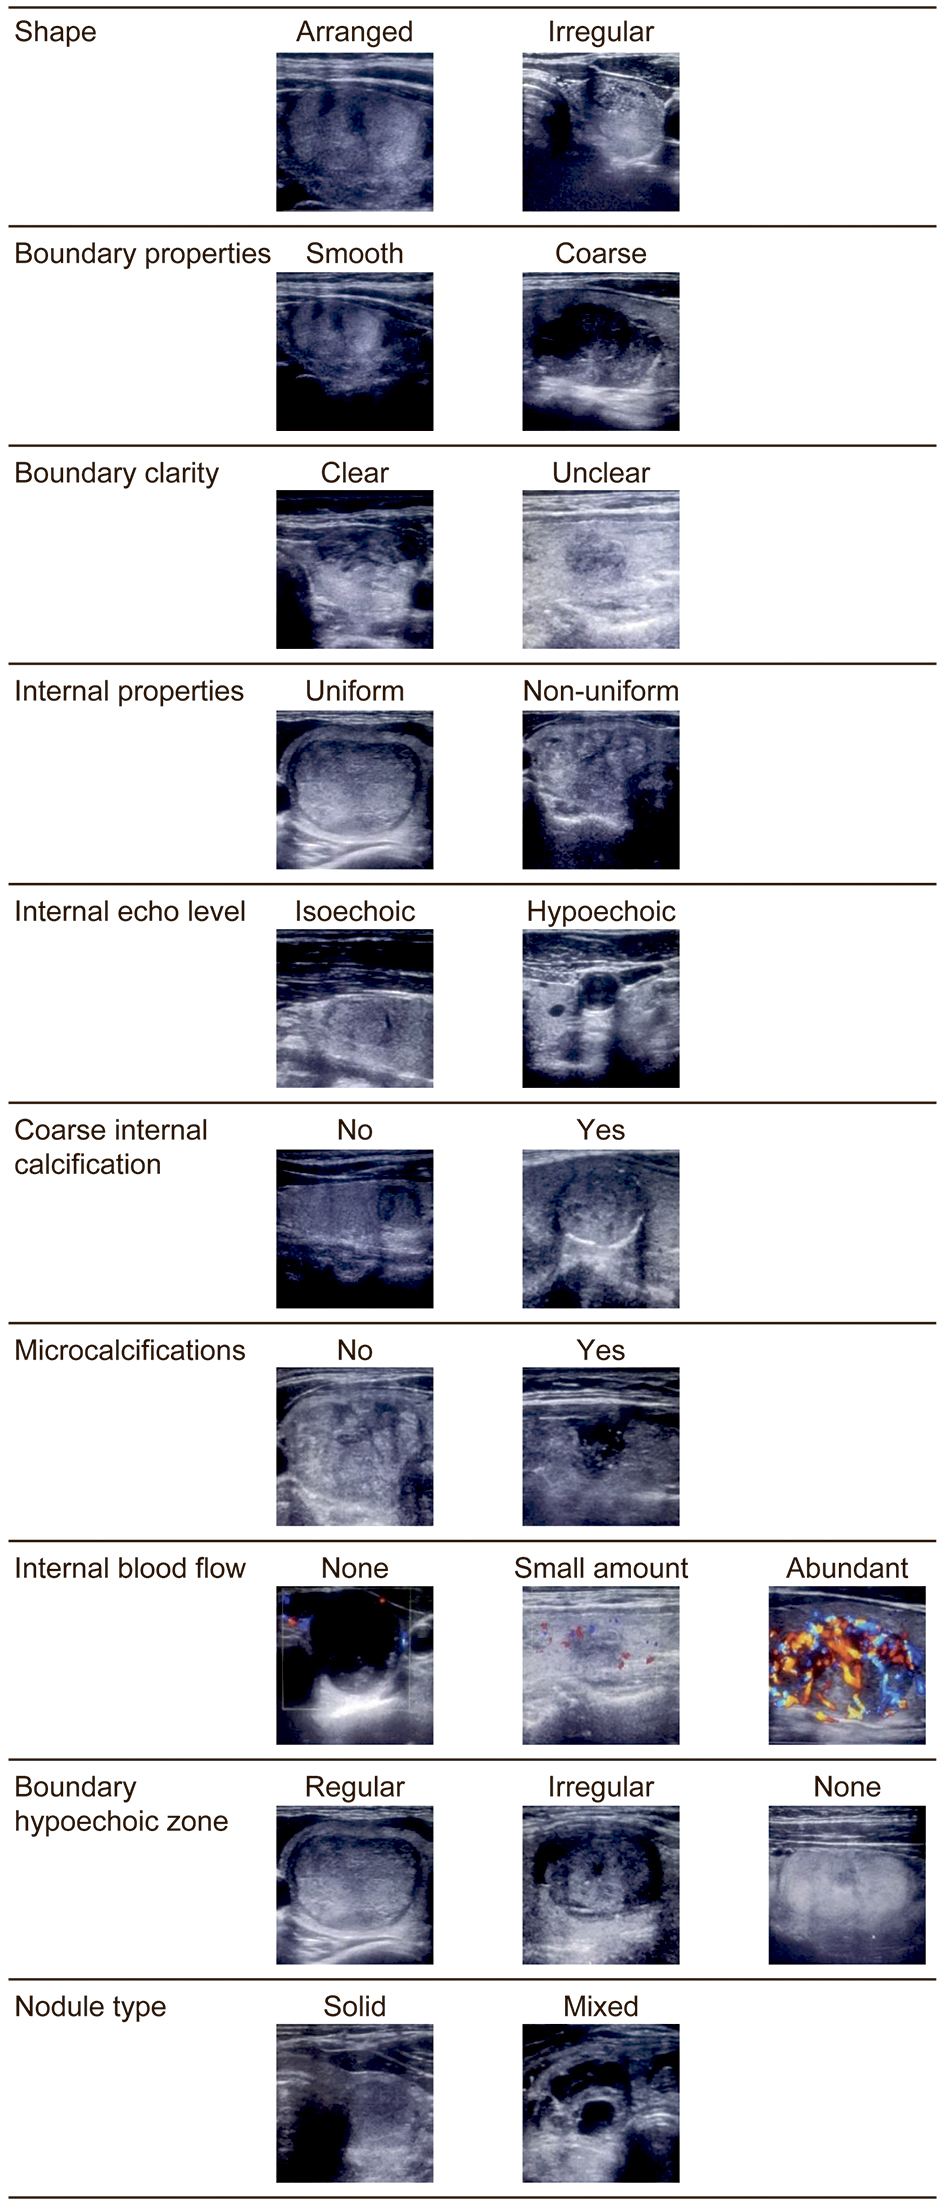
| Shape, % (n) | | | 0.10† |
| Arranged | 53.9% (159) | 38.7% (12) | |
| Irregular | 46.1% (136) | 61.3% (19) | |
| Boundary properties, % (n) | | | 0.29† |
| Smooth | 56.7% (166) | 46.9% (15) | |
| Coarse | 43.3% (127) | 53.1% (17) | |
| Boundary clarity, % (n) | | | 0.51† |
| Clear | 62.2% (184) | 56.3% (18) | |
| Unclear | 37.8% (112) | 43.8% (14) | |
| Internal properties, % (n) | | | 0.74† |
| Uniform | 31.5% (93) | 34.4% (11) | |
| Non-uniform | 68.5% (202) | 65.6% (21) | |
| Internal echo level, % (n) | | | < 0.01† |
| Isoechoic | 68.1% (201) | 46.9% (15) | |
| Hypoechoic | 31.9% (94) | 53.1% (17) | |
| Coarse internal calcification, % (n) | | | 0.09‡ |
| Presence | 12.5% (37) | 3.1% (1) | |
| Absence | 37.5% (259) | 96.9% (31) | |
| Microcalcifications, % (n) | | | < 0.01† |
| Presence | 24.1% (71) | 62.5% (20) | |
| Absence | 75.9% (224) | 37.5% (12) | |
| Internal blood flow, % (n), [Adjusted standardized value] | | | < 0.05† |
| Abundant | 27.1% (79) [-2.0] | 43.8% (14) [+2.0] | |
| Small amount | 49.8% (145) [0] | 50% (16) [0] | |
| None | 23% (67) [+2.2] | 6.23% (2) [-2.2] | |
| Boundary hypoechoic zone, % (n) | | | 0.28‡ |
| Regular | 14.0% (41) | 9.4% (3) | |
| Irregular | 12.3% (36) | 21.9% (7) | |
| None | 73.6% (215) | 68.8% (22) | |
| Nodule type, % (n) | | | < 0.01‡ |
| Solid | 59.1% (176) | 97.0% (32) | |
| Mixed | 40.9% (122) | 3.0% (1) | |