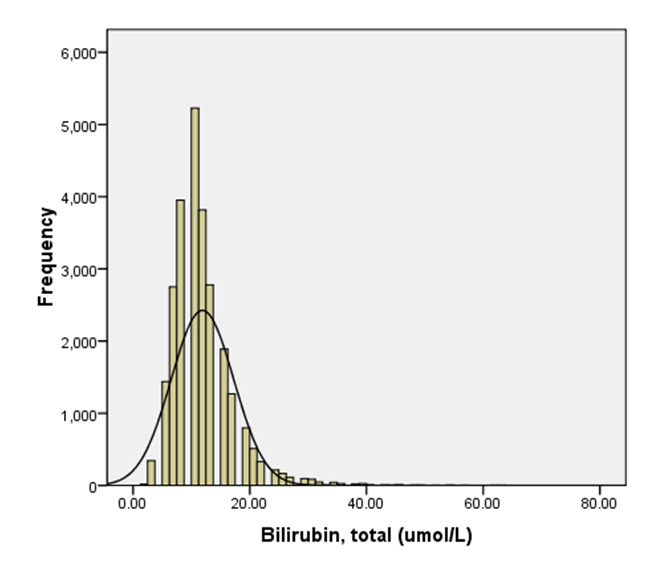
Figure 1.. Distribution of Bilirubin (TBili) levels in the target population.
| Journal of Clinical Medicine Research, ISSN 1918-3003 print, 1918-3011 online, Open Access |
| Article copyright, the authors; Journal compilation copyright, J Clin Med Res and Elmer Press Inc |
| Journal website http://www.jocmr.org |
Original Article
Volume 2, Number 5, October 2010, pages 201-206
High Total Bilirubin as a Protective Factor for Diabetes Mellitus: An Analysis of NHANES Data From 1999 - 2006
Figures
Table
| Serum TBili < 10 micromole/liter | Serum TBili ≥10 micromole/liter | |
|---|---|---|
| Age 20 - 39 | 32.28% SE 1.18 | 67.72% SE 1.18 |
| 40 - 59 | 28.93% SE 0.93 | 71.07% SE 0.93 |
| 60 and above | 27.43% SE 1.15 | 72.57% SE 1.15 |
| Male | 17.83% SE 0.80 | 82.16% SE 0.80 |
| Female | 40.45% SE 1.04 | 59.55% SE 1.04 |
| Edu < High school | 37.09% SE 1.39 | 62.91% SE 1.39 |
| Edu > High school | 28.21% SE 0.81 | 71.79% SE 0.81 |
| Non-black | 28.82% SE 0.86 | 71.18% SE 0.86 |
| Black | 39.01% SE 2.01 | 60.94% SE 2.01 |
| Non smoker | 28.51% SE 0.95 | 71.49% SE 0.95 |
| Smoking | 31.34% SE 1.02 | 68.66% SE 1.02 |
| No alcohol consumption | 28.98% SE 1.20 | 71.02% SE 1.20 |
| Moderate alcohol consumption | 28.36% SE 1.16 | 71.64% SE 1.16 |
| Heavy alcohol consumption | 32.12% SE 1.02 | 67.89% SE 1.02 |
| Low triclycerides | 28.87% SE 0.79 | 71.13% SE 0.79 |
| High triclycerides | 32.13% SE 1.23 | 67.87% SE 1.23 |
| Lower waist circumference | 25.52% SE 0.86 | 74.48% SE 0.86 |
| Higher waist circumference | 34.30% SE 1.05 | 65.70% SE 1.05 |
| BMI less than 25 | 28.14% SE 1.01 | 71.86% SE 1.01 |
| 25 - 29 | 27.11% SE 1.02 | 72.89% SE 1.02 |
| 30 and above | 35.00% SE 1.21 | 65.00% SE 1.01 |