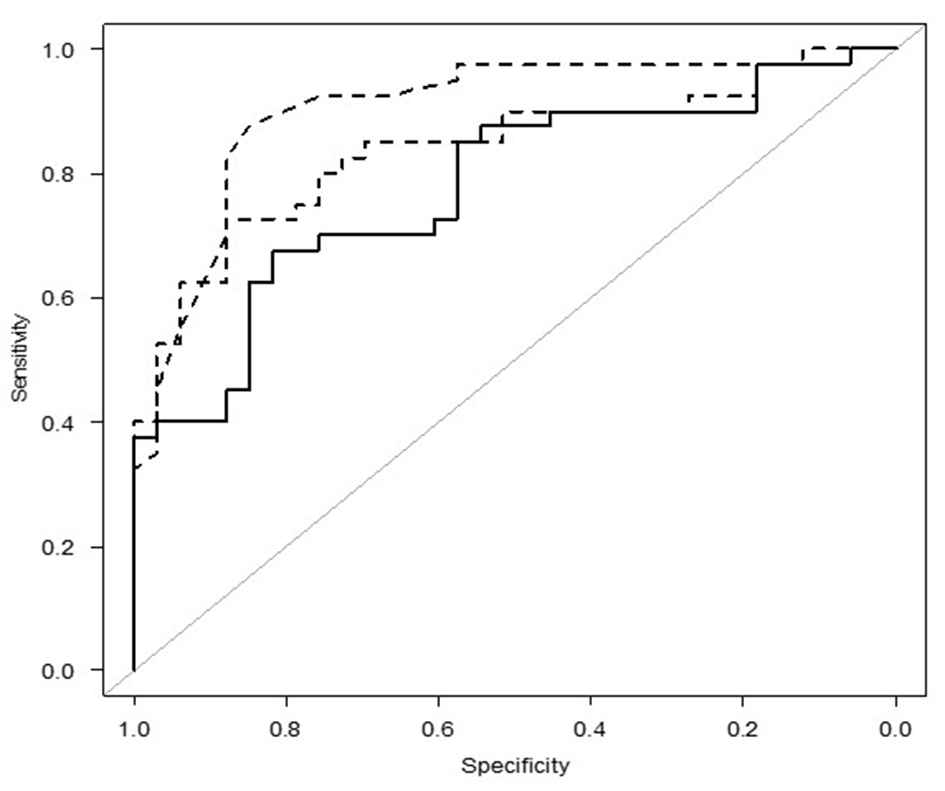
Figure 1. The ROC curve of the UACR, FCU, and the Simkin index for predicting renal UA underexcretion. ROC: receiver operating characteristic; UACR: urinary uric acid to creatinine ratio; FCU: fractional clearance of urate.
| Journal of Clinical Medicine Research, ISSN 1918-3003 print, 1918-3011 online, Open Access |
| Article copyright, the authors; Journal compilation copyright, J Clin Med Res and Elmer Press Inc |
| Journal website http://www.jocmr.org |
Original Article
Volume 12, Number 7, July 2020, pages 443-447
Diagnostic Accuracy of Single Spot Urine for Detecting Renal Uric Acid Underexcretion in Men
Figure
Tables
| Variables | Renal UA clearance (mL/min) | P value | |
|---|---|---|---|
| ≥ 7.3 (n = 33) | < 7.3 (n = 40) | ||
| Mean (standard deviation), median (25%, 75%), or %. BMI: body mass index; AST: aspartate aminotransferase; ALT: alanine transferase; GGT: γ-glutamyl transferase; UA: uric acid; SCr: serum creatinine; eGFR: estimated glomerular filtration rate; UACR: urinary uric acid to creatinine ratio; FCU: fraction clearance of urate. | |||
| Age, years | 46.4 (12.0) | 56.1 (10.4) | < 0.001 |
| BMI, kg/m2 | 24.4 (3.3) | 24.4 (2.8) | 0.982 |
| AST, IU/L | 25.8 (8.2) | 21.7 (10.1) | 0.067 |
| ALT, IU/L | 30.5 (19.1) | 24.9 (19.3) | 0.221 |
| GGT, IU/L | 43.7 (31.1) | 38.3(29.2) | 0.451 |
| Serum UA, mg/dL | 6.7 (0.5) | 6.9 (0.6) | 0.174 |
| SCr, mg/dL | 0.91 (0.13) | 0.97 (0.12) | 0.026 |
| eGFR, mL/min/1.73 m2 | 74.29 (12.78) | 64.34 (9.01) | < 0.001 |
| UACR | 0.52 (0.07) | 0.40 (0.08) | < 0.001 |
| FCU | 0.07 (0.01) | 0.06 (0.01) | < 0.001 |
| Simkin index | 0.47 (0.08) | 0.39 (0.08) | < 0.001 |
| Alcohol consumption, g/week | 56.0 (0, 134.4) | 14.0 (0, 128.2) | 0.416 |
| Medication, % | |||
| Hypertension | 6.1 | 7.5 | > 0.999 |
| Diabetes | 6.1 | 0 | 0.201 |
| Variables | Cutoff | Sn, % | Sp, % | PPV, % | NPV, % | DA, % | +LR | -LR | AUC (95% CI) | P valuea | P valueb |
|---|---|---|---|---|---|---|---|---|---|---|---|
| UACR = UUA/UCr; FCU = (UUA × SCr)/(SUA × UCr); Simkin index = UUA × SCr/UCr. avs. FCU; bvs. Simkin index. UACR: urinary uric acid to creatinine ratio; FCU: fraction clearance of urate; Sn: sensitivity; Sp: specificity; PPV: positive predictive value; NPV: negative predictive value; DA: diagnostic accuracy; +LR: positive likelihood ratio; -LR: negative likelihood ratio; AUC: area under the curve; UUA: urine uric acid; UCr: urine creatinine; SCr: serum creatinine. | |||||||||||
| UACR | 0.460 | 89.2 | 80.6 | 82.5 | 87.9 | 84.9 | 4.59 | 0.13 | 0.903 (0.830 - 0.976) | 0.158 | 0.004 |
| FCU | 0.060 | 67.5 | 87.9 | 87.1 | 69.0 | 76.7 | 5.57 | 0.37 | 0.841 (0.749 - 0.933) | - | 0.013 |
| Simkin index | 0.399 | 81.2 | 65.9 | 65.0 | 81.8 | 72.6 | 2.38 | 0.29 | 0.779 (0.673 - 0.885) | 0.013 | - |