Journal of Clinical Medicine Research, ISSN 1918-3003 print, 1918-3011 online, Open Access
Article copyright, the authors; Journal compilation copyright, J Clin Med Res and Elmer Press Inc
Journal website https://www.jocmr.org

Original Article

Volume 13, Number 4, April 2021, pages 230-236


Impact of Body Mass Index on COVID-19-Related In-Hospital Outcomes and Mortality

Figures

Figure 1.
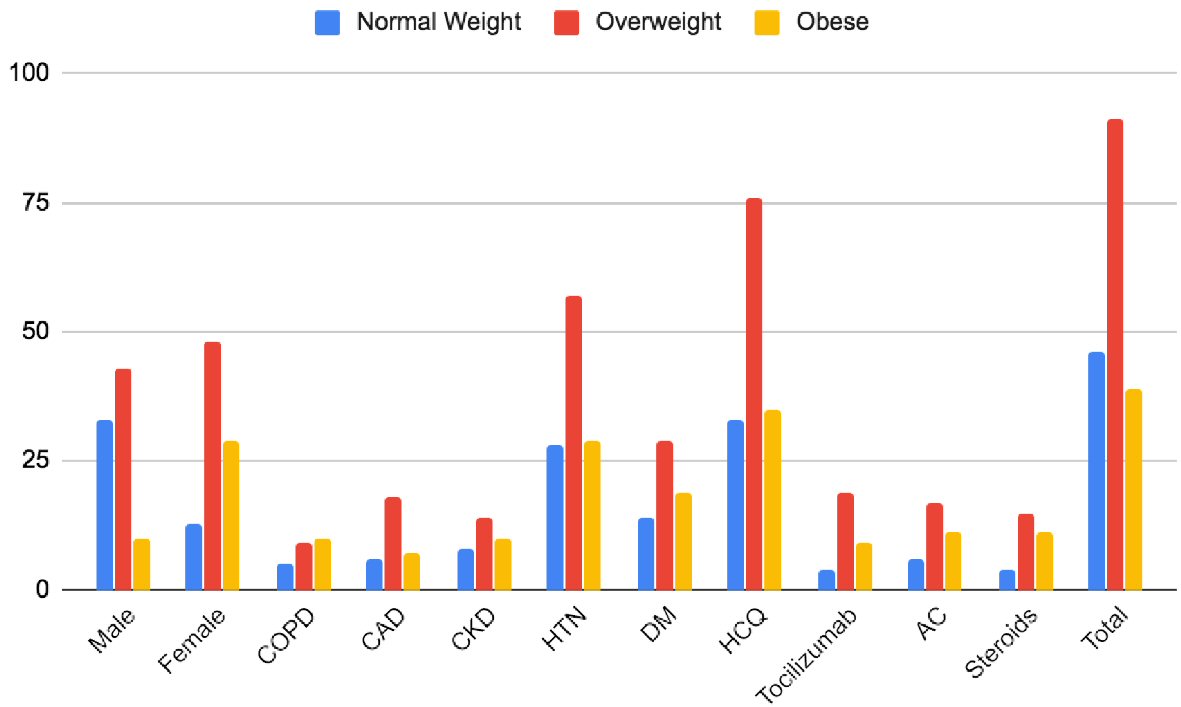
Figure 1. Baseline characteristics of patients in different groups. CAD: coronary artery disease; COPD: chronic obstructive pulmonary disease; CKD: chronic kidney disease; HTN: hypertension; DM: diabetes mellitus; HCQ: hydroxychloroquine; AC: anticoagulation.
Figure 2.
Figure 2. Forest plots comparing in-hospital endpoints across high and lower BMI groups. BMI: body mass index.
Figure 3.
Figure 3. Mean BMI values and number of patients across different in-hospital endpoints. BMI: body mass index.

Tables

Table 1. Baseline Characteristics of the Included Population Across Comparison Groups
 
BMI < 34.9BMI > 35P value
*P < 0.05. BMI: body mass index; CAD: coronary artery disease; COPD: chronic obstructive pulmonary disease; CKD: chronic kidney disease; HTN: hypertension; DM: diabetes mellitus; HCQ: hydroxychloroquine; AC: anticoagulation.
Male76 (88.4%)10 (11.6%)0.001*
Female61 (67.8%)29 (32.2%)
CAD24 (77.4%)7 (22.6%)0.95
COPD14 (58.3%)10 (41.7%)0.013*
CKD22 (68.8%)10 (31.3%)0.171
HTN85 (74.6%)29 (25.4%)0.155
DM43 (69.4%)19 (30.6%)0.046*
Tocilizumab23 (71.9%)9 (28.1%)0.369
HCQ109 (75.7%)35 (24.3%)0.146
Steroids19 (63.3%)11 (36.7%)0.036*
AC23 (67.6%)11 (32.4%)0.111


Table 2. Mean BMI Values Across Different Outcomes and Medication Groups
 
OutcomeNBMI, mean ± SDMean difference (95% CI)P value
SD: standard deviations; CI: confidence interval; BMI: body mass index; HCQ: hydroxychloroquine; AC: anticoagulation.
Alive15530.2 ± 8.9-5.15 (-9.5 to -7.4)0.022
Death2135.4 ± 13.8
No dialysis16630.6 ± 9.8-3.3 (-9.6 to 2.90)0.29
Dialysis1034.0 ± 6.6
No ventilator11629.2 ± 8.4-4.7 (-7.7 to -1.7)0.002
Ventilator6033.9 ± 11.2
No upgrade12030.1 ± 9.9-2.2 (-5.3 to 0.82)0.14
Upgrade5632.3 ± 9.1
No AC14230.3 ± 9.5-2.7 (-6.4 to 9.0)0.14
AC3433.1 ± 6.1
No steroids14629.8 ± 8.6-5.8 (-9.6 to -2.09)0.002
Steroids3035.7 ± 13
No tocilizumab14430.5 ± 10.3-1.45 (-5.2 to 2.3)0.44
Tocilizumab3232.0 ± 6.3
No HCQ3227.2 ± 6.17-4.3 (-8.09 to -0.68)0.21
HCQ14431.6 ± 10.20


Table 3. Unadjusted and Adjusted Odds Ratios of Outcomes in Normal and Obese BMI Groups
 
OutcomesNBMI < 34BMI > 35Unadjusted oddsP valueAdjusted odds ratio (aOR)P value
BMI: body mass index.
Vent6038 (28%)22 (56%)OR 3.3 (1.6 - 7.0)0.002aOR 2.6 (1.17 - 6.1)0.01
No vent11699 (72%)17 (44%)
Upgrade5638 (28%)18 (46%)OR 2.2 (1.07 - 4.6)0.04aOR 1.7 (0.7 - 3.9)0.17
No upgrade12099 (72%)21 (54%)
Dialysis105 (4%)5 (13%)OR 3.8 (1.1 - 14.1)0.07aOR 3.6 (0.8 - 15.7)0.08
No dialysis166132 (96%)34 (87%)
Died2313 (9%)10 (21%)OR 3.2 (1.3 - 8.2)0.01aOR 2.9 (1.1 - 6.0)0.02
Alive153124 (91%)29 (79%)